Abstract
In this paper we present a method for autofocusing images of sputum smears taken from a microscope which combines the finding of the optimal focus distance with an algorithm for extending the depth of field (EDoF). Our multifocus fusion method produces an unique image where all the relevant objects of the analyzed scene are well focused, independently to their distance to the sensor. This process is computationally expensive which makes unfeasible its automation using traditional embedded processors. For this purpose a low-cost optimized implementation is proposed using limited resources embedded GPU integrated on cutting-edge NVIDIA system on chip. The extensive tests performed on different sputum smear image sets show the real-time capabilities of our implementation maintaining the quality of the output image.
OCIS codes: (100.0100) Image processing; (180.0180) Microscopy; (330.0330) Vision, color, and visual optics
1. Introduction
In the last decade, several image processing applications have been developed for analyzing and processing acquired images with optical instrumentation such as microscopes. The main goal of these kind of applications is to obtain a high quality image for helping experts in the diagnosis using automatic procedures. The overall quality of the process is directly related to the design of automatic focusing algorithms [1]. However, very often the sample contains objects of different sizes and thickness, making necessary to move the focus closer or further to get all the relevant information in the scene. A clear example is the identification of the Tuberculosis Bacilli (TB).
The manual identification of TB is routinely performed in sputum smears dyed with fluoroscope Auramine O, using a fluorescence microscope, being a non-invasive method which allows to repeat the examinations. Manual screening for the identification of bacilli involves an intensive and tedious task with a high false negative rate [2]. Automatic screening will entail several advantages, e. g., a substantial reduction in the labor workload of the clinicians and a better accuracy in diagnosis by increasing the number of images that can be analyzed by the computer.
Autofocus methods can be broadly classified as active and passive. Active methods are based on the emission of certain kind of waves (ultrasound or electromagnetic) for measuring the distance between the object and the lens [3]. These methods achieve good results except when the object is near to the lens or when it is behind another transparent object, as is the case of microscopy. On the other hand, passive methods [4] are based on extracting the high frequency contents or the edge information from images. The passive methods present problems when the lighting of the image is poor or when the contrast is low. Nevertheless, they work well in certain kind of applications such as the microscopy [5] under controlled setting and light conditions.
The passive aforementioned algorithms are computationally intensives due to several reasons and to overcome this problem three main approaches have been addressed. The first one is related with designing custom hardware for accelerating the algorithms. In [6] and [7] authors propose autofocus systems based on a window-based processed architecture, which is implemented using an FPGA device. This approach offers real-time systems but at the cost of large development times and low flexibility. The second one deals with high-end desktop processors, which execute image processing software tools like Matlab. These tools and associated libraries facilitate the development and tuning of algorithms but the final result lacks of the required performance. Finally, the use of Graphic Processing Unit (GPU) boards has been proposed to assist desktop computers by parallelizing autofocus algorithms. In [8] authors applied desktop GPU board to digital holographic microscopy (DHM) obtaining 24 frames reconstructed per second (frps) with resolution of 512×512. Dogar et al. [9], improved that result up to 70frps (1024×1024 resolution) employing a 1334-core GPU. Similarly, Kang et al. [13] employed a GPU populated with 2880 cores for real-time volumetric display of optical-resolution photoacoustic microscopy (OR-MAP). They reached an impressive refreshing rate of 480fps of low resolution (736×500) images. Both methods, DHM and OR-MAP, mainly rely on FFT transforms which requires O(M * N * log(M * N)) operations, being M * N the size of the image, therefore massively parallel GPUs are needed to process even low resolution images. Also First-Derivative methods have taken advantage of GPU architectures showing promising results [10]. Since these methods can be implemented by means of 2D convolutions, the computational complexity can be limited to O(M * N *k *k), being k the kernel size, or even O(M * N *2*k) in the case of separable filters. This fact opens the way to the employment of reduced versions of GPU architectures, integrated in System on Chip devices (SoCs), for implementing high resolution real-time autofocus systems. Although these new devices have limited resources, about one order of magnitude less of cores and reduced memory bandwidth, they represent an opportunity for obtaining feasible low-cost embedded systems.
In this context the contribution of the paper is twofold. Firstly, to present an autofocusing method, named Multifocus Fusion method, which improves the quality of the final result for TB identification. Secondly, to propose an efficient low-cost implementation based on the limited resources of an embedded GPU System on Chip architecture, able to fulfill the time constraints of an automated optical microscope. In contrast to other faster autofocusing approaches [11, 12] our method is specifically designed to deal with TB samples, which makes the processing more computationally demanding. It implies the usage of custom filters for removing impurities from the samples. Also the different size and thickness of the specimens within a frame have to be taken into account. To this end, an Extended Depth of Field (EDoF) technique is included to obtain an unique multifocus image with all the relevant information about the analyzed scene. For assessing our proposal, extensive test were performed using TB images as case-study by extending the results obtained in [14]. To the best of our knowledge, there is no proposal of an autofocus system for microscopy using multiple images with acceleration on embedded GPUs. In our work the method was implemented using a commercial SoC NVIDIA Tegra that includes a quad-core multiprocessor along with just 256 GPU cores and shared memory. By means of parallelizing acquisition and processing, our implementation guarantee virtually zero delay at maximum camera frame rate.
2. Multifocus fusion method
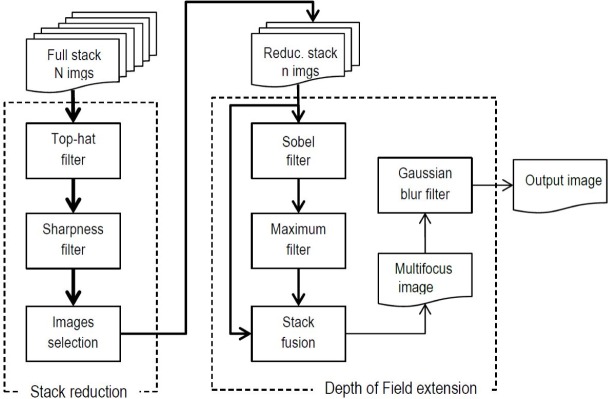
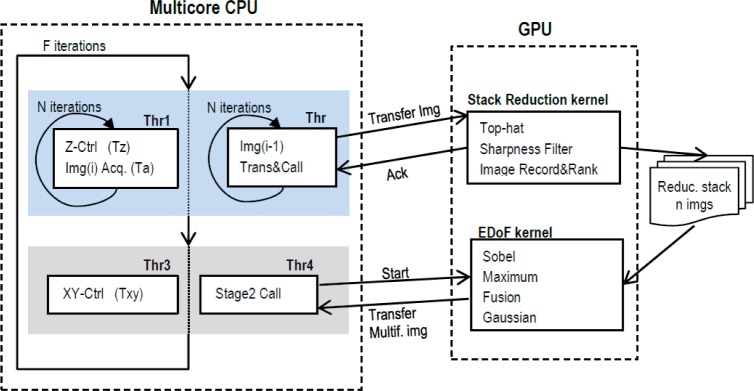
The method presented is composed by two main stages: Stack Reduction, where a subset of the best focused images are selected; and Stack Fusion with Extended Depth of Field, where the best focused regions in the subset of images are merged on a pixel by pixel basis. Individually, each of these stages is subdivided into various phases. The whole procedure is depicted in Fig. 1. As it can be seen, the input is a stack of N high resolution images, where N generally is around 15-30, recorded at different focal distances by moving the sample along the Z axis. The first stage is aimed to get the best focused image among them, and based on it, reduce the number of images for further processing to just n. This number depends on the sample under analysis, size and thickness of the interest objects, and usually goes from 5 to 9 images.
Fig. 1.
Workflow of Multifocus Fusion method.
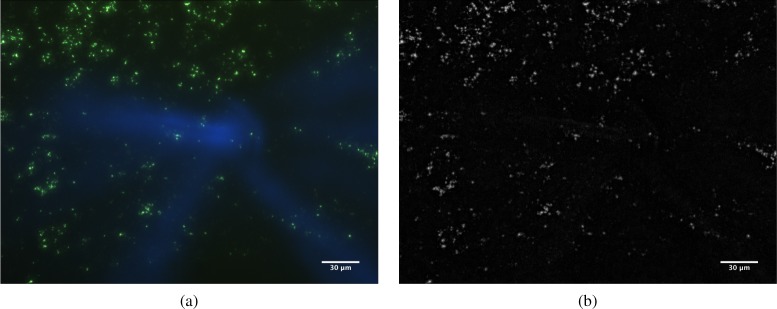
Usually, samples are contaminated with dust and other small particles, which may provoke inaccuracies during the sharpness extraction and selection phases. To alleviate this problem a pre-processing phase, Top-Hat filter (using an square structuring element), is included in the workflow of the system (see Fig. 1). This morphological filter transforms the raw images to enhance the important regions and to reduce possible noise. An example of how it works can be seen in Fig. 2. The image at the left (a) appears affected by a particle of dust. Due its relative size respect to the TB cells, the sharpness measures will be altered producing out of focus images. The image at the right (b) shows the result after the top-hat filter was applied. As can be seen the effect of the strange particle has been fully removed. Once the Top-Hat filter has been applied to each input image, the focusing process begins (Sharpness filter in Fig. 1) based on passive methods. In a previous study [14] a wide number of focus algorithms based on image sharpness were evaluated, and several modifications for improving the overall quality process were proposed. Based on it, in such work the best solutions in terms of error and efficiency (percentage of correctly focused stage) were assessed. Those algorithms are Vollath’s F4 (VOL4), Midfrequency-DCT (MDCT), and Tenengrad (TEN), and in this study has been used for assessing the performance of the multifocus fusion method proposed.
Fig. 2.
(a) Original autofocus image; (b) Example of particle cleaning performed by the top-hat algorithm with a square 9 × 9 mask.
Once the optimal subset of images has been selected, the second stage is aimed to extract all the relevant information from the scene and to combine them in an unique output image. Instead of finding the optimal microscopic field based on the autofocus filter, this robust approach consist on taking regions belonging to different stack images and combine them applying a multifocus fusion technique. The original technique, called Extended Depth of Field was proposed in [15]. In our case, the process involves the following phases: (i) Sobel filter, (ii) Maximum filter, (iii) Stack Fusion, and (iv) Gaussian Blur filter. The Sobel Filter is a well-known edge detection algorithm which creates an image emphasizing edges. In the particular case of this work, it is applied to all the stack for highlighting the areas within each image that has more detail in terms of sharpness. The Maximum operator uses the output generated in the previous step for improving the quality of the information obtain by the Sobel operator. With the values of the sharpness we can estimate the most focused regions (i.e. the sharpest) in each image. The Stack Fusion phase makes use of this information to merge the images pixel by pixel.
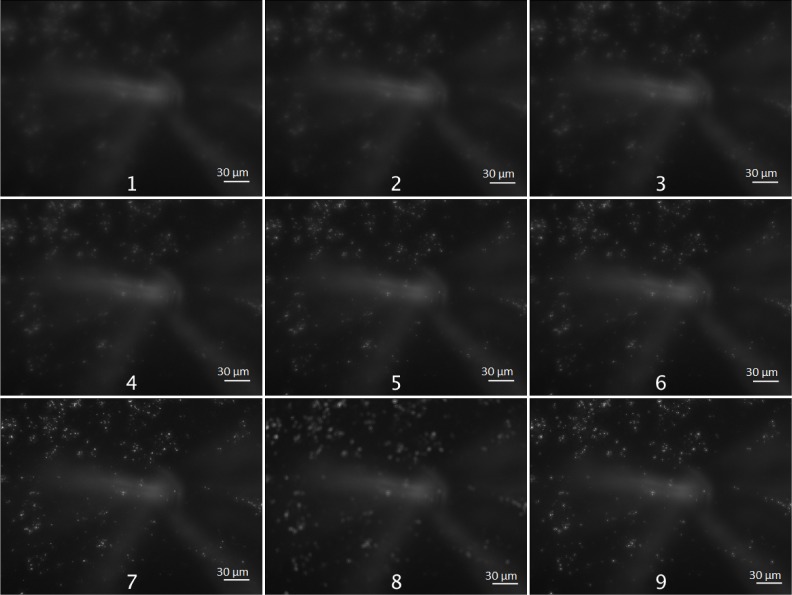
Figure 3 illustrates the result of merging 8 images (from (1) to (8)) into a fused image (9) using this method. One of the advantages of the multifocus technique is that it allows to extend the depth of field through the fusion of images of the same microscope field taken with different focal points into a Z-projected image where each region in the field has maximum contrast and optimal focus, without compromising the resolution after the "cut and paste" fusion process. For such reason, particles that appear fainter if taken from isolated frames will become sharper after the use of such technique.
Fig. 3.
Example of a 8-Stack of images obtained by a microscope (converted to 8-bit grayscale) with a stepsize of 3µm (1-8) and the final result of multifocus (9). Scale bars represent 30µm.
Finally, the process ends by performing a Gaussian Blur to the output in order to smooth it and removing fusion artifacts. When images have different field of view or are multi-exposure images instead of using a crude cutting and pasting procedure, the images representing the blocks need to be smoothly blended together. In this work a monotonically decreasing function (in particular a Gaussian function with σ = 3) has been empirically determined to be effective for eliminating the presence of sharp edges (i.e. artifacts) between blended regions. A characteristic of this method is that it does not impair the resolution of the input images. The detailed procedure was described in [20].
2.1. Experiments and results
The analysis of TB samples was used as case study for assessing the method. Clinical samples proceed from sputum smears stained with the fluorochrome Auramine O. Fluorochromes are fluorescence dyes used in fluorescence microscopy to stain organisms of interest. In this study 30 stacks were randomly selected for evaluation. This selection embodies a wide variety of cases, from images with a high density of particles and debris to images almost empty of objects. Images could suffer other deterioration such as non-homogeneous illumination depending on the region captured, the amount of dye, exposure time, or different combinations thereof. Each stack is comprised of 17 images captured in steps of ΔZ = 3µm, from the nearest blurred image to the optical system to the furthest one and blurred as well. Somewhere in between it should be the image best in focus. The objective used in the present study was a Nikon CFI Plan Fluor 20× with a numerical aperture of 0.50. The size of the images was 1600×1200 pixels and the exposure time was 0.25 s. It is well known that the limit of resolution along the optical (Z-axis) can be estimated according with dR = 2λn/(N A)2 where n represents the index of refraction, NA is the numerical aperture and λ is the wavelength (Rayleigh criterion). For an emission value of λ = 520nm, with n = 1 (air) and N A = 0.50 it gives a dR = 4.16µm. That means that the stepsize chosen in [14] is below the resolution limit and likely the reason why the human observers in such study chose slightly different images around the optimal focus. The image dataset was captured at the Microbiology Department of the Hospital General Universitario Gregorio Marañón (Madrid, Spain), that are available from the public repository at URL: http://biig.uc3m.es/autofocus_stacks.
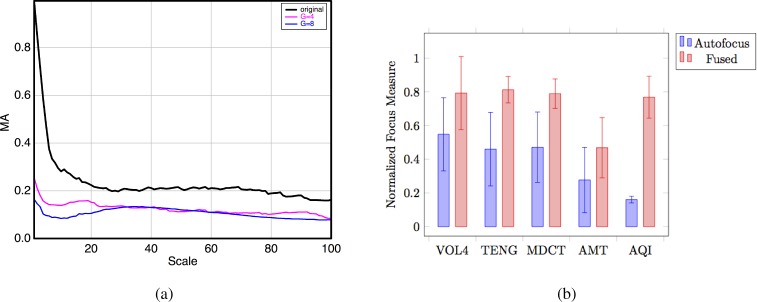
In order to evaluate the performance of the multifocus method five metrics were computed over the 30 above mentioned stacks. The first three are based on image sharpness (VOL4, TEN and MDCT), the fourth criterion provides a measure of the image complexity on all possible scales simultaneously (based on the AMT technique [18]), and the last one is the response of an ideal observer. Figure 4(b) represents the comparison among these metrics between the best focused image (labeled as "Autofocus") provided by the experts in [14] and the multifocus fusion method proposed in this paper (labeled as "Fused"). These metrics present different dynamic ranges and, in consequence, each one has to be normalized by its maximum absolute value.
Fig. 4.
(a) The Angular Measure Spectrum produces a scale-spectrum that reflects the signal complexity on all possible scales simultaneously. The figure represents the AMT spectrum corresponding to a TB autofocus image (labeled ’original’) and defocused images with Gaussian blur (σ = 4; σ = 8); (b) Normalized focus measures of the 30 selected stacks corresponding to the autofocused and multifocus fused images. Bars represent mean values and error bars the standard deviation.
Several test were performed for verifying the usefulness of the AMT technique using increasing Gaussian Blurs (as an approximation to defocus in optics) applied to an original sharp image (See Fig. 4(a)). From such figure it can be observed that blurring produces a significant decrease in the MA response and therefore it can be used as an additional method to quantify the degree of blur. This is a very common technique for reducing image detail. Defocus in optics is an aberration that can be modeled through Zernike parabola-shaped polynomials.
The response of an ideal observer (the last criterion) is based on the variance of the expected directional entropy (anisotropy) called Anisotropic Quality Index (AQI) as it has shown to provide an excellent performance as a no reference quality measure. The AQI measure can be considered as an ideal observer because it has shown to provide a high correlation with the Mean Opinion Scores (MOS) of human observers in the case of Gaussian blur [19].
Attending to the results exposed in Fig. 4(b), it can be concluded that the multifocus fusion approach outperforms the autofocus methods, which is also in agreement with the ideal visual observer provided by the AQI index.
3. Efficient implementation of multifocus fusion method
In this section an efficient implementation using embedded GPUs is described. This means that our system has to meet the time constraints imposed by the camera acquisition time and the slide/lens displacement subsystem. As usual, the limited field of view of microscope objectives is not enough for registering all the sample area. Thus, in order to scan the whole scene, the slide of the microscope has to be mechanically moved along XY axes for recording the different sample subregions. For each subregion, an stack of images is acquired varying the focal distance (Z axis). Once a full stack has been recorded, the processing system has to do its job with the minimum delay. Ideally, it corresponds to the time interval for moving the slide between consecutive subregions, this way no delay will be appreciated. For this study we assume as worst case scenario: minimum area per subregion, XY movement along just X axis and maximum image resolution. These conditions define the maximum time available to do the processing before the next stack acquisition. For autofocus testing we have attached to one of the coaxial fine focus control of a Brunel’s SP30 low cost microscope a bipolar stepper motor Nema14 with 0.9° step angle (400 steps/revolution) (http://bit.ly/23sQJkT). Two additional Nema14 motors attached to mechanical stage allows to automatize the XY displacement. All motors have been controlled using an Arduino Mega board. Measures taken from the prototype gave 527ms for a displacement of 85 microsteps, covering a trip of 152µm. This time span along with different image resolutions were considered in our study. In addition, the performance of our method was analyzed using each of the autofocus filters: VOL4, MDCT and TEN.
Jetson TX1 board was used for prototyping, since it counts with enough peripherals and resources for hosting all the subsystems (camera control and acquisition, motors controller, processing and communications). Jetson TX1 is a NVIDIA’s embedded Linux development platform featuring a Tegra X1 SoC built-in with a multicore CPU and GPU. The CPU consist of a quad-core 1.9GHz ARM Cortex-A57, while the GPU is a 256-core Maxwell [16] graphics processor. Both CPU and GPU share 4GB of LPDDR4 memory with 25.6GB/s of memory bandwidth.
Along with the support for CUDA programming, Jetson platform provides a version of the de-facto standard computer vision library OpenCV. This library has been optimized by NVIDIA for the Tegra SoC CPUs under the name of OpenCV4Tegra [17] allowing a one by one replacement of OpenCV functions in a transparent way. A baseline implementation for running on ARM multicore was developed using OpenCV4Tegra functions when possible, and conventional programming paradigm for the rest of the algorithm (e.g. in the case of Stack Fusion). From it, the different filters and algorithms that compose the proposal were incrementally migrated to the GPU resulting in an accelerated implementation.
For this task, OpenCV also offers an optimized module for GPU that facilitates the migration of some parts of the code. Specifically Sobel, Maximum and Gaussian Blur filters were coded with the corresponding OpenCV GPU versions. In addition, Autofocus algorithms were parallelized combining different library functions. The MDCT implementation uses the well-known OpenCV functions under the names of gpu::filter2D() and gpu::multiply(). In a similar way, VOL4 was coded making use of gpu::warpAffine() and gpu::multiply() functions. Finally, Tenengrad implementation used gpu::transpose(), gpu::filter2D(), and gpu::mul() funtions.
Likewise, Top-Hat filter was initially implemented combining OpenCV morphological filters, but the performance was really poor, even worse than multicore version. Therefore a custom implementation was carried out obtaining significant better results. Additionally, and due to the important computational load of Stack Fusion, this task was implemented for GPU using native CUDA assigning a thread per pixel for getting the maximum value along the reduced stack in a parallel way. A wrapper between OpenCV data structures and CUDA have been implemented by means of the gpu::PtrStepSz OpenCV structure permitting to integrate the OpenCV4Tegra with native CUDA code.
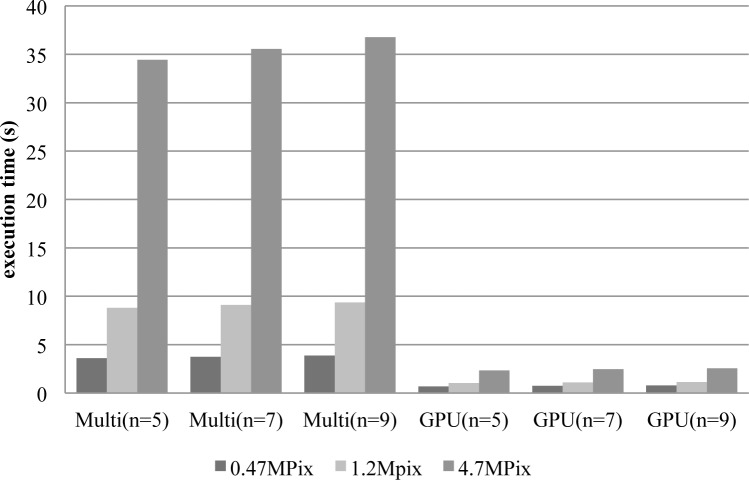
Figure 5 shows the total execution time averaged across the three versions of the method (TEN, VOL4 and MDCT) implemented on Multicore and GPU respectively. In all tests the initial size of stack was 17 images, and different stack reduction sizes were considered in the second stage (n to 5, 7, and 9 images). The image resolutions employed in the study were 800×600 (0.47MPixels), 1280×960 (1.2Mpixels), and 2560×1940 (4.7MPixels). As it can be seen, execution time shows a strong dependency when the image size varies, meanwhile the number of images has a minor effect. Analyzing Multicore results, VOL4 version offers the best execution times followed by MDCT and TEN. Differences between VOL4 and the others are around 20%. In any case, Multicore implementation offers poor results that widely overpass the available time span. The average execution times are above 3 s, 8 s, and 34 s for the resolutions under consideration. On the other hand, GPU implementation obtain better results around 1 s for low and intermediate resolutions. Even at maximum resolution the execution time remains in average below 2.6 s. Similar to Multicore, GPU provides more reduced times for VOL4 version, below 0.8 s, 1 s and 2 s for 0.47 MPixels, 1.2 MPixels, and 4.7 MPixels respectively. Despite these gains in performance, results are not enough for meeting the requirements constraints imposed by our prototype, therefore further optimization is needed.
Fig. 5.
Execution time in seconds on Multicore and GPU baseline implementations. The values represent the average among VOL4, MDCT and TEN algorithms grouped by image size.
A deep analysis of the method reveals that Stack Reduction takes a high percentage of the total execution time. In average 72%, 75% and 83% for VOL4, MDCT and TEN versions respectively. To overcome this bottleneck, an optimized implementation is outlined in Fig. 6, where Multicore CPU and GPU work in parallel. Two threads (1 and 2) form the code for Stack Reduction: the first is in the charge of Z displacement control and image recording, meanwhile the second processes the previous image by means of the GPU kernel. These two parallel threads perform N iterations, one per image of the initial stack, and at the end only n images remain in the GPU memory. Using this approach, the available time interval for processing each of the N images is the combination of the acquisition time of the camera (Ta) and the time for displacement in Z axis (Tz). This first deadline was calculated considering the worst case scenario, i.e. a minimum displacement of just 6 steps (35 ms), summed up to the acquisition time at maximum frame rate. Once the first stage has finished, thread 4 initiates the DoF extension calling the corresponding GPU kernel, and in parallel thread 3 generates the XY displacement. This way, the second deadline defines the maximum time available for EDoF stage as the time for moving the slide to the next subregion of the sample.
Fig. 6.
Optimized Multicore/GPU implementation.
The whole process is repeated for every subregion, producing F multifocus images for the sample. The execution time for obtaining one multifocus image can fluctuate depending on two factors: the number of Z steps needed to get the optimal focal plane (N) and the number of images for being fusioned (n). Anyway, both deadlines must be met to fulfill the real time requirements.
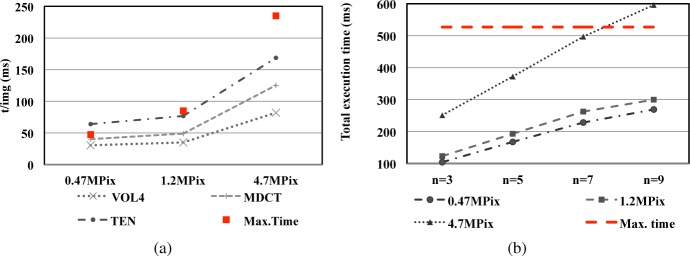
Results are shown in Fig. 7 where the execution time of each stage is compared with the corresponding deadline. In figure (a), the red squares represent the available time span during the Stack Reduction stage. Their values are different because camera frame rate differs with image resolution. The best behavior is obtained using the maximum resolution images. In this case TEN, MDCT and VOL4 versions use just 72%, 53% and 35% of the available time respectively. For 1.2 MPixels resolution, TEN version is close to the maximum (90%) meanwhile MDCT and VOL4 are below 60%. For the lowest resolution, there is only one case (TEN version) that need more time than available (a 35% more, i.e. around 16 ms). This problem can be overcame relaxing the maximum frame rate constraint. In this way, the resulting accumulated delay for a 20 images stack is negligible, around 330 ms. Hence, Stack Reduction stage for all the cases and resolutions can be executed on-the-fly without any delay. In the same way, total execution time of EDoF stage can be seen in figure (b) where the dashed line represents the maximum available time span (i.e., 527 ms for all the cases). Implementation fulfills the requirements except for just one case, fusion of 9 images at maximum resolution, where the delay is under 70 ms. As in TEN version in previous figure, this is an extreme case shown for illustrating the limits of the proposal. Excluding this case, the parallelization of the tasks between Multicore CPU and GPU guarantee virtually zero delay for executing our method at maximum camera frame rate.
Fig. 7.
Execution time for each stage, (a) Stack Reduction stage and (b) Extended Depth of Field stage. In (a) the three methods VOL4, MDCT and TEN are compared for three sizes of image. In (b) the comparison is made for the same three image sizes in (a) and four levels of fusioned images.
4. Conclusions
In biological microscopy it is of great importance to investigate new methods for automating labor intensive tasks that requires a high degree of attention from the specialist. Slide scanning automation procedures, from image acquisition to analysis, will be of benefit to the clinician from different aspects. First, by reducing the contact with the samples and therefore minimizing possible risks. Second, the automation will allow to increase the number of fields of view to be analyzed, that is always a tedious task.
In this paper an improved autofocus method was presented and five metrics were used to assess its performance. The results show that our approach outperforms the three best autofocus methods in the case of TB identification, even considering the ideal observer metric provided by the AQI index. (A MATLAB toolbox for computing AQI for arbitrary grayscale or color images is available from DOI: 10.6084/m9.figshare.4276382.v1).
An efficient implementation, based on embedded GPU, was also proposed for assembling a low-cost automatized microscope. Despite of the limited resources, our implementation is able to generate multifocus fused images fulfilling the real-time constraints of the prototype. This result show the feasibility of using embedded GPU platforms for automating autofocus processes where multicore processors are not enough on their own.
Funding
This work has been partly supported by the Spanish grant CTM2014-51907.
References and links
- 1.Geusebroek J.-M., Cornelissen F., Smeulders A. W., Geerts H., “Robust autofocusing in microscopy,” Cytometry 39, 1–9 (2000). [DOI] [PubMed] [Google Scholar]
- 2.Veropoulos K., Learmonth G., Campbell C., Knight B., Simpson J., “Automated identification of tubercle bacilli in sputum. A preliminary investigation,” Analytical and quantitative cytology and histology / the International Academy of Cytology [and] American Society of Cytology 21, 277–282 (1999). [PubMed] [Google Scholar]
- 3.Subbarao A. N. Murali, Choi T., “Focusing Techniques,” Journal of Optical Engineering
- 4.Chen C.-Y., Hwang R.-C., Chen Y.-J., “A passive auto-focus camera control system,” Applied Soft Computing 10, 296–303 (2010). 10.1016/j.asoc.2009.07.007 [DOI] [Google Scholar]
- 5.Allegro S., Chanel C., Jacot J., “Autofocus for automated microassembly under a microscope,” Proceedings of 3rd IEEE International Conference on Image Processing 1, 677–680 (1996). [Google Scholar]
- 6.Miaofen Z., Wanqiang W., Guojin C., Yongning L., “Image focusing system based on FPGA,” 2010 International Symposium on Computer, Communication, Control and Automation (3CA) 1, 415–418 (2010). [Google Scholar]
- 7.Jin S., Cho J., Kwon K. H., Jeon J. W., “A dedicated hardware architecture for real-time auto-focusing using an FPGA,” Machine Vision and Applications 21, 727–734 (2010). 10.1007/s00138-009-0190-2 [DOI] [Google Scholar]
- 8.Shimobaba T., Sato Y., Miura J., Takenouchi M., Ito T., “Real-time digital holographic microscopy using the graphic processing unit,” Opt. Express 16, 11776–11781 (2008). 10.1364/OE.16.011776 [DOI] [PubMed] [Google Scholar]
- 9.Doğar M., İlhan H. A., Özcan M., “Real-time, auto-focusing digital holographic microscope using graphics processors,” Rev. Sci. Instrum. 84, 083704 (2013). 10.1063/1.4818285 [DOI] [PubMed] [Google Scholar]
- 10.Valdiviezo J., Hernández-Tapia J., Mera-González L., Toxqui-Quitl C., Padilla-Vivanco A., “Autofocusing in microscopy systems using graphics processing units,” Proc. SPIE 8856, 88560 (2013). [Google Scholar]
- 11.Yazdanfar S., Kenny K., Tasimi K., Corwin A., Dixon E., Filkins R., “Simple and robust image-based autofocusing for digital microscopy,” Opt. Express 16, 8670–8677 (2008). 10.1364/OE.16.008670 [DOI] [PubMed] [Google Scholar]
- 12.Guo K., Liao J., Bian Z., Heng X., Zheng G., “InstantScope: a low-cost whole slide imaging system with instant focal plane detection,” Biomed. Opt. Express 6, 3210–3216 (2015). 10.1364/BOE.6.003210 [DOI] [PMC free article] [PubMed] [Google Scholar]
- 13.Kang H., Lee S., Lee E., Kim S., Lee T., “Real-Time GPU-Accelerated Processing and Volumetric Display for Wide-Field Laser-Scanning Optical-Resolution Photoacoustic Microscopy,” Biomed. Opt. Express 6, 4650 (2015). 10.1364/BOE.6.004650 [DOI] [PMC free article] [PubMed] [Google Scholar]
- 14.Mateos-Pérez J. M., Redondo R., Nava R., Valdiviezo J. C., Cristóbal G., Escalante-Ramírez B., Ruiz-Serrano M. J., Pascau J., Desco M., “Comparative evaluation of autofocus algorithms for a real-time system for automatic detection of Mycobacterium tuberculosis,” Cytometry Part A 81A, 213–221 (2012). 10.1002/cyto.a.22020 [DOI] [PubMed] [Google Scholar]
- 15.Wheeler R., “Extended Depth of Field,” ImageJ plugin, http://www.richardwheeler.net. Last access Nov. (2016).
- 16.NVIDIA Maxwell, “https://developer.nvidia.com/maxwell-compute-architecture. Last access Nov. 2016.”.
- 17.OpenCV4Tegra, “http://elinux.org/Jetson/Computer_Vision_Performance. Last access Nov. 2016.”.
- 18.Esbesen K.H, Hjelmen K.H., Kvaal K., “The AMT approach in chemometrics-first forays,” J. Chemometrics 10, 569–590 (1996). [DOI] [Google Scholar]
- 19.Gabarda S., Cristobal G., “Blind image quality assessment through anisotropy,” J. Opt. Soc. Am. A 24, B42–B51 (2007). 10.1364/JOSAA.24.000B42 [DOI] [PubMed] [Google Scholar]
- 20.Goshtasby A., “Fusion of multi-exposure images,” Image and Vision Computing 23, 611–618 (2005). 10.1016/j.imavis.2005.02.004 [DOI] [Google Scholar]


