Abstract
A three-dimensional optical coherence tomography imaging method based on Lissajous scanning is presented. This method was designed to correct eye motion in OCT images. A Lissajous scanning pattern, which has a trajectory that frequently overlaps with itself, is adopted as the OCT scanning protocol to obtain measurement data. Eye motion artifacts are then corrected automatically by software. By comparing the images without and with motion correction, we show the effectiveness of our method. We performed an experiment and compared the results obtained by our method with the ground truths to verify its validity. The experimental results showed that our method effectively corrects eye motion artifacts. Furthermore, the sufficient repeatability of our method was confirmed.
OCIS codes: (170.3880) Medical and biological imaging, (170.4500) Optical coherence tomography, (100.6890) Three-dimensional image processing, (170.4470) Ophthalmology
1. Introduction
Optical coherence tomography (OCT) [1, 2] is a popular three-dimensional (3D) imaging tool in ophthalmology [3–13]. However, OCT images are prone to artifacts induced by eye motion because of its limited scan speed. These artifacts cause two problems. First, the artifacts may create missing areas in the OCT images that could contain important structures and features. Second, both lateral and axial motion artifacts, especially those that occur along the slow-scanning direction, distort gross morphological structural information of the retina. These two problems distort the en face retinal image and re-sliced cross-sectional images. Thus, they can adversely affect the interpretation by clinicians.
One solution for correcting these artifacts is to introduce additional hardware that can monitor and compensate for eye motion [14–17]. Although additional hardware can effectively deal with eye motion, this increases the expense and complexity of the system. Another solution is to use post-processing algorithms to calculate and compensate for eye motion combined with modified scanning protocols [18–21]. Its mainstream approach is to use a set of orthogonal scans [18–20], which scans the same area of the eye at least twice by using two orthogonal fast raster scan axes. This kind of method requires multiple volumetric scans.
In this study, we present another combination of scanning pattern and motion correction algorithm. The Lissajous pattern is adopted as the scanning protocol. The Lissajous scanning trajectories of each scan cycle are frequently overlapped and contain no abrupt scanning velocity changes. A corresponding motion correction algorithm is then applied to the measurement data obtained by Lissajous scan. To verify the effectiveness, we make a comparison between images without and with motion correction. To test the validity of the our method, we compared the motion corrected results with scanning laser ophthalmoscopy (SLO) and cross-sectional OCT along fast scan direction as reference standards. Two motion-corrected volumes, which were measured in the same location using the same subject but at different times, were compared to validate the repeatability of our method. In addition, to present an overview of the 3D volume, two sets of 3D motion corrected data obtained by our method are shown as movies of cross-sectional images and 3D volume rendering.
2. Method
2.1. Scanning pattern
Lissajous scan is obtained by operating along the horizontal and vertical axes using sinusoidal waveforms of different frequencies as follows
| (1) |
| (2) |
where x and y are the horizontal and vertical coordinates of a scan spot, respectively, and Ax and Ay denote the scanning ranges of the x - and y- directions, respectively. t is time and fx and fy are the scanning frequencies of the x - and y- directions, respectively.
To make our Lissajous scanning pattern form a closed-loop scan, the two frequencies should be determined as follows [22]
| (3) |
| (4) |
with
| (5) |
where f is the fundamental frequency given by the full single Lissajous scanning time T. In addition, N is the number of horizontal cycles used to fill the scan area. Because our Lissajous scan fills the scan area repetitively twice, a full single closed-loop Lissajous scan has 2N horizontal cycles. In our OCT sampling, the relationship between f and N is as follows:
| (6) |
where fA is the A-line rate of the system, and n is the number of A-lines per single horizontal cycle. To make the scan area square, the scan ranges in the x - and y- directions should be same, and we define scan range A as
| (7) |
To make the distance between adjacent A-lines and the distance between adjacent cycles similar at the center of the scanning area, we set
| (8) |
Using the above protocol, the final scan waveform is finally controlled by three independent parameters; fA, n and A. The final scanning pattern can be described as the following discrete time functions
| (9) |
| (10) |
where ti is the acquisition time point of the i-th A-line. Total number of A-lines in a full single closed-loop Lissajous scan becomes n2/2. The acquisition is uniformly distributed in time as ti = i/fA, i = 1, 2, …, n2/2.
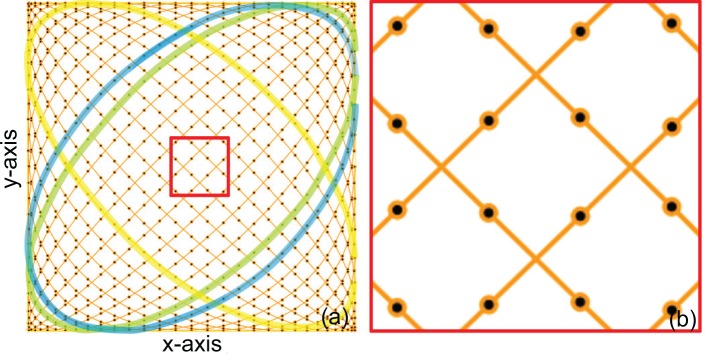
Figure 1(a) shows an example of the Lissajous scanning pattern, which consists of 64 A-lines per single horizontal (n = 64). As shown on the left side of the figure, all of the single round-trip scanning trajectories laterally intersect each other. Hence, each subset of the Lissajous scan always overlaps with another subset at four locations. It makes the Lissajous scan suitable for motion correction. Figure 1(b) shows a magnified figure of the center region (red square) of Fig. 1(a). It is clear that the distance between adjacent A-lines and the distance between adjacent cycles are similar, as it has been intended by Eq. (8).
Fig. 1.
Example of a Lissajous scanning pattern containing 64 A-lines per single horizontal cycle (n = 64) (a) and its magnified image in the center region (b). The black dots on the scanning trajectory represent A-line sampling points. The yellow, green and blue curves are examples of a single horizontal cycle. The green and blue curves are adjacent horizontal cycles.
2.2. Motion correction algorithm
After scanning the target area, the acquired measurement data I(ti, zj) consists of n2/2 A-lines. Here, I is a depth-resolved OCT intensity taken over time sequence ti with i = 1, 2, 3; ⋯, n2/2. Further, zj is the depth position of the j-th depth position and Np is defined as the number of pixels per A-line. Based on this measurement data and the property of Lissajous scan, we developed simple motion correction algorithm.
The core idea of this algorithm is to correct motion artifacts by maximizing the similarity of overlapping areas between multiple scans. The resulting OCT volume suffers from two-dimensional lateral shifts, one-dimensional axial shifts, two-dimensional tilt, and one-dimensional rotation of the eye. Our algorithm corrects the lateral and axial shifts and assumes the other motions are negligible. In order to decrease the computational cost, we divided the correction process into two sequential steps; lateral motion correction and subsequent axial motion correction. For both the lateral and axial motion corrections, the algorithm first corrects the large motion artifacts and then corrects small ones. Each step of the algorithm is detailed in the following sections.
2.2.1. Dividing the volume into roughly rigid sub-volumes
The first step of our motion correction is to divide the OCT measurement data into smaller sub-volumes that do not include large motions and then correct the large motions among these sub-volumes. Thus, the volume division should meet the following two requirements. First, the volume should be divided when rapid lateral eye motion begins. Second, the sub-volume should be small enough that slow drift is negligible at least as a first approximation.
At the beginning of the eye motion detection process, the OCT intensity of each horizontal cycle is averaged along the depth as IE(ti) ≡ ∑j I(ti, zj)/Np, where IE (ti) is the depth averaged intensity of the i-th A-scan. The Pearson correlation coefficient between adjacent horizontal cycles is then computed as
| (11) |
where l is the index of the horizontal cycle (l = 1, 2, 3, ⋯, n/2 − 1), k is the A-line index within the cycle (k = 1, 2, 3, ⋯, n), and R(l) is the Pearson correlation coefficient between the l-th and (l + 1)-th horizontal cycles. Moreover, is the average of IE in the l-th horizontal cycle .
Rapid eye motion artifacts are considered to be present when the first-order differentiation of the correlation coefficient (ΔR(l) = R(l + 1) − R (l)) is less than a certain threshold (σ) which is determined as the negative of the standard deviation of the first-order differentiations of the correlation coefficients as
| (12) |
where is the average value of ΔR(l). The rationality of this threshold is discussed later in Section 4.3. If ΔR(l) < σ, the adjacent cycles are assigned to different sub-volumes. If the acquisition time of the sub-volume exceeds 0.2 s, the sub-volumes are further split at every 0.2-s point, even if no large motion is detected.
2.2.2. Lateral motion correction
For motion correction, the en face projection of each sub-volume is first remapped into a Cartesian grid. Our Lissajous pattern uses n2/4 A-lines to fill the scanning area once, while the whole area is filled twice in a complete set of Lissajous pattern. To balance with this number of A-lines, we set total grid points as n/2 × n/2. Thus, the grid size is 2A/n. To accelerate the computational speed, we developed a quick image remapping method (see Section 4.4). Here, we refer to the remapped projections as strips. The lateral motion correction is then performed by two steps; rough lateral motion correction and subsequent fine lateral motion correction. For the rough lateral motion correction, we register each strip to a reference strip, where the largest strip is used as the first reference strip. The amount of mutual shift between the registering and the reference strip is estimated by finding the maximum of the cross-correlation function. The correlation is computed using logarithmically scaled projection images. Because the strips have arbitrary and different shapes, the correlation function cannot be computed using standard rapid algorithms. Hence, we used a custom-designed fast correlation method for arbitrary shaped images that is detailed in Appendix A. Once the registering strip is registered to the reference strip, the two strips are merged to provide a larger reference strip. The strips are merged by averaging their overlapping area.
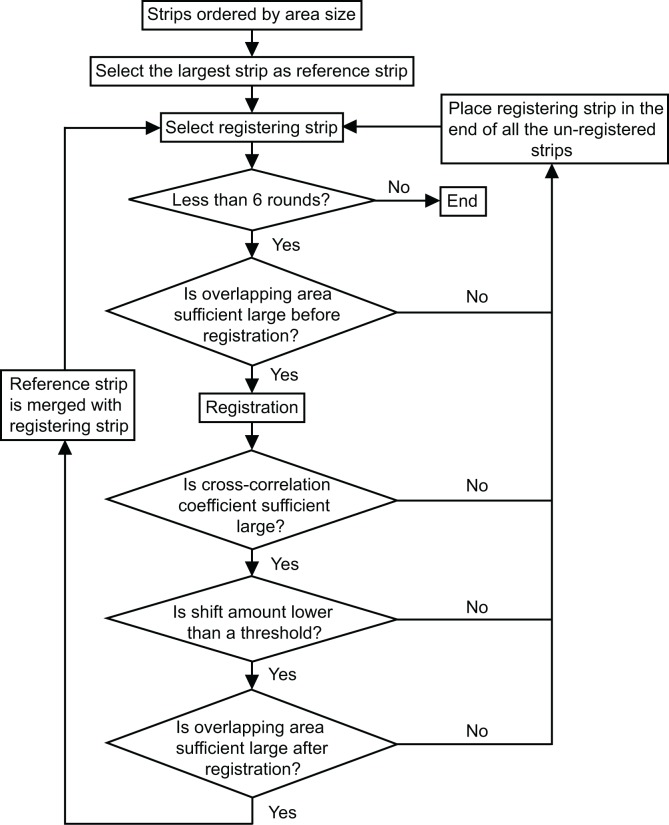
Owing to the property of the Lissajous scanning pattern, each sub-volume overlaps with any other sub-volume. Thus, we have substantial freedom to choose the registration order of the strips. To achieve good lateral motion correction performance, we register the strips with larger area size first and discard strips that are too small in size. The reference strip, which is initially the largest stripe, is gradually enlarged during the registration process by merging with the registered strips. To improve the accuracy of registration, if the registering strip suffer from one of the following three problems, we change its registration order to the last. Firstly, the correlation coefficient after registration is lower than a threshold, which is empirically set to 0.4. Secondly, the amount of the estimated shift is larger than a threshold, which is set to 10 grid points length initially and then is set to 20 grid points length after 4 rounds of registration. Here, one round represents a set of registrations in which all the strips are tried to be registered once. Thirdly, the size of the overlapping area between the registering strip and the reference strip is not large enough. After 6 rounds of registration for all the strips, the unregistered strips are discarded due to the assumption that they include large distortion motion artifacts. The flowchart of rough lateral motion correction is shown in the Fig. 2.
Fig. 2.
Flowchart of rough lateral motion correction.
It should be noted that, despite the overlaps of sub-volumes, the exact A-lines in the overlapped region are not necessarily and exactly collocated to each other. However, we remapped the A-lines to grid coordinates before image registration, and this remapping is performed with data-point interpolation. This remapping with interpolation provides sufficient accuracy of registration as it is shown in Section 3, even the original A-lines are not exactly collocated.
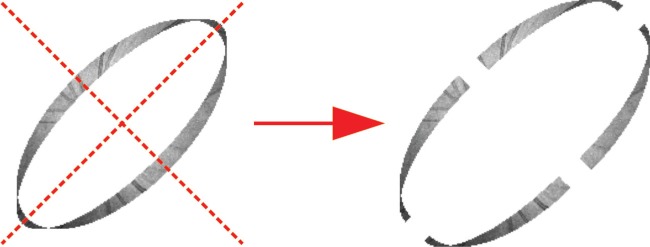
In the rough lateral motion correction, the strips are treated as rigid. However, the slow drift and tremor of the eye lead to small lateral distortions, and hence the strips are not rigid. To overcome this problem, each strip is divided into four sub-strips for fine lateral motion correction. In detail, the registering strip is divided into four quadrants by two diagonal lines, as shown in Fig. 3. A reference image is generated by averaging all the rough-lateral-motion-corrected strips except the registering strip. Each quadrant is then registered to the reference image by the same algorithm with rough lateral motion correction. After registering the each sub-strip, the four sub-strips were merged to each other. Here, if there are overlapping regions among the four sub-strips, the sub-strips are averaged in those regions. For registering the next strip, a new reference image is generated by using this corrected sub-strip and other strips but without the next registering strip. To achieve a good performance, fine lateral motion correction is iterated for three times.
Fig. 3.
Division each strip into four sub-strips.
All A-lines of all sub-volumes are then remapped according to the lateral motion amounts obtained by the above-mentioned motion correction process. These steps ultimately provide a set of lateral motion corrected sub-volumes.
2.2.3. Axial motion correction
To correct large axial motion artifacts, we first perform a rough axial motion correction. Similar to the rough lateral motion correction, the largest sub-volume is initially chosen as a reference sub-volume that is gradually enlarged during the registration process by merging with the registered volume. If the size of the overlapping area between the registering sub-volume and the reference sub-volume is not larger than a threshold, which is set to 5 × n empirically, we tentatively abandon registering the sub-volume and put it back into the end of the queue of unregistered sub-volumes. During the rough axial motion correction, we correct the mutual axial shifts among sub-volumes. In more detail, the one-dimensional cross-correlation is calculated in the overlapping area between the reference and registering A-lines, and the axial shifts of the registering A-lines are determined by the maximum peak positions of the cross-correlation function. We take the median of these axial shifts over the registering sub-volume as the estimated axial shift. After 4 rounds of registration of all the sub-volumes, the remaining unregistered sub-volumes are discarded.
To improve axial motion correction performance, the fine axial motion correction is then applied. For this correction, a single horizontal cycle is regarded as motion-free, and the mutual axial motion among the horizontal cycles are corrected by the same algorithm used for rough axial motion correction. In more detail, we select the registering sub-volume in order of area size, create the reference sub-volume by averaging all the sub-volumes except the registering sub-volume, and update sub-volume by correcting the axial motion of each horizontal cycle. After each sub-volume is corrected, we average all sub-volumes at each grid point to generate the motion corrected volume, which is the output of our method.
3. Results
We used a 1-µm Jones-matrix polarization-sensitive swept-source OCT (JM-OCT) with an A-line rate of 100 kHz and a probing power of 1.4 mW [23] to demonstrate the Lissajous-based motion-free imaging of the posterior eyes. A transverse area of 6 mm × 6 mm was scanned by the closed-loop Lissajous scan with n = 1024. Thus, the average and maximum separations between adjacent A-lines along the trajectory are 17.6 µm and 26.0 µm, respectively. The maximum separation is obtained at the center of the scan field. The distance between nearest A-lines at the center of the field is smaller than the maximum separation along the trajectory and it is 18.4 µm. It is smaller than the lateral optical resolution, 21 µm. A single volume acquisition took 5.2 s. The details of the system are described in [23]. We used only the scattering signal of the JM-OCT, and hence, our method is fully compatible with standard (non-polarization-sensitive) OCT. The scattering signal was obtained by coherent composition (Section 3.6 of [23]).
The typical processing time is 715 s for lateral motion correction and 3,490 s for axial motion correction. The processing time was examined with Inter Core i7-4712HQ CPU operating at 2.30 GHz and 16.0 RAM, and the processing program was written in Python 2.7.11 (64-bit).
3.1. Effectiveness of motion correction
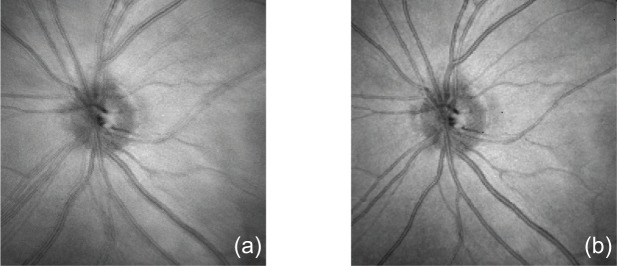
To show the effectiveness of lateral motion correction, we compared en face projection images without and with lateral motion correction as shown in Fig. 4. The en face projection image without lateral motion correction [Fig. 4(a)] is generated by projecting the whole volume to en face plane and remapping it to the Cartesian coordinates. Since our Lissajous scanning pattern scans the same position multiple times, the image is appeared with significant blurring, and ghost vessels. After lateral motion correction, such blurring and the ghost vessels artifact disappeared as shown in Fig. 4(b). These results illustrate the effectiveness of our lateral motion correction method.
Fig. 4.
Comparison of the en face projection images without (a) and with (b) lateral motion correction demonstrates the effectiveness of the lateral motion correction.
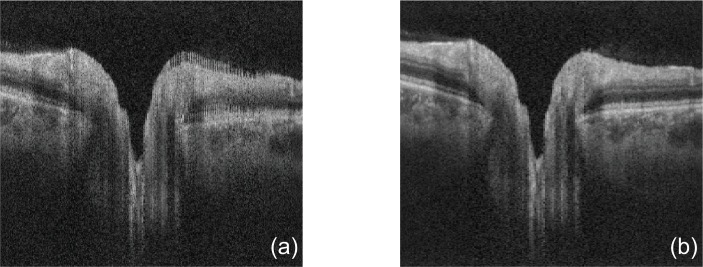
To show the effectiveness of axial motion correction, we compared cross-sectional images without and with axial motion correction as shown in Fig. 5. The cross-sectional image without axial motion correction [Fig. 5(a)] was taken from a non-axial-motion corrected but lateral-motion-corrected volume. Due to the trajectory of Lissajous scan, the adjacent depth-lines in this cross-sectional image may be not acquired sequentially but with non-negligible time separation. Thus, we can see comb-like appearance in the cross-sectional images without axial motion correction. By using our axial motion correction, these comb-like appearance was significantly reduced as shown in Fig. 5(b). This comparison indicates our method can correct axial motion artifacts effectively.
Fig. 5.
A comparison of the cross-sectional images without (a) and with (b) axial motion correction demonstrates the effectiveness of the axial motion correction.
3.2. Validation of motion correction
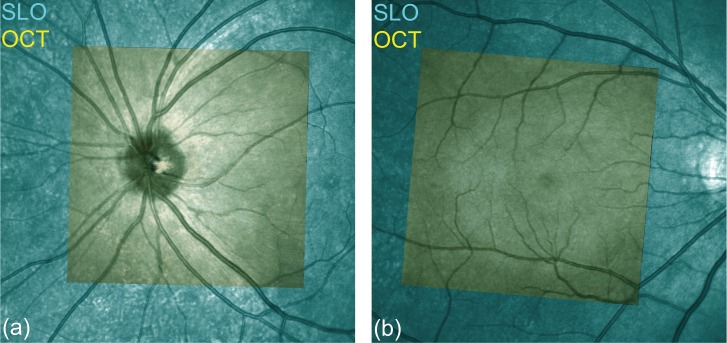
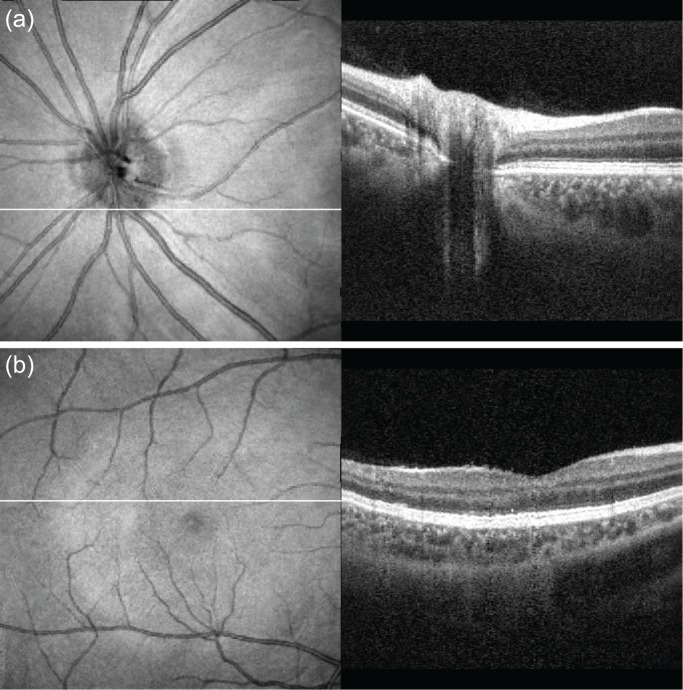
To verify the lateral motion correction method, we compared the motion-corrected en face projection images with SLO images. Because the measurement time of SLO is short, we regard the SLO images as a motion free ground truth. Figure 6 shows the co-registered composite images of SLO (SPECTRALIS HRA+Blue Peak, Heidelberg Engineering Inc.) and OCT. The SLO images (cyan) and motion-corrected en face projection OCT images (yellow) are well co-registered for both the optic nerve head (ONH, Fig. 6(a)) and macula (Fig. 6(b)). As we can see, the blood vessels are very well matched, which indicates the successful performance of our lateral motion correction.
Fig. 6.
Validation of the lateral motion correction: comparison of the motion-corrected en face projection images with the SLO ground truth. (a) ONH, (b) macula. The cyan images are obtained by SLO and the motion corrected OCT images (yellow) are overlaid on the SLO images.
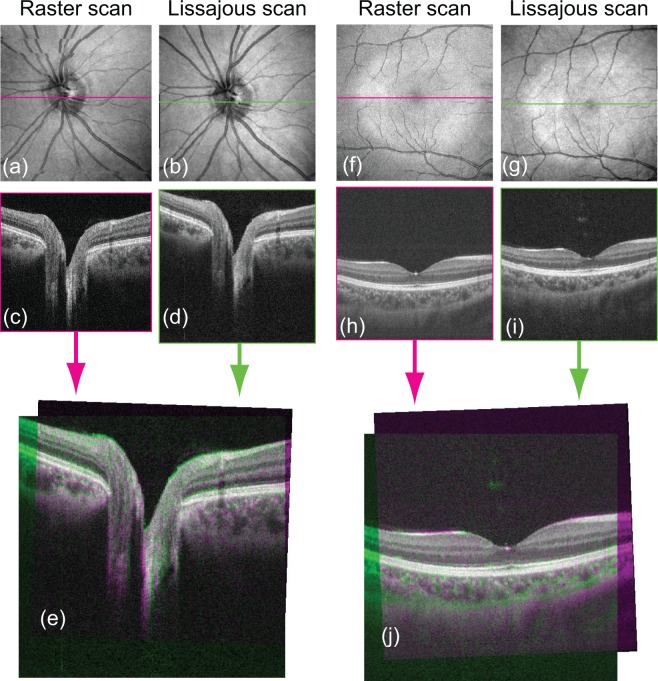
To verify the axial motion correction, we compared the motion-corrected cross-sectional image with the ground truth. In this case, the ground truth is a horizontal B-scan that contains 500 A-lines, taken with a horizontal fast raster scan protocol. Because one horizontal B-scan is measured in 25.6 ms, we can treat it as motion-free. Figure 7 shows magenta-green composite images in which a motion-corrected cross-sectional image and a fast B-scan ground truth image are shown in green and magenta, respectively. Figure 7(a)–(e) shows the ONH and Fig. 7(f)–(j) shows the macula. In Figs. 7(e) and 7(j), the raster cross-section was overlapped with the Lissajous cross-section by manual registration. The registration was rigid as it uses only lateral- and depth-translations, and rotation. We see nearly monochromatic (gray) appearance in the overlapping region. As green and magenta are complementary to each other, this appearance indicates nearly perfect registration between our method and the ground truth.
Fig. 7.
Validity of the axial motion correction: comparison of the motion-corrected cross-sectional image with the fast B-scan ground truth. (a)–(e) ONH and (f)–(j) macula. Two volumes for each ONH and macula are from the same eye but from different measurements. First row: motion corrected en face projections. Second row: horizontal cross-sections taken from the motion corrected volumes. Third row: Green-magenta compositions of cross-sections. (e) is made from (c) and (d), while (j) is made from (h) and (j). Since green and magenta are complementary to each other, the nearly monochromatic (gray) appearance in (e) and (j) validates good performance of motion correction.
3.3. Repeatability
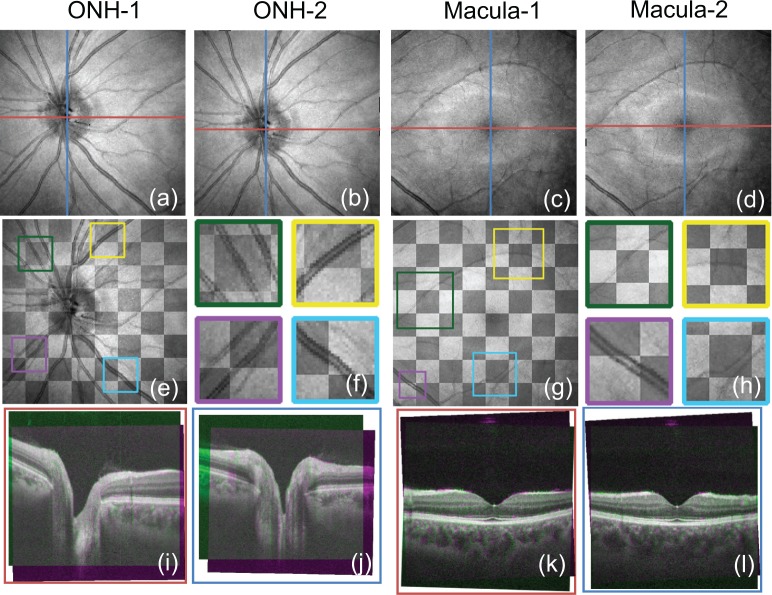
If the motion-corrected volume data are well registered with the ground truth, the repeatability of the lateral motion correction should be also high. To check the repeatability of our method, we measured both the ONH and macula twice and compared the motion-corrected results. The motion corrected en face images are shown in Figs. 8(a)–(d) (the first row of Fig. 8). We manually co-registered the en face projection images of two motion-corrected volumes with a lateral rigid registration and constructed checkerboard images for the ONH and macula by combining their overlapping areas as shown in Figs. 8(e)–(h), where Figs. 8(f) and Figs. 8(h) are magnified images of the regions indicated in the color boxes in Figs. 8(e) and 8(g). In the checkerboard images, the brighter squares are from Fig. 8(a) (ONH) or Fig. 8(c) (macula). Similarly, the darker squares are from Fig. 8(b) (ONH) or Fig. 8(d) (macula). To validate the repeatability of axial motion correction, the cross-sectional images were registered manually, and the magenta-green composite images were created, as shown in Figs. 8(i)–(l), where the magenta images are from Figs. 8(a) or 8(c) and green images are from Figs. 8(b) or 8(d). Figs. 8(i) and 8(k) are the horizontal cross-sections of the red line in the en face images, while 8(j) and 8(l) are the vertical cross-sections of the blue lines.
Fig. 8.
Repeatability evaluation. Top row: En face projection images of two motion corrected volumes (a)–(d). Middle row: checkerboard images of en face projection images (e) and (g). (e) is from (a) and (b), and (g) is from (c) and (d). (f) and (h) are magnified images of (e) and (g), respectively. Bottom row: magenta-green composite cross-sectional images in the corresponding positions for two motion-corrected volumes (the colors of the bounding boxes correspond to the lines of the same colors in the top row). (i) and (j) are compositions of cross-sections taken from (a) and (b), and (k) and (l) are compositions of (c) and (d).
The checkerboard images [Figs. 8(e) and 8(g)] and their corresponding magnified images [Figs. 8(f) and 8(h)] do not show any discontinuities at the seam lines between the two en face projection images. The cross-sectional composite images [Figs. 8(i)–(l)] shows nearly no color (gray) appearance. As the green and magenta are complementary colors, this gray appearance proves good repeatability of motion correction.
3.4. Motion correction for blinking case
To show the performance of our method in dealing with an eye blink occurrence, a 3D OCT volume with a blink was processed by our method and the processed results are presented.
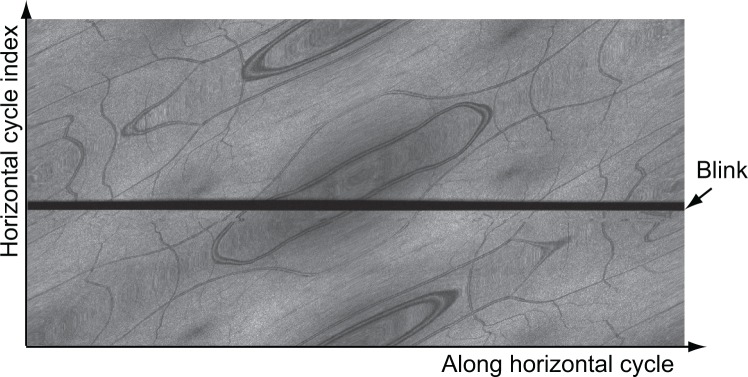
Figure 9 shows the en face projection image with the blink before Cartesian remapping. In this figure, each row of the image represents one horizontal cycle of Lissajous scan, and all the horizontal cycles are placed according to time sequence (left to right). As we can see, there is an evident horizontal black area (indicated by an arrow) caused by the blink in the figure. As the strips with the blink have a low cross-correlation coefficient with the reference strip, they will be discarded in the process of rough lateral motion correction. Because of the multiple overlapping property of the Lissajous scanning pattern, we can discard the blink without creating a missing area in the motion-corrected images.
Fig. 9.
The en face projection image with blinking before Cartesian remapping. The acquisition starts from the bottom left to the right, bottom to top, and ends at the top right. The horizontal black region (arrow) is caused by eye blink.
The motion corrected en face projection image [Fig. 10(a)], horizontal and vertical cross-sectional images including the foveal pit [Fig. 10(b) and Fig. 10(c), respectively] are shown in Fig. 10. As we can see, the en face projection images show continuous vessels, and the blink area does not appear. The cross-sectional images also show no negative effect of the blink. Hence, we conclude that the Lissajous scan provides a sufficient image, even when a blink occurs.
Fig. 10.
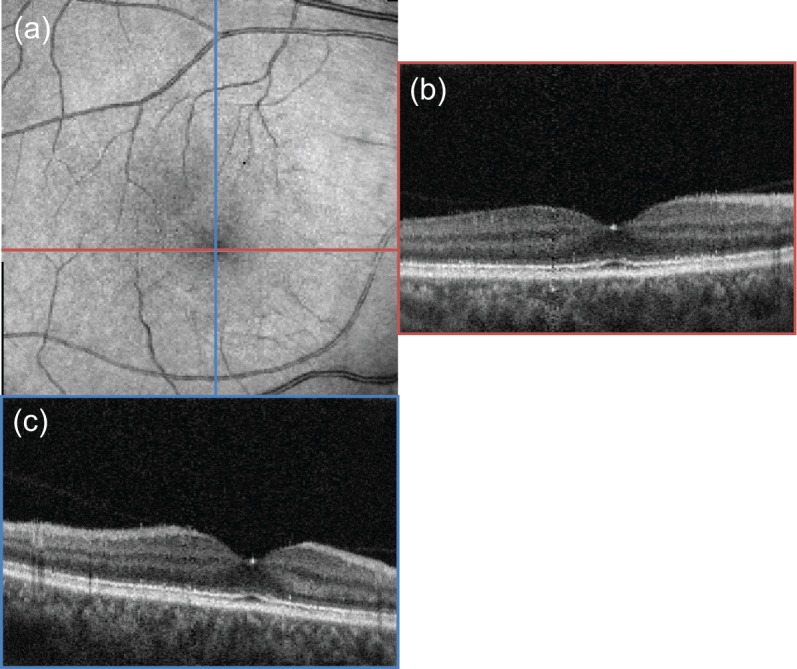
Motion-corrected en face projection image (a) and two cross-sectional images (b) and (c) crossing the center of macula. The colors of the bounding boxes of (b) and (c) correspond to the lines of the same colors in (a).
3.5. Volumetric observation of motion corrected images
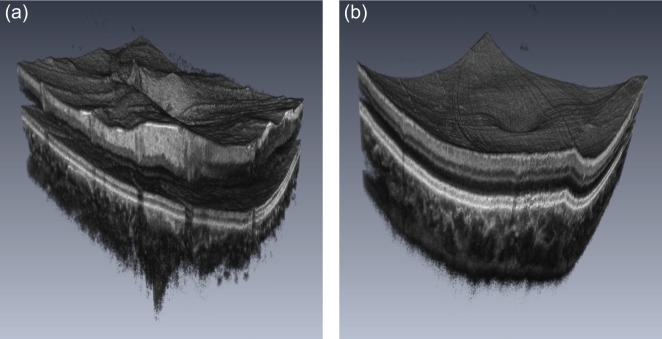
To show the performance of our method, we present two representative motion corrected volumes (ONH and macula) by fly-through cross-sectional movies ( Visualization 1 (6.6MB, MP4) and Visualization 2 (6.5MB, MP4) , Fig. 11) and 3D volume rendering movies ( Visualization 3 (870.8KB, MP4) and Visualization 4 (579.8KB, MP4) , Fig. 12). As we can see in the fly-through cross-sectional movies (Fig. 11), smooth fine structures can be very well observed throughout the entire volumes of the ONH and macula. In Fig. 12(a), we can clearly see that the structure is smoothly connected, the curvature of RPE is well preserved, and the surface structure raised due to retinal vessels. In Fig. 12(b), Lissajous pattern artifacts appear on the surface of macula because small magnitudes of residual axial motion are amplified by the 3D rendering. However, we also can state that the residual axial motion is not significant by observing the fly through cross-sectional movies. Thus, it is shown that our method can provide motion corrected 3D structure of the human retina.
Fig. 11.
Fly-through cross-sectional movies. (a) ONH and (b) macula.
Fig. 12.
Three-dimensional volume rendering movies. (a) ONH and (b) macula.
4. Discussion
4.1. Limitations of the current method
A method that is designed to automatically correct eye motion artifacts is described in this study, and the results show that it can provide motion-corrected 3D OCT images. However, our method has some limitations currently.
The first limitation is that the measurement data with severe vignetting, tilt and/or rotation cannot be registered. For severe vignetting, the solution may be to correct illumination for each A-lines data. For solving tilt and rotation cases, a registration algorithm with more degrees of freedom may be required.
The second limitation is associated with the fact that the current fine lateral motion correction method splits each strip into four quadrant sub-strips. This splitting is rational only if the lateral eye motion is periodic with the Lissajous cycle. Certainly, this periodic eye motion assumption is not true. Despite this imperfectness, our method has provided sufficient motion correction performance. It is mainly because the mutual shifts between quadrants were small, typically less than four grid points. However, we need to note that this method is still not perfect. It would be the future development issue to improve the final image quality by using non-rigid transformation of the strip.
The third issue is about inhomogeneity of lateral density of A-lines, and its effect to motion correction. The A-line density is low at the center of the scan field, while it is high at the periphery. So, the accuracy of Cartesian-remapped data is lower at the low A-line density region than high density region. In despite of this inhomogeneity, the registration algorithm for the motion correction uses the data at the low and high density regions with equal importance (weight). Although the current registration algorithm works well as shown in Section 3, future improvement is expected by adaptive weighting based on the A-line density.
4.2. Comparison of raster scan and Lissajous scan
Table 1 summarizes the comparison of a typical raster scan and Lissajous scans. Here both of the scan patterns are assumed to have the number of lateral points of 512×512. It is the number of A-lines for raster scan and the number of Cartesian grid points of Lissajous scan. Since the Lissajous is a continuous scanning pattern, its duty cycle is 100%, which is higher than that of the raster scan (80%). However, since Lissajous scans the same location multiple times, it takes more time than the raster scan. The longer measurement time results in more motion in Lissajous acquisition, but it is corrected by the motion correction process. In addition, Lissajous scan also can correct eye blinking. If the eye motion and blinking are allowed, the longer measurement time of Lissajous would not be problematic.
Table 1.
Comparison of raster and Lissajous scans.
| Raster scan | Lissajous scan | |
|---|---|---|
| Typical number of A-lines | 512×512 | 1024 A-lines × 512 cycles |
| Scan time | 3.3 s | 5.2 s |
| Duty cycle | 80% | 100% |
| Artifacts before motion correction | Image gaps, distortion discontinuity by abrupt motion | Image blurring, and ghost image, by abrupt motion |
| Eye blink | Not robust | Robust |
| Residual artifacts after correction | NA | Small comb-like artifacts |
| Computational time | Fast | Around 70 m/volume |
4.3. Rationality of the rapid motion detection method
In Section 2.2.1, we detected rapid eye motion artifacts by using the standard deviation of the first-order differentiations of the inter-cycle correlation coefficients. The rationality of the usage of this quantity to detect the quick motion is as follows. The Pearson correlation coefficient of adjacent horizontal cycles [R(l)] can be broken into correlation coefficients resulted from structural similarity (or dissimilarity) [S(l)] and that resulted from motion [M(l)] as
| (13) |
where both S(l) and M(l) range from 0 to 1. The R(l) can be low not only when M(l) becomes low by motion, but also when S(l) is low because of structural decorrelation. So R(l) is equally sensitive to motion and structure and it is not a good metric to detect quick motion.
To solve this problem, we use the first order derivative of R(l) along the cycles;
| (14) |
As the degree of structural decorrelation can be regarded as constant over horizontal cycles, the derivative of the correlation can be tiny as
| (15) |
By substituting this condition, Eq. (14) is simplified as
| (16) |
We can then consider three cases including no eye motion, with slow eye motion (drift or tremor), and quick eye motion. If there is no eye motion, M(l) is tiny and constant. As a result, dM(l)/dl is also tiny and hence dR(l)/dl is tiny. If there is only slow eye motion, M(l) is not tiny but it is nearly constant. As a result, again dM(l)/dl is tiny and hence dR(l)/dl is also tiny. If there is a quick motion, M(l) highly varies along the horizontal cycle. As a result, |dM(l)/dl| becomes large and hence |dR(l)/dl| cannot be tiny. These cases can be summarized as
| (17) |
Since dR(l)/dl becomes large only if quick motion exits, it is a good metric to detect quick eye motion.
In the implementation in Section 2.2.1, we used discrete differentiation along horizontal cycle ΔR(l) as an alternative to the derivative dR(l)/dl.
4.4. Quick image remapping to Cartesian grids
To accelerate the computation speed, we developed the following quick image remapping algorithm. As the first step of this algorithm, each en face projection value (corresponding to each A-line) is assigned to the nearest Cartesian grid. If multiple values area assigned to a single grid point, the average of the values are set to the grid point. This image is denoted as a high resolution grid image. It should be noted that the high resolution grid image contains many invalid grid points to which no value has been assigned.
The second step is the creation of a low resolution grid image. We divide the high resolution grid image into patches with 3×3 grid points. The low resolution grid image is then formed to have the 9 grid points in a patch possess a same value that is the mean value within the patch. Hence, the low resolution grid image has the same number of grid points with the high resolution grid image, but it has lower resolution. In addition, although its resolution is low, there is nearly no invalid grid points in this image.
The final image is created by filling the invalid grids points in the high resolution image by the corresponding grid points of the low resolution image. In other words, the invalid grid points are interpolated by using neighboring grid values within 3-grid distance.
The typical processing time to remap the largest en face strip, which contains 20 horizontal cycles, is 0.31 s. To remap a whole-depth sub-volume, which contains 500 depth-points in a single A-line, the remapping table (coordinate correspondence table) of the strip obtained by the first en face strip remapping process was reused. Since the creation of remapping table is the most time consuming process, it significantly reduces the remapping time of the whole depth strip as to be 7.41 s.
5. Conclusion
We proposed a method for motion-free 3D OCT imaging of the posterior eye. The eye is scanned by Lissajous scan pattern and the lateral and axial motions in the OCT volume are corrected by correlation based motion correction algorithm especially designed for the Lissajous scan. By confirming validity and repeatability of the motion-free OCT images, we conclude that this method can provide motion-free 3D OCT images of the in vivo posterior eye. This method may be helpful for standard ophthalmic examinations as well as the measurement of gross eye morphology.
Appendices
A. Cross-correlation of arbitrary shaped images
In this appendix, we describe a method for computing image correlations between two images with arbitrary and different shapes, such as strips of Lissajous scans in Fig. 3. Because standard fast correlation computation algorithms are designed for rectangular images, they cannot be applied to arbitrary shaped images.
This appendix aims at providing a definition of the correlation of arbitrary shaped images in a form which is implementable with fast correlation algorithms. Here, we start from the conventional definition of correlation and then derive another form that is implementable with a fast algorithm.
The conventional definitions of correlation between two arbitrary shaped images f(r) and g(r) is
| (18) |
where r = (x, y) represents a two-dimensional position and r′ = (Δx, Δy) is the mutual shift between two images as f(r) and g(r + r′). Further, is the covariance of f(r) and g(r + r′) within the overlapping area of the images, and and are the variances of f(r) and g(r + r′) within the overlapping area, respectively.
Although this equation can be numerically implemented, it is significantly slower than a standard image correlation algorithm based on the fast Fourier transform (FFT). Hence, we reformulate this equation to contain only the correlation functions of images with rectangle shapes. This enables an FFT-based fast computation of the correlation of arbitrary shape images.
The first step of the reformulation is to replace the arbitrary shape images by combinations of two rectangle shaped images. Namely, f(r) is replaced by f′(r)mf(r), where f′(r) is a rectangle shaped image defined as
| (19) |
The arbitrary value is not used for the subsequent computation, and can be set to be zero. Here, mf(r) is a rectangle shaped binary image mask representing the image area of f(r) and is defined as
| (20) |
Similarly, g(r) is replaced by g′(r)mg(r), where g′(r)and mg(r) are a rectangle image and a rectangle image mask, defined similarly to Eqs. (19) and (20), respectively, but using g(r). Note that f′(r), mf(r), g′(r), and mg(r) all have the same rectangle shape and size.
Using these rectangle images, the covariance in the numerator of Eq. (18) is represented as
| (21) |
where R is the whole region of the image and M is the overlapping region of f(r) and g(r +r′) (not f′(r) and g′(r +r′)) which is equivalent to the region where mf(r)mg(r + r′) = 1. Operation 〈 〉M denotes averaging within M, and ∑R and ∑M represent summation over R and M, respectively. Note that the denominator is the image cross-correlation of mf and mg and is denoted as mf ⊗ mg.
The 〈f′(r)〉M in the numerator of Eq. (21) is further expanded as
| (22) |
Here, we used the fact that the summations over M and R are exchangeable, that is,
| (23) |
where h(r) is an arbitrary function. Similarly,
| (24) |
Substituting Eqs. (22) and (24) into Eq. (21),
| (25) |
Exchanging the summations of M and R by Eq. (23), the first term of the summation in Eq. (25) becomes
| (26) |
The second term becomes
| (27) |
Similarly, the third term becomes
| (28) |
The fourth term becomes
| (29) |
where ∑M 1 is the area of the overlapping area of f(r) and g(r + r′), so it equals mf ⊗ mg. Note that the second and third terms are equivalent to each other, and the forth term is also equivalent except its reversed sign. Substituting Eqs. (26)–(29) into Eq. (25), the covariance becomes
| (30) |
This covariance is now expressed as a combination of correlation functions of rectangle shaped images.
The first variance in the denominator of Eq. (18) is then represented as
| (31) |
where we used Eq. (22) and a fact that (f′2mf) = (f′mf)2 as mf is a binary function. Similarly, the second variance becomes
| (32) |
Substituting Eqs. (30)–(32) into Eq. (18), the definition of correlation can be rewritten as
| (33) |
This equation can be computed using six cross-correlation functions among the rectangle shaped images. Hence, it can be implemented using a standard quick image correlation algorithm.
In practice, the correlation can become unreliable if the overlapping area of f(r) and g(r + r′) is too small. To avoid this unreliable correlation, ρ(r′) is set to zero if the overlapping area, i.e., mf ⊗ mg is less than a predefined threshold. In our motion correction method (Section 2.2.2), ρ(r′) was set to zero if the number of pixels in the overlapping area is smaller than the number of A-lines per horizontal cycle.
Disclosure
YC, YJH, SM, YY: Topcon (F), Tomey Corp (F), Nidek (F), Canon (F)
Funding
This research was supported in part by the Japan Society for the Promotion of Science (JAPS, KAKENHI 15K13371), Korea Evaluation Institute of Industrial Technologies (KEIT), and the Japanese Ministry of Education, Culture, Sports, Science and Technology (MEXT) through a contract of Regional Innovation Ecosystem Development Program.
References and links
- 1.Huang D., Swanson E. A., Lin C. P., Schuman J. S., Stinson W. G., Chang W., Hee M. R., Flotte T., Gregory K., Puliafito C. A., Fujimoto J. G., “Optical coherence tomography,” Science 254(5035), 1178–1181 (1991). 10.1126/science.1957169 [DOI] [PMC free article] [PubMed] [Google Scholar]
- 2.Drexler W., Fujimoto J. G., eds., Optical Coherence Tomography - Technology and Applications (Springer, 2015), 2nd ed. 10.1007/978-3-319-06419-2 [DOI] [Google Scholar]
- 3.Wojtkowski M., Srinivasan V., Fujimoto J. G., Ko T., Schuman J. S., Kowalczyk A., Duker J. S., “Three-dimensional retinal imaging with high-speed ultrahigh-resolution optical coherence tomography,” Ophthalmology 112(10), 1734–1746 (2005). 10.1016/j.ophtha.2005.05.023 [DOI] [PMC free article] [PubMed] [Google Scholar]
- 4.Schmidt-Erfurth U., Leitgeb R. A., Michels S., Považay B., Sacu S., Hermann B., Ahlers C., Sattmann H., Scholda C., Fercher A. F., Drexler W., “Three-dimensional ultrahigh-resolution optical coherence tomography of macular diseases,” Invest. Ophthalmol. Vis. Sci. 46(9), 3393–3402 (2005). 10.1167/iovs.05-0370 [DOI] [PubMed] [Google Scholar]
- 5.Yasuno Y., Madjarova V. D., Makita S., Akiba M., Morosawa A., Chong C., Sakai T., Chan K.-P., Itoh M., Yatagai T., “Three-dimensional and high-speed swept-source optical coherence tomography for in vivo investigation of human anterior eye segments,” Opt. Express 13(26), 10652–10664 (2005). 10.1364/OPEX.13.010652 [DOI] [PubMed] [Google Scholar]
- 6.Hangai M., Ojima Y., Gotoh N., Inoue R., Yasuno Y., Makita S., Yamanari M., Yatagai T., Kita M., Yoshimura N., “Three-dimensional imaging of macular holes with high-speed optical coherence tomography,” Ophthalmology 114(4), 763–773 (2007). 10.1016/j.ophtha.2006.07.055 [DOI] [PubMed] [Google Scholar]
- 7.Srinivasan V. J., Adler D. C., Chen Y., Gorczynska I., Huber R., Duker J. S., Schuman J. S., Fujimoto J. G., “Ultrahigh-speed optical coherence tomography for three-dimensional and en face imaging of the retina and optic nerve head,” Invest. Ophthalmol. Vis. Sci. 49(11), 5103–5110 (2008). 10.1167/iovs.08-2127 [DOI] [PMC free article] [PubMed] [Google Scholar]
- 8.Ishikawa H., Kim J., Friberg T. R., Wollstein G., Kagemann L., Gabriele M. L., Townsend K. A., Sung K. R., Duker J. S., Fujimoto J. G., Schuman J. S., “Three-dimensional optical coherence tomography (3d-OCT) image enhancement with segmentation-free contour modeling C-mode,” Invest. Ophthalmol. Vis. Sci. 50(3), 1344–1349 (2009). 10.1167/iovs.08-2703 [DOI] [PMC free article] [PubMed] [Google Scholar]
- 9.Tan O., Chopra V., Lu A. T.-H., Schuman J. S., Ishikawa H., Wollstein G., Varma R., Huang D., “Detection of macular ganglion cell loss in glaucoma by Fourier-domain optical coherence tomography,” Ophthalmology 116(12), 2305–2314 (2009). 10.1016/j.ophtha.2009.05.025 [DOI] [PMC free article] [PubMed] [Google Scholar]
- 10.Kawana K., Kiuchi T., Yasuno Y., Oshika T., “Evaluation of trabeculectomy blebs using 3-dimensional cornea and anterior segment optical coherence tomography,” Ophthalmology 116(5), 848 – 855 (2009). 10.1016/j.ophtha.2008.11.019 [DOI] [PubMed] [Google Scholar]
- 11.Fukuda S., Kawana K., Yasuno Y., Oshika T., “Anterior ocular biometry using 3-dimensional optical coherence tomography,” Ophthalmology 116(5), 882 – 889 (2009). 10.1016/j.ophtha.2008.12.022 [DOI] [PubMed] [Google Scholar]
- 12.Esmaeelpour M., Považay B., Hermann B., Hofer B., Kajic V., Kapoor K., Sheen N. J. L., North R. V., Drexler W., “Three-dimensional 1060-nm OCT: choroidal thickness maps in normal subjects and improved posterior segment visualization in cataract patients,” Invest. Ophthalmol. Vis. Sci. 51(10), 5260–5266 (2010). 10.1167/iovs.10-5196 [DOI] [PubMed] [Google Scholar]
- 13.Agawa T., Miura M., Ikuno Y., Makita S., Fabritius T., Iwasaki T., Goto H., Nishida K., Yasuno Y., “Choroidal thickness measurement in healthy Japanese subjects by three-dimensional high-penetration optical coherence tomography,” Graefe’s Arch. Clin. Exp. Ophthalmol. 249(10), 1485–1492 (2011). 10.1007/s00417-011-1708-7 [DOI] [PubMed] [Google Scholar]
- 14.Hammer D., Ferguson R. D., Iftimia N., Ustun T., Wollstein G., Ishikawa H., Gabriele M., Dilworth W., Kagemann L., Schuman J., “Advanced scanning methods with tracking optical coherence tomography,” Opt. Express 13(20), 7937–7947 (2005). 10.1364/OPEX.13.007937 [DOI] [PMC free article] [PubMed] [Google Scholar]
- 15.Pircher M., Baumann B., Götzinger E., Sattmann H., Hitzenberger C. K., “Simultaneous SLO/OCT imaging of the humanretina with axial eye motion correction,” Opt. Express 15(25), 16922–16932 (2007). 10.1364/OE.15.016922 [DOI] [PMC free article] [PubMed] [Google Scholar]
- 16.Vienola K. V., Braaf B., Sheehy C. K., Yang Q., Tiruveedhula P., Arathorn D. W., de Boer J. F., Roorda A., “Real-time eye motion compensation for OCT imaging with tracking SLO,” Biomed. Opt. Express 3(11), 2950–2963 (2012). 10.1364/BOE.3.002950 [DOI] [PMC free article] [PubMed] [Google Scholar]
- 17.Ferguson R. D., Hammer D., Paunescu L. A., Beaton S., Schuman J. S., “Tracking optical coherence tomography,” Opt. Lett. 29(18), 2139–2141 (2004). 10.1364/OL.29.002139 [DOI] [PMC free article] [PubMed] [Google Scholar]
- 18.Kraus M. F., Potsaid B., Mayer M. A., Bock R., Baumann B., Liu J. J., Hornegger J., Fujimoto J. G., “Motion correction in optical coherence tomography volumes on a per A-scan basis using orthogonal scan patterns,” Biomed. Opt. Express 3(6), 1182–1199 (2012). 10.1364/BOE.3.001182 [DOI] [PMC free article] [PubMed] [Google Scholar]
- 19.Kraus M. F., Liu J. J., Schottenhamml J., Chen C.-L., Budai A., Branchini L., Ko T., Ishikawa H., Wollstein G., Schuman J., Duker J. S., Fujimoto J. G., Hornegger J., “Quantitative 3d-OCT motion correction with tilt and illumination correction, robust similarity measure and regularization,” Biomed. Opt. Express 5(8), 2591–2613 (2014). 10.1364/BOE.5.002591 [DOI] [PMC free article] [PubMed] [Google Scholar]
- 20.Hendargo H. C., Estrada R., Chiu S. J., Tomasi C., Farsiu S., Izatt J. A., “Automated non-rigid registration and mosaicing for robust imaging of distinct retinal capillary beds using speckle variance optical coherence tomography,” Biomed. Opt. Express 4(6), 803–821 (2013). 10.1364/BOE.4.000803 [DOI] [PMC free article] [PubMed] [Google Scholar]
- 21.Zang P., Liu G., Zhang M., Dongye C., Wang J., Pechauer A. D., Hwang T. S., Wilson D. J., Huang D., Li D., Jia Y., “Automated motion correction using parallel-strip registration for wide-field en face OCT angiogram,” Biomed. Opt. Express 7(7), 2823–2836 (2016). 10.1364/BOE.7.002823 [DOI] [PMC free article] [PubMed] [Google Scholar]
- 22.Bazaei A., Yong Y. K., Moheimani S. O. R., “High-speed Lissajous-scan atomic force microscopy: Scan pattern planning and control design issues,” Rev. Sci. Instrum. 83(6), 063701 (2012). 10.1063/1.4725525 [DOI] [PubMed] [Google Scholar]
- 23.Ju M. J., Hong Y.-J., Makita S., Lim Y., Kurokawa K., Duan L., Miura M., Tang S., Yasuno Y., “Advanced multi-contrast Jones matrix optical coherence tomography for Doppler and polarization sensitive imaging,” Opt. Express 21(16), 19412–19436 (2013). 10.1364/OE.21.019412 [DOI] [PubMed] [Google Scholar]


