Abstract
Snapshot hyperspectral imaging augments pixel dwell time and acquisition speeds over existing scanning systems, making it a powerful tool for fluorescence microscopy. While most snapshot systems contain fixed datacube parameters (x,y,λ), our novel snapshot system, called the lenslet array tunable snapshot imaging spectrometer (LATIS), demonstrates tuning its average spectral resolution from 22.66 nm (80x80x22) to 13.94 nm (88x88x46) over 485 to 660 nm. We also describe a fixed LATIS with a datacube of 200x200x27 for larger field-of-view (FOV) imaging. We report <1 sec exposure times and high resolution fluorescence imaging with minimal artifacts.
OCIS codes: (170.2520) Fluorescence microscopy, (110.4234) Multispectral and hyperspectral imaging, (170.3880) Medical and biological imaging
1. Introduction
Fluorescence microscopy has become widespread in its use in biology over the last few decades [1]. Thousands of fluorophores have been developed to selectively label biological samples to identify cellular level features. Fluorescence emission at different wavelengths allows features of interest to be separated spectrally. Applications include FISH [2], FRET [3], and live-cell imaging [4]. Fluorescence imaging is complicated by the spectral proximity of fluorophores [5] and the use of many fluorophores in a single scene [6,7]. Hyperspectral Fluorescence Microscopy (HFM) acquires many spectral bands of a scene to create hyperspectral datacubes (x,y,λ), also called lambda stacks, and can provide high spectral resolution for demanding fluorescence imaging applications [8,9]. Spectral data enables the ability to linearly unmix many different co-localized fluorophores with closely overlapping emission and absorption profiles to determine their abundance at a given point in the scene [7].
HFM datacubes can be acquired in various ways. Point-scanning techniques collect spectral data (λ) at discrete spatial positions (x,y) with the most common technique being laser point-scanning confocal microscopy [10,11]. The 2-D scan required by single-beam laser confocal microscopy typically moves at 1 μs per pixel, which limits typical acquisitions to 0.5 to 2 seconds per lambda stack [12]. Dynamic scenes requiring high temporal resolution can be limited by the speed of point-scanning. Another drawback with point-scanning is the short pixel dwell time, which limits the number of photons acquired per pixel and reduces the signal-to-noise ratio (SNR) of the system. Line-scanning techniques can partially offset these problems by instead collecting at once a slice of the datacube (x,λ) requiring scanning in only one spatial direction (y) [13]. Wavelength-scanning systems acquire spectral bands (λ) sequentially by collecting wide-field images (x,y) with filters. Variable filters such as acousto-optic filters (AOTF) [14] and liquid crystal tunable filters (LCTF) [15] possess no moving parts and provide fast wavelength acquisition times but suffer from poor transmission efficiencies.
With recent advances in CCD technology, a class of spectrometers called snapshot hyperspectral imaging has emerged. The term “snapshot” refers to the spectrometer’s ability to record a lambda stack in a single exposure of the camera. They were first employed in astronomy [16] and remote sensing [17]. These spectral imagers can be designed to be advantageous over existing scanning spectrometers due to longer pixel dwell times, permitting their use in dim applications, and higher speeds, which eliminate motion artifacts for dynamic scenes [18]. The advantages of these spectral imagers have seen their increased use in microscopy applications over the last few years [19,20] and in vivo tissue imaging [21–25]. Each pixel’s exposure time to the collected light is the same as the time used to acquire the datacube, which increases irradiance per pixel in comparison to scanning techniques with the same datacube acquisition time or frame rate. Hence, situations with low signal such as fluorescence emission collection in microscopy benefit from snapshot hyperspectral imaging. The greater irradiance per pixel collected can reduce the need for high excitation energy, thus reducing the amount of photobleaching of fluorophores. Integral Field Spectroscopy (IFS) is a subset of techniques in snapshot hyperspectral imaging [26]. IFS uses either optical fibers, mirror arrays, or lenslet arrays to break apart an image, leaving void pixel space dedicated to spectral dispersion on the detector. The concept of using lenslet arrays as an IFS technique was first illustrated in the 1980s with a series of publications [27–29]. IFS with lenslet arrays continues to be used in the field of astronomy [30–32] and remote sensing [33,34]. However, this technique has seen limited use in microscopy. IFS with mirrors for HFM has been demonstrated with a camera called the Image Mapping Spectrometer (IMS) [35,36]. The IMS has acquired video rate speeds [37] with high light throughput, long pixel dwell time, and low computational costs.
In this paper, we present a novel adaptive snapshot spectral imager incorporating lenslet arrays for HFM called the Lenslet Array Tunable Snapshot Imaging Spectrometer (LATIS). We incorporate tunability, which is the ability to control the spectral resolution. The relatively straight forward geometry of a lenslet array system only requires minor changes to the system’s optics to incorporate this feature. Tunability allows for the re-arrangement of spatio-spectral pixel mapping on the detector. A fixed pixel region can record either more spectral pixel values (higher spectral resolution) at the cost of spatial pixel values (less field-of-view) and vice versa. Gaining spectral resolution results in the ability to resolve spectrally similar fluorophores. On the other hand, the reduction of spectral resolution results in fewer pixels mapping the same spectral range, which results in higher irradiance recorded per light sensing element and effectively increases the signal-to-noise (SNR) per photodetector. The LATIS principle can fit a wide range of HFM datacube requirements in one integrated system. Other systems in the past have provided tunability by the replacement of the dispersive element [38] at the cost of spectral range. To provide tunability with LATIS, we have integrated variable focal length lenses in place of fixed focal length lenses. The use of variable focal length lenses to implement tunability has been mentioned in prior art, but was never expanded upon in terms of its operating principle, design, implementation, and advantages [39]. With LATIS, the user can control the spectral resolution and datacube dimensions by changing the focal length of the varifocal optics and the rotation of the lenslet array while keeping the same dispersive element and spectral range. Our proof-of-concept tunable instrument uses off-the-shelf optics and provides two datacube settings as a demonstration: 80x80x22 and 88x88x46 (only limited in size due to the performance of consumer grade off-the-shelf optics). In addition, we built a fixed focal length (“static”) system, optimized for larger datacubes but not capable of tunability. Large field-of-view (FOV) images of bovine pulmonary artery endothelial (BPAE) cells and sectioned mouse tissue were acquired with this system. The system was configured for two different spectral ranges for each sample, 200x200x27 (515 to 635 nm) for BPAE cells and 200x200x17 (570 to 670 nm) for mouse tissue. To the best of our knowledge, this is the first implementation of lenslet arrays as an IFS for biological samples and the first snapshot spectral imager capable of tuning spectral resolution.
2. General principle
2.1 Integral field spectroscopy with lenslet arrays
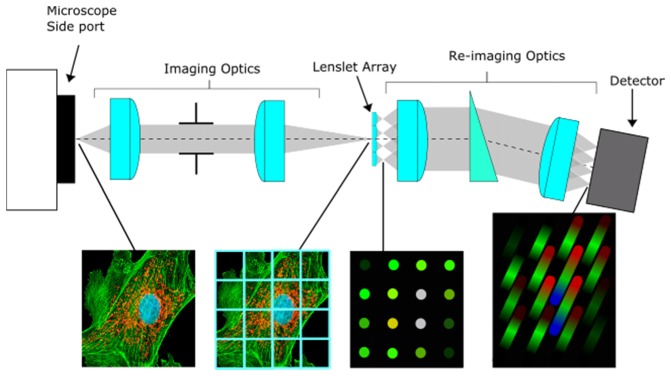
IFS with lenslet arrays, though proposed in the early 1980s, was not realized until its first installation on the Canada-France-Hawaii Telescope (CFHT) in 1987 [40]. The operating principle for lenslet arrays as an IFS for microscopy is the same as its operating principle for astronomy. To implement lenslet array IFS with microscopy, the microscope’s side port image is magnified and relayed by imaging optics onto a lenslet array as shown in Fig. 1. The lenslet array samples the enlarged image. The point spread function (PSF) of the imaging subsystem in the image space must be preserved by subsequent optical sub-systems in accordance with the Nyquist sampling theorem in order for the system to maintain diffraction-limited performance. At the focal plane of each lenslet, an image of the exit sub-pupil will form, comprising of all the light from the image that fell onto the spatial extent of the lenslet’s diameter. The lenslet takes a slower beam (high f-number) from the image and focuses it into a faster beam (low f-number), producing void space between adjacent sub-pupil images. The spatial location of each sub-pupil image corresponds to the spatial location in the image sampled by the lenslet array. The void space now allows for dispersion of each sub-pupil image without spatial and spectral overlap. The first lens from the re-imaging optics sub-system collimates the sub-pupil images. The light then passes through the dispersive element followed by the focusing lens, which forms images of dispersed sub-pupils on the 2-D photodetector. Each pixel sampling the sub-pupil image will correspond to a unique (x,y) location in the image plane with pixels along the long axis of an elongated sub-pupil image carrying information about the spectral signature of the scene (λ). The combination of both allows us to build a unique correspondence between object points (X,Y) and the position in the hyperspectral datacube (x,y,λ). To prevent spectral overlap, the separation between adjacent dispersed sub-pupils on the detector must be ≥ 1 pixel. To efficiently utilize detector space, the lenslets can be rotated to more compactly fit dispersed sub-pupil images. Possible rotations are the result of both the pixel spacing between adjacent dispersed sub-pupil images and the lenslet array geometry. The two common lenslet array geometries, hexagonal and rectangular, have different possible rotations due to their inherent lenslet arrangements. In general, larger rotations more compactly fit dispersed sub-pupil images, giving more room for spectral dispersion; but as a consequence, they require greater adjacent spectra pixel separation. Due to the correspondence between sub-pupil image position and the side port image, reconstruction only requires a re-arrangement of pixel values into a lambda stack, which may be reduced to a simple 2-D lookup table.
Fig. 1.
Lenslet array principle as an IFS for microscopy.
Each sub-pupil image can be treated as an equivalent to an exit pinhole in a standard point spectrometer. The lengths and widths of sub-pupil images on image detector depend on the re-imaging optics system. The width is directly dependent on the system’s magnification and the length is bound by the spectral dispersion of the prism element. The spectral range of the instrument is limited physically by the spectral transmission of the optical train and the spectral sensitivity of the detector. Since the sub-pupil rather than the field is imaged on the detector, the resolution of the microscope’s image is independent of the spectral resolution on the detector. The sub-pupil images given by the optical system on the imaging detector must be sampled in accordance with the Nyquist theorem in order to preserve the spatio-spectral content and avoid unwanted intensity beating and aliasing effects.
2.2 Tunability principle of LATIS
With integrated tunability, LATIS is able to control its spectral resolution without an exchange of optical components. The re-imaging system in LATIS images sub-pupil images onto the detector and consists of a collimating lens with a focal length of , a prism, and a refocusing optic with a focal length of . Dispersion, denoted by , is a function of the angular dispersion of the dispersive element, , and and is equivalent in the following manner
| (1) |
The PSF width, , is a function of the magnified image of the lenslet’s sub-pupil image diameter, , on the detector and is equivalent to
| (2) |
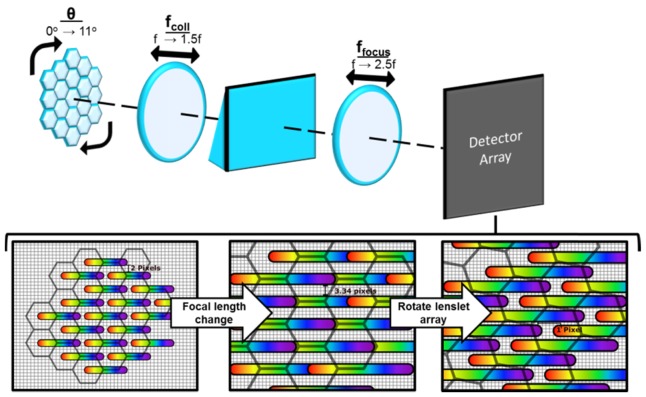
under the assumption of diffraction-limited imaging conditions between the collimating and refocusing optic. A demonstration of tunability is shown in Fig. 2 based on these equations. In this example, the initial value for and is the value, giving a magnification of 1, and the initial separation between adjacent spectra is 2 pixels due to the set pitch of this lenslet array. The physical distance is presented in terms of pixel size for this hypothetical detector. The lenslet pitch is 7.7 pixels. The width of the dispersed sub-pupils is 2 pixels and the length is 12 pixels. When is increased to, w and increase by 2.5x as long as the aperture stop size remains constant. However, by additionally increasing to , the factor by which w scales is x instead of 2.5x, which results in increased spectral dispersion. This is seen as overlap between collinear dispersed sub-pupil images as seen in Fig. 2. To remove this overlap, the lenslet array rotation, θ, is changed from 0° to 11°. The magnified image of the lenslets is overlaid onto the dispersed sub-pupils to illustrate rotation. Achievable rotation angles depend on lenslet array geometry with this particular example using a hexagonal arrangement. This new rotation is possible due to the increased adjacent spectra separation. After the focal length change, the adjacent spectra separation is 3.34 pixels. After the lenslet array rotation, the adjacent spectra separation is 1 pixel, preventing adjacent overlap between spectra. Note that as a consequence of increased magnification, spectral sampling improves for each sub-pupil at the cost of reduced FOV, resulting in a reduced count of sub-pupil images recorded by the image detector.
Fig. 2.
The tunability principle of LATIS. In this example, sub-pupil images from a hexagonal lenslet array are collimated and refocused onto the detector array. The lenslets are overlaid in grey on top of the dispersed sub-pupils to illustrate the rotation. Adjacent separation is 2 pixels between dispersed sub-pupil images. By changing from to and from to , spectral dispersion increases causing overlap of collinear dispersed sub-pupil images. Adjacent spectra separation is now 3.34 pixels. Rotating the lenslet array by 11° fits spectra on the detector with no spectral overlap and an adjacent spectra separation of 1 pixel.
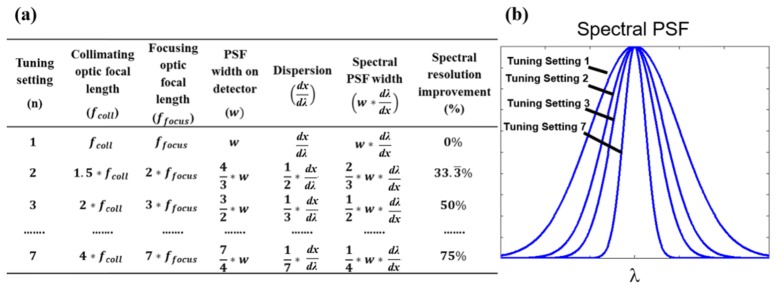
Varifocal lenses and lenslet array rotations can be adjusted further. Figure 3(a) presents a range of settings in a table based on Eq. (1) and 2 to demonstrate the extent of spectral resolution improvement (smaller spectral PSF). Spectral PSF change in width is modeled in Fig. 3(b) to conceptually present the spectral resolution improvement. Varifocal lenses have continuous focal length change; thus, LATIS is capable of achieving a multitude of tuning settings. Tuning settings are arranged in an order of increasing spectral resolution in reference to tuning setting 1, which is provided in the first row of Fig. 3(a). The lenslet array is assumed to be rotated between settings to accommodate increased spectral dispersion.
Fig. 3.
A range of tuning settings in an example LATIS system. Fig. (a). A table of 4 tuning settings based on Eqs. (1) and 2 to demonstrate the effect of focal length change on spectral PSF width. Fig. (b). A plot of the spectral PSF at each tuning setting.
3. Instrument description
LATIS is a universal imaging system that can be coupled to a wide array of imaging modalities such as microscopes, endoscopes, and fundus cameras. Our prototype has been coupled to the side port of a Zeiss AX10 inverted microscope to demonstrate HFM in the visible light range. It is presently configured for two tuning settings. A photograph of the prototype is shown in Fig. 4(a), and the schematic is presented in Fig. 4(b), displaying the configuration change between the two tuning settings. Changes between settings require no additional optics.
Fig. 4.
Illustrated schematic for LATIS. Fig. (a). Shows a photograph of the system at tuning setting 1. Fig. (b). Shows the schematic of the system. The filter has a bandpass of 485-660 nm to prevent spectral overlap. Red rays represent the longest wavelength passed by the filter. Blue rays represent the shortest wavelength. Only one sub-pupil image is shown to simplify the schematic. The adjustment from tuning setting 1 to 2 is done by changing the focal length of varifocal lens 1 from 20 mm to 30 mm, the focal length of varifocal lens 2 from 50 mm to 100 mm, and the lenslet array rotation from 0° to 11°. The detector is translated axially via a translation stage to refocus dispersed sub-pupil images between tuning settings.
Tunability utilizes the built-in mechanics of the system. The intermediate image at the side port is re-imaged by the 5x telescope, which consists of an f = 30 mm achromatic doublet and an f = 150 mm achromatic doublet, onto the lenslet array. In the infinity space of the telescope, a spectral bandpass filter limits the wavelength range (485 nm to 660 nm) to prevent spectral overlap between sub-pupil images. The lenslet array (APH-P(GB)-P30-F0.0480(633), Flexible Optical B.V.) samples the re-imaged side port image. The array’s dimensions act as a field stop. The lenslet array is a 17 mm x 17 mm array with transparent polymer lenslets on a glass substrate arranged hexagonally with a 0.03 mm pitch. This lenslet array was chosen for the high NA of each lenslet (0.3 NA at 633 nm) and the high density of lenslets (>1000 lenslets per 1 mm2). High density gives better sampling of the image on the array, and a high NA gives a smaller sub-pupil image size, increasing void space between adjacent spots. As a trade-off, high NA demands higher performance optics that follow. The lenslet array is mounted in a rotation mount (Thorlabs LCRM2) using an acrylic mask cut to the dimensions of the array which acts as an adapter in Fig. 5(a). This mount provides 360° of rotation around the optical axis. The lenslet array contains defective lenslets and imperfections and can be seen under a stereomicroscope (see Fig. 5(b)). The lenslet array was imaged under a white light interferometer and displayed in Fig. 5(c). The profiles are incomplete due to the steep curvature of the lenslets presented in Fig. 5(d). In Fig. 4(b), each sub-pupil image is collimated by the first varifocal lens (Olympus Zuiko ED 14-42mm f/3.5-5.6). The collimated sub-pupils are then dispersed by a 5° right angle fused silica prism, and then refocused by a second varifocal lens (Olympus Zuiko ED 40-150mm, F/4.0-5.6). To adjust from the first tuning setting to the second, the varifocal lens’ focal lengths are changed, and the lenslet array is rotated. The system is altered as follows: the focal length of the first varifocal lens is changed from 20 mm to 30 mm, the focal length of the second varifocal lens is changed from 50 mm to 100 mm, and the lenslet array is rotated to 11°. As a consequence of the varifocal lens focal length difference, the dispersed sub-pupil images on the detector become defocused due to the shifted axial position of the image plane, requiring a slight camera axial position shift via a translation stage.
Fig. 5.
Lenslet array mount and the characterization of the lenslet array surface. Fig. (a). Photograph of the lenslet array in the rotation mount. Fig. (b). Photograph of the lenslet array through a stereomicroscope. Missing lenslets and defects can be seen and are easy to spot through the stereomicroscope. Fig. (c). Intensity map of lenslets taken with a white light interferometer. Individual lenslet dents and imperfections can be seen. Fig. (d). The surface profile acquired with the white light interferometer. Due to the lenslet curvature, the surface profile is incomplete for steep portions of the lenslets’ surfaces.
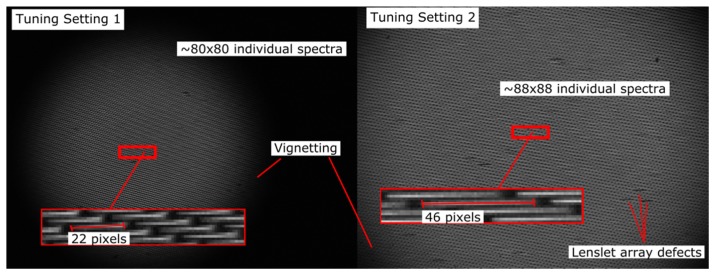
Due to the FOV vignette limit using this off-the-shelf varifocal lens combination, only 80x80 spots can be imaged at setting 1 and only 88x88 spots can be imaged at setting 2. The camera is a 1040x1392 CCD array (Retiga EXi 1394 Fast). Since not all sub-pupil images formed by the array can be imaged as shown in Fig. 6, the size of the camera array is sufficient for imaging all refocused sub-pupil images. The first setting gives a spectral sampling of 22 pixels, and the second setting increases that spectral sampling to 46 pixels. Since the magnification of the lenslet array sub-pupil image width changes by a factor of whereas the dispersion changes by a factor of 2, there is a theoretical spectral resolution improvement of (see imaging results).
Fig. 6.
Raw unprocessed images of dispersed sub-pupil images acquired with the Retiga EXi. The system is illuminated with a halogen source from the Zeiss AX10. Datacubes for tuning setting 1 and 2 are 80x80x22 and 88x88x46, respectively. Lenslet array defects manifest as missing or obscured dispersed sub-pupil images and are marked with arrows on right hand image.
To demonstrate that larger datacubes are possible, we set up a fixed magnification system, which we will refer to as the static LATIS system. The collimating optic is a Nikon 1.4D 50 mm prime lens and the refocusing optic is a Canon EF 100-400 mm varifocal lens set at 250 mm (see Fig. 7). This combination re-images sub-pupil images onto the detector with a 5x magnification and is necessary to prevent spectral overlap in this system. The number of sub-pupil images capable of being imaged on the detector is 200x200. To reduce chromatic aberration, the manual aperture on the prime lens was set to F/5.6, sacrificing light throughput for improved chromatic performance. To accommodate the new FOV, the detector array is changed to a 16 MP full frame camera (Imperx IPX-16-M3-LMFB) to acquire all 200x200 spots on the detector. Captured images are binned on the detector by 2 pixels vertically to increase SNR in the system and reduce exposure times, so the actual raw image size was 1624x4872 (7.9 MP).
Fig. 7.
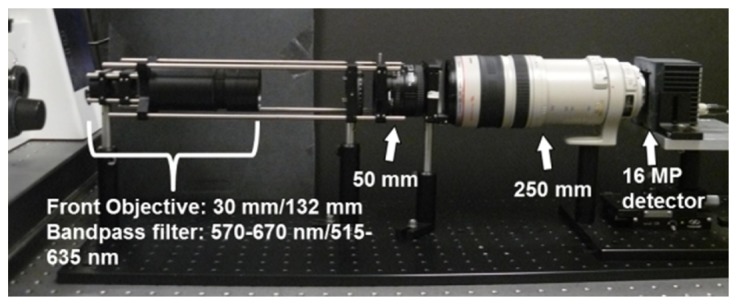
A photograph of the static LATIS system. Changes to optical setup from the previous tunable system are indicated with white arrows. The front optics and the bandpass filter were changed between specimens imaged and are detailed further in the Imaging results section.
4. Imaging results
4.1 Calibration and reconstruction
Due to the uniform hexagonal arrangement of lenslet arrays, the spatial position of each spot on the detector is linearly related to the (x,y) position of the reconstructed datacube (x,y,λ). Each spot is thus assigned a unique position in the datacube based upon its location on the detector.
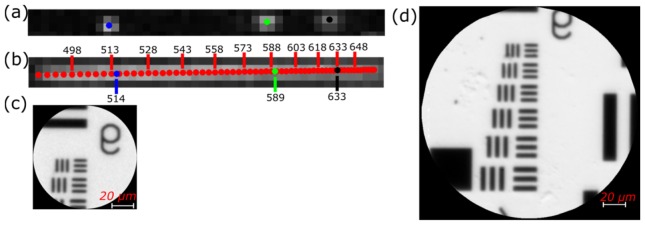
To assign the pixels on the detector to a unique λ position, three flatfield images, images with no specimen or sample, were taken successively with three 1-nm bandpass filters in the illumination path of the AX10 microscope. Imaging with the filters, centered at 514, 589, and 633 nm, gives the spectral response of the LATIS system at those wavelengths. Figure 8(a) shows a superposition of the three filter images in a sub-pupil image along the direction of dispersion. Blue, green, and black markers signify the centroids for 514, 589, and 633 nm and are used to interpolate the centroid positions for additional wavelengths as shown in Fig. 8(b). Reconstruction of unprocessed images was performed in MATLAB®. Interpolated positions are represented by red markers and spaced every 3 nm along the detector-sampled spectrum. Red marker density increases towards the longer wavelengths due to the prism’s nonlinear dispersion. Wavelength positions and values are interpolated to a sub-pixel position to provide smooth and continuous reconstructed images using the interp2() function in MATLAB®. Images for each spectral channel are then reconstructed with the known wavelengths and positions. The result of the interpolation creates images and spectra that are free of artifacts caused by missing lenslets and defects. Examples of reconstructed resolution targets for the tunable LATIS and the static LATIS are shown in Fig. 8(c) and Fig. 8(d).
Fig. 8.
Reconstruction of images for LATIS. Fig. (a). The spectral response of three narrow band filters with a 1-nm spectral bandpass. Each marker (blue, green, black) represents the centroid for each narrow band filter imaged. Fig. (b). Using the calculated centroids, wavelength positions are interpolated (represented by red markers). Due to the prism’s nonlinearity, pixel sampling of the spectrum is also nonlinear. Fig. (c). Reconstructed panchromatic image of a resolution target acquired with the tunable LATIS. Fig. (d). Reconstructed panchromatic image of a resolution target for the static LATIS. The FOV is larger due to the greater number of spatial samples (200x200 vs. 88x88).
4.2 Spectral resolution measurements for LATIS
Spectral resolution is defined as the smallest resolvable spectral feature in a spectrometer. Datacubes for four flatfield images were acquired, each taken with a different 1-nm filter in the illumination path of the AX10. The center wavelengths for the filters were 514, 532, 589, and 633 nm. The width of the transmission curves of these filters measured with LATIS gives the spectral PSF at each wavelength since the transmission bandwidth is smaller than LATIS’s spectral resolution. Datacubes were reconstructed using the calibration method outlined in section 4.1. The spectrum for each filter as recorded by LATIS was found by taking the mean pixel value over all spatial locations at each spectral channel. The results for both tuning settings are shown in Fig. 9. Measurements of the full width half maximum (FWHM) are shown in Table 1. The FWHM changed between settings from 13.25 ( ± 1.82) to 8.90 ( ± 1.31) nm, 14.46 ( ± 1.90) to 9.55 ( ± 1.37) nm, 24.31 ( ± 4.16) to 15.22 ( ± 1.64) nm, and 38.62 ( ± 9.88) to 22.09 ( ± 3.03) nm for wavelengths 514, 532, 589, and 633 nm, respectively. The spectral FWHM at longer wavelengths is larger due to the non-linearity of the prism dispersion. Shorter wavelengths experience greater dispersion, which translates into a smaller spectral width as seen in Table 1.
Fig. 9.
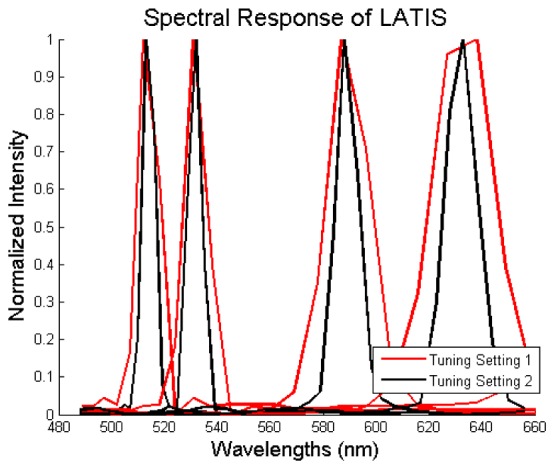
The mean spectral response for all spatial points at 514 nm, 532 nm, 589 nm, and 633 nm. The red lines represent the spectral response at tuning setting 1, and the black lines represent tuning setting 2.
Table 1. Full width half maximum (FWHM) measurements.
| Filter center wavelength (nm) | Tuning setting 1 (nm) | Tuning setting 2 (nm) | Improvement between settings (%) |
|---|---|---|---|
| 514 | 13.25 ± 1.82 | 8.90 ± 1.31 | 32.83 |
| 532 | 14.46 ± 1.90 | 9.55 ± 1.37 | 33.96 |
| 589 | 24.31 ± 4.16 | 15.22 ± 1.64 | 37.39 |
| 633 | 38.62 ± 9.88 | 22.09 ± 3.03 | 42.80 |
4.3 Spectral accuracy of LATIS
To measure the LATIS spectral accuracy, the transmission spectra of the three 1-nm filters, 532, 589, and 633 nm, were acquired, normalized, and compared to an Ocean Optics USB4000 spectrometer. Spectra for all filters and both spectrometers were superimposed in Fig. 10. The values for LATIS are interpolated every 1 nm, which results in a smooth appearance for the spectra. Sub-pixel values are found through this interpolation. The peaks observed with LATIS occur at exactly 532, 589, and 632 nm. This result is expected because these filters were used to calibrate this system; center wavelengths were assumed to be perfectly located at these spectral values when calibrating. Peaks observed with the Ocean Optics spectrometer occur at 531.3, 589, and 632.4 nm, revealing that the true center wavelengths fall short of the expected center wavelengths, but they are still within tolerance provided by the filter specifications. Small peaks occur at 560 and 630 nm for data acquired with the 532 nm filter. The existence of these peaks is due to lateral chromatic aberration on the detector images acquired with 532 nm illumination; thus, the source of the noise is unexpected crosstalk and not a reconstruction error.
Fig. 10.
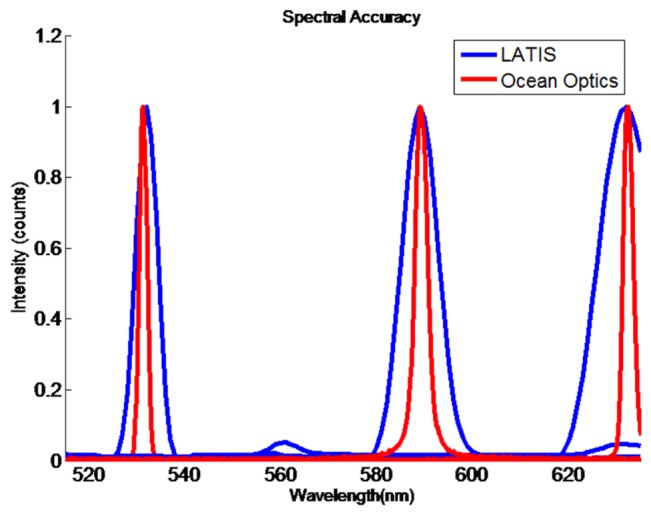
Spectral accuracy comparison of 1-nm filters between LATIS and an Ocean Optics USB4000 spectrometer.
4.4 Bead imaging experiments with LATIS
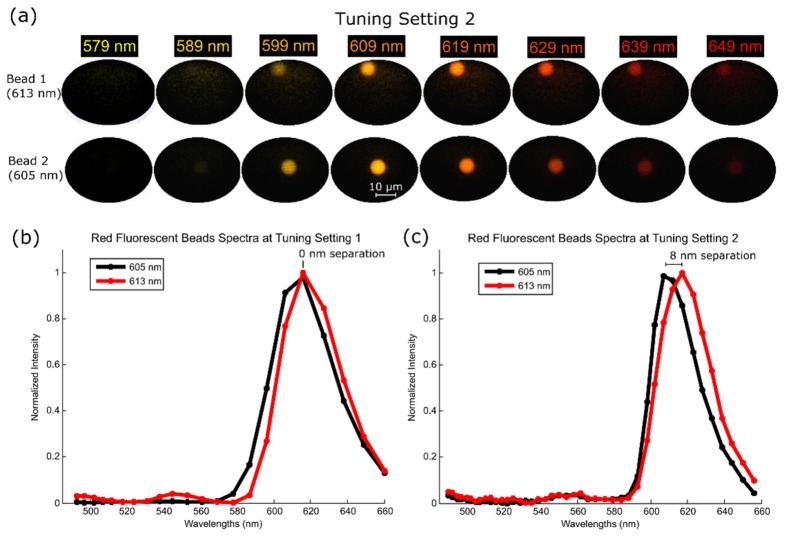
To observe the spectral difference between the two tuning settings of LATIS, datacubes were acquired of a fluorescent sample containing two different beads with close emission peaks (605 and 613 nm). The sample (Invitrogen FocalCheck test slide #2) was illuminated by a 120W X-Cite metal halide lamp, and fluorescence signal was gathered by a Zeiss EC Plan-Neofluar 20x (0.5 NA) objective. Figure 11(a) shows 8 selected spectral channels of the total 46 channels of both beads acquired using tuning setting 2. Figure 11(b) and 11(c) show plots of the superimposed spectra- for both beads acquired with tuning settings 1 and 2, respectively. Hyperspectral datacubes were acquired in a single exposure time of the camera and reconstructed post-acquisition. Spectral channels were pseudocolored with a wavelength-to-RGB conversion algorithm [41]. Smaller emission widths can be seen at tuning setting 2 when compared against tuning setting 1. The peaks in setting 1 overlap each other; however, they are distinguishable and separated by about 8 nm spectrally in setting 2.
Fig. 11.
Fluorescent beads measured with LATIS. Fig. (a). Eight-selected spectral channels from the 46 spectral channels of tuning setting 2 in which the fluorescent beads (613 nm and 605 nm) are imaged. Fig. (b). The recorded spectra using tuning setting 1 of both beads superimposed. Fig. (c). The recorded spectra using tuning setting 2 of both beads. The smaller emission width is due to the improved spectral resolution. Peaks no longer overlap when compared to the previous setting, giving an 8 nm separation
4.5 Fluorescence imaging of biological samples with LATIS
To gauge image quality with the static LATIS and to demonstrate larger datacubes, BPAE cells and mouse tissue, prepared off-site, were imaged. Samples were illuminated by the X-Cite lamp.
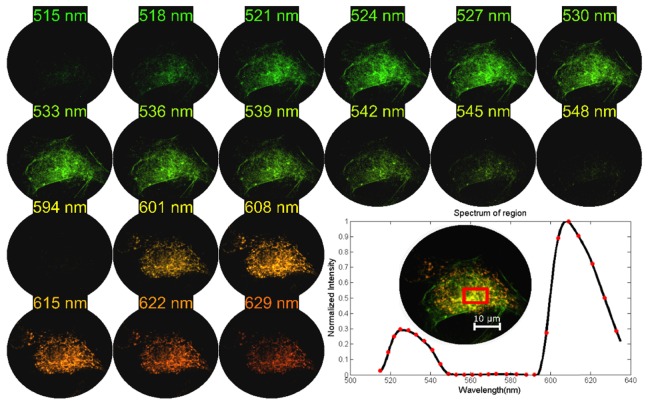
BPAE cells (Thermo Fisher F36924), containing Alexa Fluor 488 (Em = 512 nm) and MitoTracker Red (Em = 599 nm), were excited, and the signal was collected with a Zeiss oil immersion Plan-Apochromat 63x (1.4 NA) objective. To image BPAE cells, the LATIS’s front objective was changed to a Zeiss EC Epiplan-Neofluar 1.25x (0.03 NA, f = 132 mm) objective (see Fig. 7). The bandpass filter was changed to transmit 515 through 635 nm. The datacube size was 200x200x27 for all images acquired of BPAE cells. The integration time was 0.67 s, and camera gain was 25 dB. Eighteen reconstructed spectral channels of the 27 channels are displayed in Fig. 12. The green channels were multiplied with a gain of 3.33x relative to the red channels to enhance the brightness of Alexa Fluor 488 for display purposes only. By observing the averaged spectrum of the region in the red box, the emission peaks of Alexa Fluor 488 and Mito Tracker Red can be distinguished. The difference in intensity between fluorophores is apparent, showing the Alexa Fluor 488 peak is 4.42x smaller. Mito Tracker red easily saturates at this integration time. With a brighter green dye, a shorter exposure time would be possible.
Fig. 12.
BPAE cell imaging with the static LATIS. Using a bandpass filter of 515 to 635 nm, the datacubes acquired were 200x200x27. Eighteen spectral channels are displayed. The averaged spectrum in the red region is shown. Red markers are pixel values and the black lines are interpolated values.
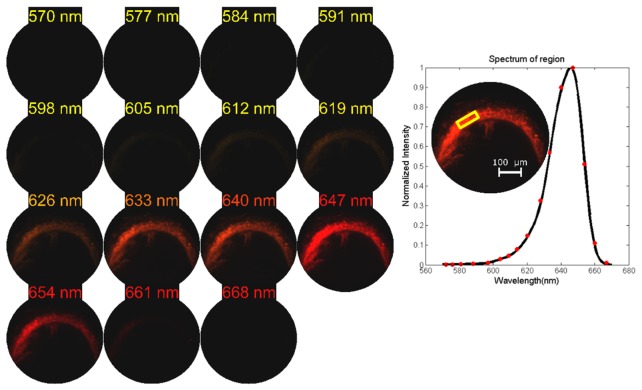
The imaged mouse tissue contains Quantum dot 655, which was injected into the cerebrospinal fluid of the cisterna magna of live mice. Lymph nodes were harvested post-mortem, containing coalesced quantum dots. For further information, see [42]. Fluorescence signal was gathered by a Zeiss Epiplan-Neofluar 5x (0.15 NA) objective. A new bandpass filter in LATIS limited the spectral range from 570 nm to 670 nm (see Fig. 7). The front-optic magnification was 5x. Spectral sampling was 17 pixels in this configuration, giving a datacube size of 200x200x17 for all images of quantum dots. Datacubes were acquired with a 5 second exposure time of the Imperx camera with a 20 dB gain. Longer exposure times were required in this setup due to the low NA of the objective imaging the sample (0.15 NA), which was chosen for its lower magnification to see the entirety of the lymph node. Exposure times <1 sec are possible with higher camera gains. In Fig. 13, 15 spectral channels of the total 17 are displayed and pseudocolored. A plot of the averaged spectrum of the region outlined in yellow box reveals the emission spectrum of the quantum dot. Red markers indicate actual pixel values, and the black lines indicate interpolated spectral values.
Fig. 13.
Quantum dot imaging of sectioned lymph node mouse tissue using the static LATIS. Using the 570 to 670 nm bandpass filter, the datacubes acquired were 200x200x17. Fifteen spectral channels of the 17 channels are displayed. The averaged spectrum for the region boxed in yellow is plotted. Red markers indicate pixel values and the black lines are interpolated values.
5. Discussion
We have implemented and demonstrated IFS with lenslets for HFM. Additionally, we have designed and tested a system called LATIS with a tunable datacube size, capable of being changed from 80x80x22 to 88x88x46. Spectral resolution improvement is obtained by increasing the focal length of the refocusing lens by a factor of 2 and the focal length of the collimating lens by a factor of 1.5, giving a 33% percent improvement in the spectral resolution while increasing the spectral sampling from 22 to 46 pixels. Two settings were chosen for demonstration; however, the system allows continuous variation of the spectral and spatial sampling as a result of the continuous change between lens focal length settings. Smaller focal length increment changes over the entire focal range of the varifocal lenses can give more tuning settings. To the best of our knowledge, this is the first tunable snapshot spectrometer and a unique demonstration of tunability without a physical change to the dispersive element. To demonstrate applicability in microscopy, we aligned LATIS with the side port of a microscope system and imaged several different biological samples while characterizing the spectral resolution and image reconstruction quality. Only 3 images are necessary for calibration after alignment at each tuning setting. This is advantageous over other IFS systems. Due to the irregularity of fibers and the complex geometry of mirror systems, IMS [37] and IFS fiber systems [26] require a spatial calibration component. The regularity and tightly controlled geometry of lenslet arrays obviated the need for this. Reconstruction of a resolution target yielded a high quality image with minimal spatial artifacts as shown in Fig. 8(c). A fixed magnification (“Static’) LATIS was implemented as well to demonstrate a larger FOV as shown in Fig. 8(d). With off-the-shelf optics and only half the pixel space of a full-frame CCD detector, we demonstrated a datacube size of 200x200x27. Future systems using optimized, high-performance optics and the entire pixel space of a full-frame camera could potentially boast larger datacubes. The spectral resolution was measured using 4 different 1-nm filters for both tuning settings. In Table 1, we see a reduction in the measured FWHM of the spectral response of the IMS for all 4 wavelengths, 32.84% improvement at 514 nm, 33.96% at 532 nm, 37.39% at 589 nm, and 42.80% at 633 nm. The theoretical improvement at all wavelengths was expected to be , which was achieved at 514 and 532 nm. The deviation from the theoretical improvement at 589 nm and 633 nm is attributed to chromatic aberration present in tuning setting 1. The larger f-number of the varifocal lenses at longer focal lengths mitigated the chromatic aberration seen at longer wavelengths. Future experiments are being planned to understand the extent of resolution and the irradiance per pixel trade-off.
Light throughput for both systems was limited due to the consumer-grade selection of lenslet arrays, collimating lenses, and refocusing lenses. The lenslet array, for example, lost light due to scattering at the polymer and glass interface. The present lenses were sufficient to demonstrate tunability and HFM, but future systems can be optimized for light throughput and better general performance to improve the field of view and chromatic aberration. Future systems can also provide larger datacube sizes with higher grade varifocal optics. An important improvement we plan to make is the addition of a fixed image plane to prevent re-alignment of the detector at each new tuning setting. Defocus of the image plane is common for varifocal lenses, but future lenses can be parfocal zoom lenses.
A beneficial use of the system resides in situations where the level of expression of one fluorophore is less than the expression of another; the system can increase its dynamic range by acquiring the same scene with the same excitation energy and exposure time at different tuning settings. By processing these images, the system can acquire the spectra of the fluorophores that would otherwise have been outside the dynamic range or below the spectral resolution of a static system. Additionally, the system would prove beneficial for discerning the minimal spectral datacube content required for imaging novel experimental conditions. In biological imaging where every photon can matter, new and unexplored imaging scenarios can be viewed by LATIS. Optimal datacube size and resolution requirements can be ascertained for these imaging situations for future system design. Once desired parameters for a particular biological scenario can be identified, static systems meeting the exact requirements can be built and dedicated for that particular application. Improvements need to be made to the system such as better light throughput, but the results offer promising utility in HFM.
Acknowledgements
The authors would like to thank the contributions of Michal E. Pawlowski, PhD, for his comments and suggestions for the written text and the contributions of Yeni H. Yucel, MD, PhD, for help with biological sample preparation and supply.
Funding
National Institute of Health (R01CA186132 and R21EB016832).
References and links
- 1.Lichtman J. W., Conchello J. A., “Fluorescence microscopy,” Nat. Methods 2(12), 910–919 (2005). 10.1038/nmeth817 [DOI] [PubMed] [Google Scholar]
- 2.Tkachuk D. C., Pinkel D., Kuo W. L., Weier H. U., Gray J. W., “Clinical applications of fluorescence in situ hybridization,” Genet. Anal. Tech. Appl. 8(2), 67–74 (1991). 10.1016/1050-3862(91)90051-R [DOI] [PubMed] [Google Scholar]
- 3.Pietraszewska-Bogiel A., Gadella T. W., “FRET microscopy: from principle to routine technology in cell biology,” J. Microsc. 241(2), 111–118 (2011). 10.1111/j.1365-2818.2010.03437.x [DOI] [PubMed] [Google Scholar]
- 4.Chudakov D. M., Lukyanov S., Lukyanov K. A., “Fluorescent proteins as a toolkit for in vivo imaging,” Trends Biotechnol. 23(12), 605–613 (2005). 10.1016/j.tibtech.2005.10.005 [DOI] [PubMed] [Google Scholar]
- 5.Schultz R. A., Nielsen T., Zavaleta J. R., Ruch R., Wyatt R., Garner H. R., “Hyperspectral imaging: a novel approach for microscopic analysis,” Cytometry 43(4), 239–247 (2001). [DOI] [PubMed] [Google Scholar]
- 6.Zimmermann T., Rietdorf J., Pepperkok R., “Spectral imaging and its applications in live cell microscopy,” FEBS Lett. 546(1), 87–92 (2003). 10.1016/S0014-5793(03)00521-0 [DOI] [PubMed] [Google Scholar]
- 7.Zimmermann T., “Spectral imaging and linear unmixing in light microscopy,” Adv. Biochem. Eng. Biotechnol. 95, 245-265 (2005). 10.1007/b102216 [DOI] [PubMed] [Google Scholar]
- 8.Sutherland V. L., Timlin J. A., Nieman L. T., Guzowski J. F., Chawla M. K., Worley P. F., Roysam B., McNaughton B. L., Sinclair M. B., Barnes C. A., “Advanced imaging of multiple mRNAs in brain tissue using a custom hyperspectral imager and multivariate curve resolution,” J. Neurosci. Methods 160(1), 144–148 (2007). 10.1016/j.jneumeth.2006.08.018 [DOI] [PMC free article] [PubMed] [Google Scholar]
- 9.Vermaas W. F., Timlin J. A., Jones H. D., Sinclair M. B., Nieman L. T., Hamad S. W., Melgaard D. K., Haaland D. M., “In vivo hyperspectral confocal fluorescence imaging to determine pigment localization and distribution in cyanobacterial cells,” Proc. Natl. Acad. Sci. U.S.A. 105(10), 4050–4055 (2008). 10.1073/pnas.0708090105 [DOI] [PMC free article] [PubMed] [Google Scholar]
- 10.Sinclair M. B., Haaland D. M., Timlin J. A., Jones H. D. T., “Hyperspectral confocal microscope,” Appl. Opt. 45(24), 6283–6291 (2006). 10.1364/AO.45.006283 [DOI] [PubMed] [Google Scholar]
- 11.Frank J. H., Elder A. D., Swartling J., Venkitaraman A. R., Jeyasekharan A. D., Kaminski C. F., “A white light confocal microscope for spectrally resolved multidimensional imaging,” J. Microsc. 227(3), 203–215 (2007). 10.1111/j.1365-2818.2007.01803.x [DOI] [PubMed] [Google Scholar]
- 12.Toomre D. K., Langhorst M. F., Davidson M. W., “Introduction to Spinning Disk Confocal Microscopy,” http://zeiss-campus.magnet.fsu.edu/articles/spinningdisk/introduction.html.
- 13.Cutler P. J., Malik M. D., Liu S., Byars J. M., Lidke D. S., Lidke K. A., “Multi-Color Quantum Dot Tracking Using a High-Speed Hyperspectral Line-Scanning Microscope,” PLoS One 8(5), e64320 (2013). 10.1371/journal.pone.0064320 [DOI] [PMC free article] [PubMed] [Google Scholar]
- 14.Kasili P. M., Vo-Dinh T., “Hyperspectral imaging system using acousto-optic tunable filter for flow cytometry applications,” Cytometry A 69(8), 835–841 (2006). 10.1002/cyto.a.20307 [DOI] [PubMed] [Google Scholar]
- 15.Woltman S. J., Jay G. D., Crawford G. P., “Liquid-crystal materials find a new order in biomedical applications,” Nat. Mater. 6(12), 929–938 (2007). 10.1038/nmat2010 [DOI] [PubMed] [Google Scholar]
- 16.Sparks W. B., Ford H. C., “Imaging spectroscopy for extrasolar planet detection,” Astrophys. J. 578(1), 543–564 (2002). 10.1086/342401 [DOI] [Google Scholar]
- 17.Vane G., Green R. O., Chrien T. G., Enmark H. T., Hansen E. G., Porter W. M., “The airborne visible/infrared imaging spectrometer (AVIRIS),” Remote Sens. Environ. 44(2–3), 127–143 (1993). 10.1016/0034-4257(93)90012-M [DOI] [Google Scholar]
- 18.Hagen N., Kudenov M. W., “Review of snapshot spectral imaging technologies,” Opt. Eng. 52(9), 090901 (2013). 10.1117/1.OE.52.9.090901 [DOI] [Google Scholar]
- 19.Elliott A. D., Gao L., Ustione A., Bedard N., Kester R., Piston D. W., Tkaczyk T. S., “Real-time hyperspectral fluorescence imaging of pancreatic β-cell dynamics with the image mapping spectrometer,” J. Cell Sci. 125(20), 4833–4840 (2012). 10.1242/jcs.108258 [DOI] [PMC free article] [PubMed] [Google Scholar]
- 20.Elliott A. D., Bedard N., Ustione A., Baird M. A., Davidson M. W., Tkaczyk T. S., Piston D. W., “Imaging Live Cell Dynamics using Snapshot Hyperspectral Image Mapping Spectrometry,” Microsc. Microanal. 19(S2), 168–169 (2013). 10.1017/S1431927613002833 [DOI] [Google Scholar]
- 21.Johnson W. R., Wilson D. W., Fink W., Humayun M., Bearman G., “Snapshot hyperspectral imaging in ophthalmology,” J. Biomed. Opt. 12(1), 014036 (2007). 10.1117/1.2434950 [DOI] [PubMed] [Google Scholar]
- 22.Kester R. T., Bedard N., Gao L., Tkaczyk T. S., “Real-time snapshot hyperspectral imaging endoscope,” J. Biomed. Opt. 16(5), 056005 (2011). 10.1117/1.3574756 [DOI] [PMC free article] [PubMed] [Google Scholar]
- 23.Gao L., Smith R. T., Tkaczyk T. S., “Snapshot hyperspectral retinal camera with the Image Mapping Spectrometer (IMS),” Biomed. Opt. Express 3(1), 48–54 (2012). 10.1364/BOE.3.000048 [DOI] [PMC free article] [PubMed] [Google Scholar]
- 24.Bedard N., Schwarz R. A., Hu A., Bhattar V., Howe J., Williams M. D., Gillenwater A. M., Richards-Kortum R., Tkaczyk T. S., “Multimodal snapshot spectral imaging for oral cancer diagnostics: a pilot study,” Biomed. Opt. Express 4(6), 938–949 (2013). 10.1364/BOE.4.000938 [DOI] [PMC free article] [PubMed] [Google Scholar]
- 25.Khoobehi B., Firn K., Rodebeck E., Hay S., “A new snapshot hyperspectral imaging system to image optic nerve head tissue,” Acta Ophthalmol. 92(3), e241 (2014). 10.1111/aos.12288 [DOI] [PubMed] [Google Scholar]
- 26.Allington-Smith J., Content R., “Sampling and Background Subtraction in Fiber‐Lenslet Integral Field Spectrographs,” Publ. Astron. Soc. Pac. 110(752), 1216–1234 (1998). 10.1086/316239 [DOI] [Google Scholar]
- 27.Courtes G., “Le télescope spatial et les grands télescope au sol,” Application de la Photométrie Bidimensionelle à l'Astronomie 1, 241 (1980). [Google Scholar]
- 28.Courtes G., “An integral field spectrograph (IFS) for large telescopes,” In Instrumentation for Astronomy with Large Optical Telescopes, Humphries C.M., ed. (Springer, 1982). [Google Scholar]
- 29.Courtes G., Georgelin Y., Bacon R., Monnet G., Boulesteix J., “A New Device for Faint Objects High Resolution Imagery and Bidimensional Spectrography,” In Instrumentation for Ground-Based Optical Astronomy, Robinson L.B., ed. (Springer, 1988). [Google Scholar]
- 30.Bacon R., Adam G., Baranne A., Courtes G., Dubet D., Dubois J. P., Emsellem E., Ferruit P., Georgelin Y., Monnet G., Pécontal E., Rousset A., Sayède F., “3D spectrography at high spatial resolution. I. Concept and realization of the integral field spectrograph TIGER,” Astron. Astrophys. Suppl. Ser. 113, 347 (1995). [Google Scholar]
- 31.Bacon R., Copin Y., Monnet G., Miller B. W., Allington-Smith J. R., Bureau M., Carollo C. M., Davies R. L., Emsellem E., Kuntschner H., Peletier R. F., Verolme E. K., de Zeeuw P. T., “The SAURON project–I. The panoramic integral-field spectrograph,” Mon. Not. R. Astron. Soc. 326(1), 23–35 (2001). 10.1046/j.1365-8711.2001.04612.x [DOI] [Google Scholar]
- 32.Lee D., Haynes R., Ren D., Allington-Smith J., “Characterization of lenslet arrays for astronomical spectroscopy,” PASP 113(789), 1406–1419 (2001). 10.1086/323908 [DOI] [Google Scholar]
- 33.Bodkin A., Sheinis A., Norton A., Daly J., Beaven S., Weinheimer J., “Snapshot hyperspectral imaging: the hyperpixel array camera,” Proc. SPIE 7334, 73340H (2009). 10.1117/12.818929 [DOI] [Google Scholar]
- 34.Bodkin A., Sheinis A., Norton A., Daly J., Roberts C., Beaven S., Weinheimer J., “Video-rate chemical identification and visualization with snapshot hyperspectral imaging,” Proc. SPIE 8374, 83740C (2012). 10.1117/12.919202 [DOI] [Google Scholar]
- 35.Gao L., Kester R. T., Tkaczyk T. S., “Compact Image Slicing Spectrometer (ISS) for hyperspectral fluorescence microscopy,” Opt. Express 17(15), 12293–12308 (2009). 10.1364/OE.17.012293 [DOI] [PMC free article] [PubMed] [Google Scholar]
- 36.Gao L., Kester R. T., Hagen N., Tkaczyk T. S., “Snapshot Image Mapping Spectrometer (IMS) with high sampling density for hyperspectral microscopy,” Opt. Express 18(14), 14330–14344 (2010). 10.1364/OE.18.014330 [DOI] [PMC free article] [PubMed] [Google Scholar]
- 37.Bedard N., Hagen N., Gao L., Tkaczyk T. S., “Image mapping spectrometry: calibration and characterization,” Opt. Eng. 51(11), 111711 (2012). 10.1117/1.OE.51.11.111711 [DOI] [PMC free article] [PubMed] [Google Scholar]
- 38.Larson J. M., “The Nikon C1si combines high spectral resolution, high sensitivity, and high acquisition speed,” Cytometry A 69(8), 825–834 (2006). 10.1002/cyto.a.20305 [DOI] [PubMed] [Google Scholar]
- 39.Bodkin A., Sheinis A., Norton A., “Hyperspectral imaging systems,” U.S. patent US20060072109 A1 (2006).
- 40.Bacon R., “The integral field spectrograph TIGER: results and prospects,” In IAU Colloq. 149: Tridimensional Optical Spectroscopic Methods in Astrophysics, Comte G., Marcelin M., eds. (Astronomical Society of the Pacific, 1995). [Google Scholar]
- 41.Bruton D., “Color Science,” http://www.midnightkite.com/color.html.
- 42.Mathieu E., Gupta N., Macdonald R. L., Ai J., Yücel Y. H., “In Vivo Imaging of Lymphatic Drainage of Cerebrospinal Fluid in Mouse,” Fluids Barriers CNS 10(1), 35 (2013). 10.1186/2045-8118-10-35 [DOI] [PMC free article] [PubMed] [Google Scholar]


