Abstract
Metabolic pathways contributing to adiposity and aging are activated by the mammalian target of rapamycin complex 1 (mTORC1) and p70 ribosomal protein S6 kinase 1 (S6K1) axis1–3. However, known mTORC1-S6K1 targets do not account for observed loss-of-function phenotypes, suggesting additional downstream effectors4–6. Here we identify glutamyl-prolyl tRNA synthetase (EPRS) as an mTORC1-S6K1 target that contributes importantly to adiposity and aging. EPRS phosphorylation at Ser999 by mTORC1-S6K1 induces its release from the aminoacyl tRNA multisynthetase complex (MSC), required for execution of noncanonical functions beyond protein synthesis7,8. To investigate physiological function of EPRS phosphorylation, we generated EPRS knock-in mice bearing phospho-deficient Ser999-to-Ala (S999A) and phospho-mimetic (S999D) mutations. Homozygous S999A mice exhibited low body weight, reduced adipose tissue mass, and increased lifespan, thereby displaying notable similarities with S6K1-deficient mice9–11 and mice with adipocyte-specific deficiency of raptor, an mTORC1 constituent12. Substitution of the EPRS S999D allele in S6K1-deficient mice normalized body mass and adiposity, indicating EPRS phosphorylation mediates S6K1-dependent metabolic responses. In adipocytes, insulin stimulated S6K1-dependent EPRS phosphorylation and release from the MSC. Interaction screening revealed phospho-EPRS binds Slc27a1 (i.e., fatty acid transport protein 1, FATP1)13–15, inducing its translocation to the plasma membrane and long-chain fatty acid uptake. Thus, EPRS and FATP1 are terminal mTORC1-S6K1 axis effectors critical for metabolic phenotypes.
Phosphorylation of aminoacyl-tRNA synthetases (AARSs) is emerging as a prevalent regulator of noncanonical functions beyond aminoacylation7,16. Vertebrate EPRS contains two distinct aminoacylation domains, connected by a non-catalytic linker, and first joined in a unicellular ancestor ~800 Mya17. Phosphorylation re-directs EPRS function from protein synthesis to transcript-selective translation inhibition by forming the interferon (IFN)-γ-activated inhibitor of translation (GAIT) complex that targets GAIT elements in select mRNAs in myeloid cells7. IFN-γ induces phosphorylation in human EPRS linker at Ser886 and Ser999; the latter is essential for GAIT complex assembly7. Cdk5/p35 kinase directly phosphorylates Ser886, and is upstream of an unidentified AGC kinase required for Ser999 phosphorylation8 (Fig. 1a). To identify the Ser999 kinase, 22 AGC kinases, and non-AGC MK2, were screened by immunocomplex kinase assay for phosphorylation of Ser886-to-Ala (S886A) mutant linker, phosphorylatable only at Ser999; S6K1 exhibited robust phosphorylation and modest activity was seen with RSK and AKT (Fig. 1b, Extended Data Fig. 1a). Only S6K1 showed target specificity, phosphorylating Ser999 but not Ser886 (Extended Data Fig. 1b). S6K1 knockdown in human peripheral blood monocytes (PBM) and U937 cells specifically inhibited EPRS Ser999 phosphorylation (Fig. 1c, Extended Data Fig. 1c). Endogenous phosphorylation using phospho-Ser999 EPRS antibody7 and in vitro phosphorylation of Ser999 linker by lysates from IFN-γ-treated bone marrow-derived macrophages (BMDM) from S6K2−/−, but not S6K1−/− and double-knockout mice, confirmed the requirement for S6K1 (Fig. 1d). Co-immunoprecipitation showed IFN-γ induced S6K1 binding to EPRS suggesting S6K1 as the proximal kinase (Fig. 1e). Finally, recombinant S6K1 (rS6K1) phosphorylated Ser999 in S886A linker (Fig. 1f, Extended Data Fig. 1d). Rapamycin, an mTORC1 inhibitor18, inhibited S6K1 phosphorylation at the classical Thr389 activation site, and suppressed EPRS Ser999 phosphorylation (Fig. 1g), as did siRNA targeting the mTORC1 constituent, raptor, but not the mTORC2 constituent, rictor2,18 (Extended Data Fig. 1e). To verify the mTORC1 requirement, S6K1 was suppressed with siRNA targeting the 3′UTR, and Myc-tagged S6K1 bearing a phospho-defective mutation at Thr389 was introduced (Extended Data Fig. 1f,g). The S6K1 T389A mutant, but not the phospho-mimetic T389E mutant, was unable to bind and phosphorylate EPRS (Extended Data Fig. 1g,h). These results establish the requirement for mTORC1-activated S6K1 to phosphorylate EPRS at Ser999 (Fig. 1a).
Figure 1. mTORC1-S6K1 phosphorylates EPRS at Ser999.
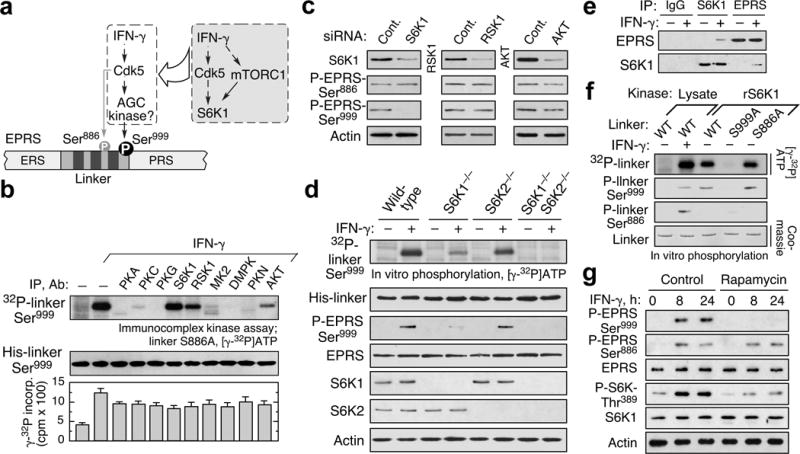
a, Schematic of IFN-γ-induced EPRS phosphorylation. Inset, pathway responsible for EPRS Ser999 phosphorylation. b, Immunocomplex kinase assay shows S6K1 phosphorylates Ser999 in EPRS linker bearing S886A mutation. Kinase activity determined with kinase-specific peptides (mean ± SEM, n = 3). c, S6K1 is required for Ser999 phosphorylation in 4-h IFN-γ-treated, siRNA-targeted PBMs. d, S6K1 is the primary S6K isoform that phosphorylates Ser999 determined using BMDM of S6K1−/−, S6K2−/−, and double-knockout mice. e, IFN-γ induces S6K1-EPRS interaction determined by co-immunoprecipitation. f, Recombinant full-length S6K1 directly phosphorylates Ser999 determined by [γ-32P]ATP labeling and by phospho-specific antibodies. g, Rapamycin (10 nM) blocks S6K1 activation and Ser999 phosphorylation in U937 cells.
To investigate the physiological role of EPRS phosphorylation, homozygous phospho-defective (Ser999-to-Ala; EPRSA/A) and phospho-mimetic (Ser999-to-Asp; EPRSD/D) knock-in mice in C57BL/6 background were generated by homologous recombination and verified (Extended Data Fig. 2a,b). Progeny of heterozygous crosses of both models exhibited near-Mendelian genotype distribution, indicating no apparent developmental defects (Extended Data Fig. 2c). Importantly, adult male and female EPRSA/A, but not EPRSD/D, mice exhibited about 15–20% lower weight than wild-type EPRSS/S mice (Fig. 2a, Extended Data Fig. 2d). The weight difference was not observed in embryonic or early developmental stages, but began at 8–10 weeks (Fig. 2a, Extended Data Fig. 2e,f). Marked lifespan increase was observed for both genders of EPRSA/A mice; the combined median increase was about 118 days or 15% (Fig. 2b and Extended Data Fig. 3a). Cox regression analysis revealed genotype, not gender, date of birth, or parental ID, as the most significant predictor of longevity with a hazard ratio substantially greater than one (Extended Data Fig. 3b). No change in lifespan was observed in EPRSD/D mice (Extended Data Fig. 3c–e).
Figure 2. Reduced adiposity and extended lifespan of EPRSA/A mice.
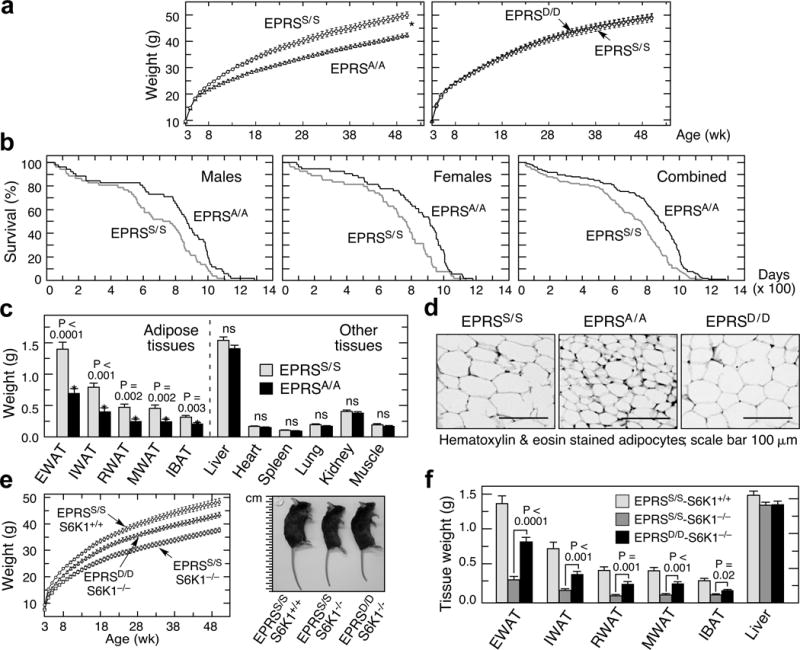
a, Growth curves of EPRSA/A (males, mean ± SEM, n = 14/group; P < 0.0001, 2-way ANOVA) and EPRSD/D (n = 10/group) mice. b, Kaplan-Meier survival curves for male (n = 52/group; log rank Mantel-cox (MC) χ2 = 6.75, P = 0.009; Gehan-Breslow-Wilcoxon (GBW) χ2 = 6.24, P = 0.012), female (n = 54/group; MC χ2 = 7.92, P = 0. 0.005; GBW χ2= 8.91, P = 0.003), and gender-combined (n = 106/group; MC χ2 = 15.28, P ≤ 0. 0.0001; GBW χ2= 14.96, P = 0.0001) EPRSS/S and EPRSA/A mice. c, Weights of white adipose tissues (WAT) (epididymal, EWAT; inguinal, IWAT; mesenteric, MWAT; retroperitoneal, RWAT) and interscapular brown adipose tissue (IBAT), from 20-week male mice; excised calf muscle comprised gastrocnemicus, soleus and plantaris from fascia (mean ± SEM, n = 14/group, P value from unpaired t-test). d, Histological micrographs of EWAT in 20-week male wild-type (EPRSS/S), EPRSA/A, and EPRSD/D mice. e, Growth of S6K1-null (EPRSS/S/S6K1−/−) and wild-type mice (EPRSS/S/S6K1+/+), and S6K1-null mice bearing S999D allele (EPRSD/D/S6K1−/−) (mean ± SEM, n = 10 males/group; P < 0.0001, 2-way ANOVA). Representative 20-week male mice (right). f, Tissues weights of 20-week mice of genotypes described in (f) (mean ± SEM, n = 10 males/group).
The body length of EPRSA/A mice was same as wild-type, however, the opened abdominal cavity revealed reduced adipose tissue in EPRSA/A mice (Extended Data Fig. 4a,b). The mass of major white adipose tissue (WAT) depots and interscapular brown adipose tissue (IBAT) in EPRSA/A was about half of that in EPRSS/S mice, but other major organs were unchanged (Fig. 2c); no mass differences were observed in EPRSD/D mice (Extended Data Fig. 4c). Reduced adipocyte size and unaltered number was observed in EPRSA/A mice (Fig. 2d, Extended Data Fig. 4d,e). Lipolysis and fatty acid β-oxidation were greater in EPRSA/A (Extended Data Fig. 4f,g). Serum glucose, triglycerides, and free fatty acid levels were unaltered in EPRSA/A mice, but insulin level was reduced (Extended Data Fig. 4h). High-fat diet (~60% total calories from fat) feeding induced EPRS phosphorylation in wild-type adipose tissue, and body weight gain was substantially reduced in EPRSA/A mice (Extended Data Fig. 4i,j). These characteristics of EPRSA/A mice approximately phenocopy S6K1-null and adipocyte-specific, raptor-deficient mice, suggesting EPRS as mTORC1-S6K1 effector contributing to obesity-related phenotypes9,10,12. To test this relationship, we bred phosphomimetic EPRSD/D alleles into S6K1−/− mice generated in C57Bl/6 background by targeted disruption19. Like the previously characterized S6K1−/− line9,20, the mice were small, however, obesity-related phenotypes were not investigated. Gene deletion was verified by genotyping and protein absence in adipocytes (Extended Data Fig. 5a,b). As before, this S6K1−/− line exhibited reduced body weight in embryos and early developmental stages9 (Extended Data Fig. 5c). Lifespan extension of about 170 d or 22% was observed in combined genders of S6K1−/− mice (Extended Data Fig. 5d–f). Introduction of S999D gain-of-function allele into S6K1−/− mice resulted in about 60% restoration of body and WAT mass toward wild-type, i.e., EPRSS/S-S6K1+/+, mice (Fig. 2e,f) indicating S6K1-mediated EPRS phosphorylation is a critical determinant of adiposity9,10,12. Incomplete restoration might indicate contributions of other established or as-yet unidentified mTORC1-S6K1 targets4,6,21.
Carbohydrate metabolism was investigated in EPRS mutant mice by glucose and insulin tolerance tests (GTT; ITT). Young adult (112 d) EPRSA/A mice exhibited slower glucose clearance following bolus injection of glucose, but faster clearance following insulin injection (Extended Data Fig. 6a,b). This paradoxical result is similar to observations in S6K1−/− mice10,22. Older (about 600 d) EPRSA/A mice metabolized glucose more quickly by both GTT and ITT (Extended Data Fig. 6c,d). Glucose metabolism was identical in EPRSD/D and wild-type mice, both young and old (Extended Data Fig. 6a–d). Food intake, fecal lipid excretion, and ketone body formation were essentially identical in EPRSA/A, EPRSD/D, and wild-type mice (Extended Data Fig. 6e–i). O2 consumption (VO2) and CO2 release (VCO2) were substantially higher in EPRSA/A mice compared to wild-type, both in the dark (as expected for nocturnal animals) and light phases, as observed in S6K1−/− mice9 (Extended Data Fig. 7a,b). The respiratory exchange ratio trended toward lower indicative of greater fat utilization (Extended Data Fig. 7c). Energy expenditure determined as heat output was significantly higher in EPRSA/A mice (Extended Data Fig. 7d). Energy balance in EPRSD/D mice was not significantly different from the wild-type (Extended Data Fig. 7e–h). Female EPRS mutant mice showed O2 consumption similar to males (Extended Data Fig. 7i).
In view of reduced EPRSA/A adipocyte size, and critical role EPRS in translation, we established that total protein synthesis in adipocytes was not disrupted (Extended Data Fig. 8a). Importantly, insulin, a principal agonist of mTORC1-S6K1 activation and adipocyte anabolic activity23, induced robust Ser999 phosphorylation in adipocytes from EPRSS/S mice; phosphorylation was abrogated in EPRSA/A mice despite S6K1 activation as detected by phosphorylation of S6K1 and its RPS6 target (Fig. 3a). Like myeloid cells, EPRS phosphorylation in adipocytes required mTORC1 and S6K1 (Extended Data Fig. 8b). EPRS phosphorylation in mouse adipocytes or differentiated 3T3-L1 cells was not stimulated by IFN-γ, the activator of EPRS and GAIT pathway in myeloid cells (Extended Data Fig. 8c). Likewise, insulin did not induce GAIT complex assembly or repress in vitro translation of GAIT element-bearing transcript in differentiated 3T3-L1 cells (Extended Data Fig. 8d,e). To determine the potential role of inflammation in the lean phenotype of EPRSA/A mice, we determined white blood cell levels and found no significant differences between EPRSA/A and wild-type mice in any leukocyte type (Extended Data Fig. 8f). Analysis of an anti-cytokine array showed differential expression of CC27 only, but the difference was not validated by immunoblot (Extended Data Fig. 8g,h).
Figure 3. Insulin induces EPRS-FATP1 interaction and LCFA uptake.
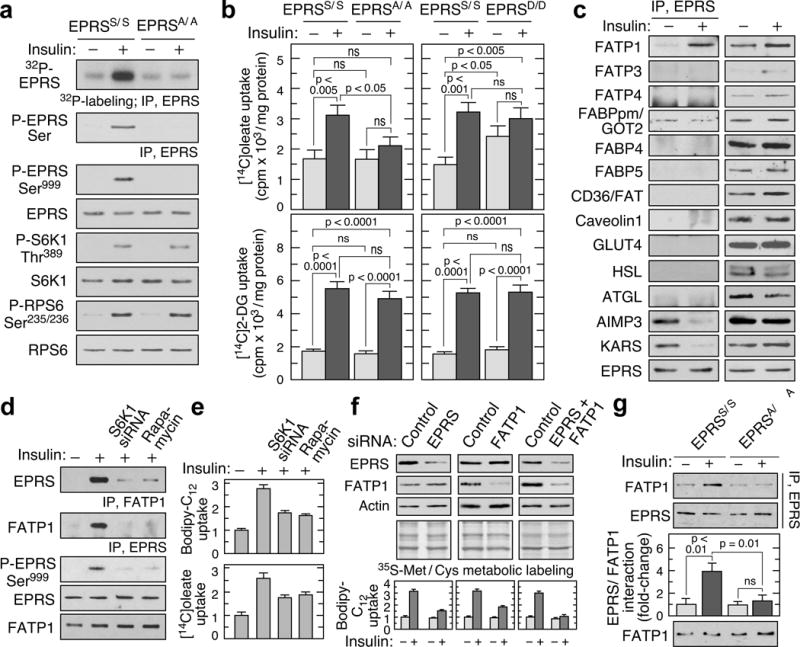
a, Ser999 phosphorylation in insulin-treated adipocytes by 32P-labeling and by immunoblot with anti-phospho-Ser and -phospho-Ser999 antibodies. b, Insulin-induced LCFA uptake is reduced in EPRSA/A but not EPRSD/D adipocytes (top, mean ± SEM, n = 10 mice/group). Insulin-induced deoxyglucose uptake is similar in all mice types (bottom, mean ± SEM, n = 6 mice/group). c, EPRS interaction screen of adipose tissue fatty acid binding proteins/transporters in insulin-treated 3T3-L1 adipocytes. d, Verification of EPRS-FATP1 interaction by two-way co-immunoprecipitation, and inhibition by S6K1 knockdown or rapamycin. e, S6K1 knockdown and mTORC1 inhibition block insulin-induced uptake of bodipy-dodecanoate (top) and [14C]oleate (bottom) (mean ± SEM, n = 4 experiments in duplicate). f, siRNA-mediated knockdown of EPRS, FATP1, or both (top) inhibits LCFA uptake (bottom; mean ± SEM, n = 4 experiments in duplicate) without affecting protein synthesis. g, Insulin-inducible EPRS-FATP1 interaction is significantly reduced in EPRSA/A adipocytes (mean ± SEM, n = 10 mice/group).
Insulin-stimulated long-chain fatty acid (LCFA) uptake was significantly reduced in EPRSA/A, but not EPRSD/D mouse adipocytes; glucose uptake was essentially identical (Fig. 3b). Insulin-stimulated LCFA uptake did not require EPRS phosphorylation in liver, heart, muscle, or BMDM (Extended Data Fig. 9a). Notably, a requirement for S6K1 in insulin-stimulated EPRS phosphorylation and LCFA uptake in adipocytes was observed (Extended Data Fig. 9b). Fatty acid binding proteins and transporters, together with lipolytic enzymes and a glucose transporter, were screened to identify potential downstream targets of phospho-EPRS. Insulin-dependent interaction of EPRS was observed exclusively with the fatty acid transporter, FATP1, a principal mediator of insulin-stimulated LCFA uptake in adipocytes (Fig. 3c)14,24. Insulin reduced EPRS association with two MSC constituents, AIMP3 and lysyl tRNA synthetase (KARS), establishing stimulus-dependent release from the parental complex (Fig. 3c). Interaction between phospho-EPRS and FATP1 was confirmed by co-immunoprecipitation, and binding was inhibited by S6K1 knockdown or rapamycin (Fig. 3d). Likewise, the inhibitors reduced insulin-stimulated uptake of bodipy-C12, a fluorescent LCFA analog, and [14C]oleic acid (Fig. 3e). Knockdown of EPRS or FATP1 by about 60% reduced LCFA uptake by about half, and knockdown of both further reduced uptake to near background, without inhibiting protein synthesis (Fig. 3f, Extended Data Fig. 9c). EPRS interaction with FATP1 was repressed in EPRSA/A mouse adipocytes indicating a strict requirement for Ser999 phosphorylation (Fig. 3g). Similar binding characteristics and LCFA uptake were observed in human adipocytes (Extended Data Fig. 9d). However, insulin-stimulated EPRS/FATP1 interaction was not observed in non-adipose tissues, suggesting a requirement for adipocyte-specific factors (Extended Data Fig. 9e). Also, interaction of EPRS with FATP1 was not seen in adipose tissue from S6K1−/− mice (Extended Data Fig. 9f,g). These results implicate EPRS and FATP1 as critical downstream effectors of mTORC1-S6K1 specifically contributing to adiposity. Low LCFA by EPRSA/A adipocytes could increase serum or hepatic lipid levels with pathological consequences. However, serum lipids in fed and fasted mice, and liver triglycerides and neutral lipids, revealed no significant differences (Extended Data Fig. 4h,10a,b).
Individual EPRS domains, catalytic ERS and PRS, and the connecting linker, were expressed in adipocytes in which endogenous EPRS was repressed by 3′UTR-specific siRNA (Fig. 4a). Insulin induced linker phosphorylation and interaction with FATP1, which in turn enhanced LCFA uptake (Fig. 4a). FATP1 failed to bind S999A mutant linker, but bound the S999D mutant even without insulin stimulation; LCFA uptake likewise required Ser999 phosphorylation (Fig. 4b). As shown by others, insulin induced FATP1 translocation from cytoplasm to membranes (Fig. 4c)14. Insulin-stimulated translocation required EPRS phosphorylation as EPRS and FATP1 localization in membranes was reduced in EPRSA/A adipocytes; in contrast, both translocated to membranes in EPRSD/D adipocytes even in the absence of insulin (Extended Data Fig. 10c). EPRS knockdown markedly reduced FATP1 membrane localization, but not vice versa, indicating EPRS is critical for FATP1 translocation (Fig. 4d). Membrane fractionation showed insulin induced FATP1 and EPRS translocation specifically to plasma membranes (Extended Data Fig. 10d).
Figure 4. EPRS linker binds FATP1 and induces membrane translocation.
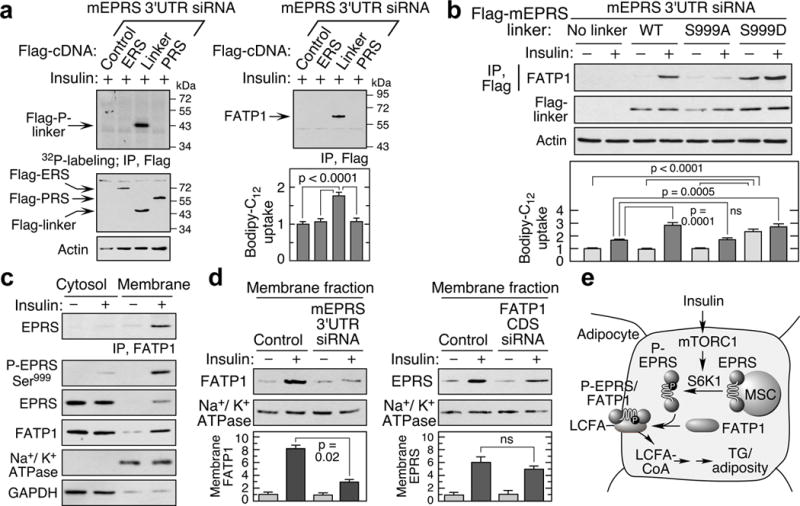
a, Insulin induces EPRS linker phosphorylation, binding to FATP1, and LCFA uptake. Endogenous EPRS in 3T3-L1 adipocytes was knocked down by 3′UTR-specific siRNA and cells transfected with Flag-tagged EPRS domains (ERS, PRS, and linker), and insulin-stimulated phosphorylation determined by 32P-labeling (left). Binding of EPRS domains to FATP1 was detected by co-immunoprecipitation, and LCFA uptake measured (mean ± SEM, n = 4 experiments in duplicate) (right). b, Expression of phospho-mimetic S999D linker facilitates interaction with FATP1 and fatty acid uptake even without insulin (mean ± SEM, n = 3 experiments in duplicate). c, Insulin induces translocation of Ser999-phosphorylated EPRS and FATP1 to membranes. Anti-GAPDH and -Na+/K+ ATPase antibodies verified cytosolic and membrane isolation. d, Effect of knockdown of EPRS (left) and FATP1 (targeting the coding sequence [CDS], right) on translocation to membrane. e, Schematic of mTORC1-S6K1 activation of EPRS and FATP1-mediated LCFA uptake in adipocytes.
The metabolic phenotype of EPRSA/A mice captures several salient features of S6K1−/− mice. They exhibit identical food intake, small adipocytes, reduced adiposity and body weight, improved glucose homeostasis in adults, and increased energy expenditure. Adipocytes from both mouse types have reduced insulin-stimulated EPRS binding to FATP1 and LCFA uptake, and enhanced basal lipolysis. We observed extended lifespan in EPRSA/A and S6K1−/− mice of both genders; a previous report showed significant longevity increase in female S6K1−/− mice, with similar trend for males10. However, S6K1−/− mice have reduced body weight at an earlier stage in development, and reduced muscle mass20,25. These differences might be explained by the breadth of S6K1 targets with multiple functions in diverse organ systems6,11,21,26. The phenotypic relationship between EPRSA/A and FATP1−/− mice is less clear. Both mice exhibit markedly reduced adipocyte and epididymal fat mass13. However, reduced body weight was no observed in FATP1−/− mice. Possibly, the difference is explained by genetic background, compensatory up-regulation of an alternative LCFA uptake mechanism in a knockout27, or by calculation of body weight as fraction of initial weight that can reduce apparent differences at later times13.
Adipocyte triglyceride accumulation is largely determined by relative fluxes through catalytic reactions driving LCFA uptake, its esterification to glycerol backbones, glyceride lipolysis, and β-oxidation. Phospho-EPRS enhances the first step by activating FATP1, and EPRS knockdown inhibits adipocyte LCFA uptake by ~50%. Interestingly, others report that depletion of FATP1 and CD36 reduces adipocyte LCFA uptake by ~25% and 60–70%, respectively, suggesting EPRS stimulates FATP1-independent uptake mechanisms28,29. Although stable interaction of EPRS was detected only with FATP1, we have not eliminated the possibility that EPRS activates transport by indirect mechanisms or by transient interactions not captured by immunoprecipitation. We also provide evidence that EPRS phosphorylation contributes to lipid accumulation by inhibiting catabolic reactions, i.e., lipolysis and fatty acid oxidation.
The mTORC1-S6K1 axis is central to metabolic pathways1–3, but established axis targets do not account for all observed loss-of-function metabolic phenotypes4–6. Our studies reveal an unexpected adipogenic pathway resulting from mTORC1-S6K1 activation of EPRS (Fig. 4e). EPRS belongs to the S6K1 substrate class, site-specifically phosphorylated despite the lack of the established kinase recognition sequence, R/KXRXXS/T6. Phospho-EPRS contributes to adiposity via membrane translocation and activation of FATP1, which stimulates LCFA uptake by an unresolved mechanism that might feature facilitated transport, or intracellular metabolic trapping by long-chain fatty acyl coenzyme A synthetase (ACSL) activity of FATP1 or by ligation of FATP1 to a distinct ACSL30. The binding of FATP1 to the non-catalytic linker domain in EPRS is consistent with the known binding promiscuity of linker WHEP domains, and the recent recognition that late-evolving, appended domains are largely responsible for noncanonical functions of multiple tRNA synthetases16. The noncatalytic domain represents a potential therapeutic target for obesity and aging-related disorders.
Methods
Reagents
Affinity-purified antibodies against total and Ser886 and Ser999 phospho-sites of EPRS were generated as described7,31. Antibody against phospho-Ser was from Meridian Life Science. Antibodies specific for the C-terminus of S6K1 and N-terminus of S6K2 were purchased from Abcam and LifeSpan, respectively. Antibodies against PKA, DMPK, PKN, GAPDH, caveolin1, CD36/FAT, GLUT4, His-tag, β-actin and FATP1, FATP3, and FATP4 were from Santa Cruz. Antibody specific for FABP4 and FABP5 were from R&D and for FABPpm/GOT2 was from GeneTex. All other antibodies and rapamycin were from Cell Signaling. SignalSilence siRNAs targeting RSK1, AKT and S6K1 were from Cell Signaling, and those targeting raptor and rictor were from Santa Cruz. The 3′UTR-specific duplex siRNAs, UGAUACGAAGAUCUUCUCAG and GCCUAAAUUAACAGUGGAA, targeting mouse EPRS were from Origene. Smart pool siRNA targeting the coding sequence of mouse FATP1 (SLC27a1) was from Dharmacon and 3′UTR-specific trilencer siRNA targeting human S6K1 was from Origene.
Plasmids and proteins
Recombinant wild-type and Ser-to-Ala (S886A and S999A) mutant His-tagged linker proteins spanning Pro683 to Asn1023 of human EPRS were expressed and purified as described7,8. Recombinant active S6K132 and RSK1–3 were from Cell Signaling; Akt1, and Akt2 were from EMD Millipore. Mouse EPRS domains ERS (Met1 to Gln682), linker (Pro683 to Asn1023), and PRS (Leu1024 to Tyr1512) were cloned into pcDNA3 vector with an N-terminus Flag tag using full-length mouse EPRS cDNA (Origene) as template. Flag-tagged mouse wild-type linker and linker with Ser999-to-Ala (S999A) and Ser999-to-Asp (S999D) mutations were generated as described33. Full-length human S6K1 cDNA in pCMV6-Entry vector was purchased from Origene and recloned, deleting the 23-amino acid N-terminus nuclear localization signal, and adding an in-frame upstream 6-His tag and a downstream Myc tag in pcDNA3. Specific Thr389-to-Ala (T389A) and Thr389-to-Glu (T389E) mutations were introduced using primers with the desired mutation and GENEART Site-Directed Mutagenesis System (Invitrogen).
Cell culture
Human U937 monocytic cells (CRL 1593.2; ATCC-certified) were cultured in RPMI 1640 medium and 10% fetal bovine serum (FBS) with penicillin and streptomycin at 37 ºC in 5% CO2. Bone marrow derived macrophages (BMDMs) were flushed from femur and tibia marrows of S6K1−/−, S6K2−/−, and double-knockout S6K1−/−/S6K2−/− mice (from George Thomas and Sara Kozma), and then cultured for one week in RPMI 1640 medium containing 10% FBS and 20% L929 cell-conditioned medium at 37 ºC in 5% CO2. 1 × 10⁷ cells were treated with 500 U/ml IFN-γ (R&D) for up to 24 h as described previously34,35. 3T3-L1 fibroblasts (CL-173; ATCC-certified) were cultured in high glucose containing Dulbecco’s modified Eagle’s medium (DMEM), 10% FBS and antibiotics/antimycotic at 37 ºC in 10% CO2 to near 75% confluence. Confluent fibroblasts were induced to differentiate in medium containing DMEM and 10% FBS supplemented with 1X solutions of insulin:dexamethasone:3-isobutyl-1-methylxanthine (Cayman). After 72 h, the medium was replaced with 10% FBS and DMEM containing only insulin and maintained for a week with 3 changes in the same medium. Adipocytes were maintained in DMEM medium with 10% calf serum and antibiotics/antimycotic for at least 3 d before utilization. Differentiated adipocytes were serum-deprived for 4 h followed by treatment with 100 nM insulin (Sigma-Aldrich) for 4 h, or as indicated. Cell lysates were prepared using Phosphosafe Extraction buffer (Novagen) supplemented with protease inhibitors.
Primary adipocytes from white adipose tissue (WAT) were prepared as described14,36. Briefly, after mouse sacrifice, fat pads were removed and minced in Krebs-Ringer-bicarbonate-HEPES (KRBH) buffer pH 7.4 containing 10 mM sodium bicarbonate, 30 mM HEPES, 200 nM adenosine, and 1% fatty acid-free bovine serum albumin (BSA, Sigma). WATs were digested with collagenase (2 mg/g) in KRBH buffer at 37 °C for 1 h. Digested WATs were suspended in DMEM supplemented with 10% FBS, and filtered through 100-μm mesh cell strainer (BD Falcon) to remove undigested material. The cell suspension was incubated for 10 min at room temperature, and adipocytes collected from the floating layer after cenrifugation. Adipocytes were incubated for 1 h at room temperature with gentle shaking and washed three times with DMEM.
Differentiated human adipocytes in adipocyte maintenance medium were obtained from Cell Applications. Adipocytes were maintained in DMEM medium with 10% calf serum and antibiotics/antimycotic for 2 d before utilization, and 5 × 10⁶ cells were serum-deprived for 4 h followed by treatment with 100 nM insulin for 4 h.
Hepatocytes were isolated by collagenase perfusion of mouse livers and cells seeded for 4 h on collagen-coated 6-well plates (1 × 10⁶ cells per well) in Williams’ medium E with 10% FBS, 25 mM HEPES, 100 nM insulin, and 100 nM triiodothyronine37–39. Cells were cultured for 48 h in serum-free Williams medium E with two medium changes. Before experiments, hepatocytes were pre-incubated overnight in serum-, insulin-, and triiodothyronine-free DMEM, and then with 100 nM insulin.
Adult mouse cardiac cells were isolated by sequential plating using non-perfusion adult cardiomyocyte isolation kit (Cellutron)40. After isolation, 1 × 10⁶ cardiac cells were incubated for 24 h in serum containing AS medium, and then with serum-free AW medium for another 24 h. Before experiments, cells were incubated for 4 h in serum-free DMEM, and then with 100 nM insulin.
All studies using cultured cells were repeated at least three times. The number of replicates was estimated from comparable published studies that gave statistically significant results.
Transfection
U937 cells (1 × 10⁷), PBMs and differentiated 3T3-L1 adipocytes (5 × 10⁶ cells for both) were transfected with endotoxin-free plasmid DNAs or siRNAs (target-specific and scrambled control) using nucleofector (100 μl solution V for U937 cells and PBMs and 100 μl solution L for 3T3-L1 adipocytes) from Amaxa nucleofection kit (Lonza) following the manufacturer’s protocol. Transfected cells were immediately transferred to pre-warmed Opti-MEM media for 6 h and then to RPMI 1640 (for U937 cells and PBMs) and DMEM (for 3T3-L1 adipocytes) containing 10% FBS supplemented with penicillin, streptomycin, and geneticin (G418; 20 μg/ml) for 18 to 24 h before treatment with insulin and inhibitors.
In vitro kinase and phosphorylation assays
Cell lysates or purified active kinases were pre-incubated with recombinant EPRS linker (wild-type and mutant) for 5 min in kinase assay buffer (50 mM Tris-HCl, pH 7.6, 1 mM dithiotheitol, 10 mM MgCl2, 1 mM CaCl2, and phosphatase inhibitor cocktail)7,8,33. Phosphorylation was initiated by addition of 5 μCi [γ-32P]ATP (Perkin-Elmer) for 15 min, and terminated using SDS gel-loading buffer and heat denaturation. Phosphorylated proteins were detected after resolution on Tris-glycine SDS-PAGE, fixation in 40% methanol and 10% acetic acid, and autoradiography. Immunoblot with anti-His tag antibody to detect EPRS linker served as control. To assay kinase activity using peptide substrates, 50 μM of synthetic peptides were phosphorylated with 1 μCi [γ-32P]ATP in kinase assay buffer. Equal volumes were spotted onto P81-phosphocellulose squares, washed in 0.5% H3PO4, and 32P incorporation determined by scintillation counting.
Immunocomplex kinase assay
U937 cell lysates were pre-cleared using Protein A-sepharose, and target AGC kinase members and a non-member, MK2 were immunoprecipitated by incubation with specific antibodies for 4 h. The immunocomplex was captured by incubating with protein A-Sepharose beads for 4 h, and washed three times with kinase assay buffer supplemented with 0.1% Triton X-100. The immunocomplex was resuspended in kinase assay buffer and used to phosphorylate EPRS linker as above, and 32P incorporation into peptide substrates was determined by scintillation counting41. Target peptides for S6K1/RSK1/MSK1/SGK494/NDR1/MRCKα/CRIK/RSKL1/ROCK1 and 2 (RRRLSSLRA), GRK2 (CKKLGEDQAEEISDDLLEDSLSDEDE), LATS1 (CKKRNRRLSVA), MAST1 (KKSRGDYMTMQIG), PRKX (RRRLSFAEPG), DMPK (KKSRGDYMTMQIG) and PDK1 (KTFCGTPEYLAPEVRREPRILSEEEQEMFRDFDYIADWC) were from SignalChem; for MK2 (KKLNRTLSVA) from Enzo Life Sciences; for PKA (RRKASGP), SGK1/AKT (RPRAATF), PKC/PKN (HPLSRTLSVAAKK); PKG, (RKISASEFDRPLR), and Cdk5 (PKTPKKAKKL) were from Santa Cruz.
Mouse husbandry
All mice were housed in microisolator cages (maximum 5 per cage of same-sex littermates) and maintained in climate/temperature- and photoperiod-controlled barrier rooms (22 ± 0.5 °C, 12/12 h dark/light cycle) with unrestricted access to water and standard rodent diet (Harlan Teklad 2918) deriving 24, 18, and 58 kcal% from protein, fat, and carbohydrate, respectively. Mice were fed standard rodent diet unless otherwise indicated. The number of animals used in each experiment was estimated from examination of comparable published studies that gave statistically significant results. All mouse studies were performed in compliance with procedures approved by the Cleveland Clinic Lerner Research Institute Institutional Animal Care and Use Committee.
Generation of mice with EPRS S999A and S999D knock-in mutations
Genetically-modified EPRS phospho-deficient S999A and phospho-mimetic S999D knock-in mice were generated (Xenogen Biosciences, Taconic). The RP23–86H18 BAC clone from mouse chromosome 1 containing full-length mouse EPRS gene was used to generate 5′ and 3′ homology arms, the knock-in region for the gene targeting vector, and Southern blot probes for screening targeted events. The homology arms and the knock-in region were generated by high-fidelity PCR, and cloned into the pCR4.0 vector. The S999A and S999D mutations (TCA to GCA or GAT, respectively) in exon 20 were introduced by PCR-based site-directed mutagenesis. The final vector also contained Frt sequences flanking the Neo expression cassette for positive ES cell selection, and a DTA expression cassette for negative selection. The targeting vector was electroporated into C57BL/6 ES cells and screened with G418. Positive expanded clones with confirmed mutation were selected. Neo was deleted by Flp electroporation, and blastocysts injected. Male chimeras were bred with C57BL/6 wild-type females, and resulting F1 heterozygotes interbred to generate homozygotes in C57BL/6 background. Genotyping was done using forward primer 5′-CAGCATAAGAACAGTTGCCAAATAAAGG-3′ and reverse primer 5′-TTCTTGAACACACACATGCACAGACTC-3′. For all experiments the wild-type (EPRSS/S), EPRSA/A and EPRSD/D were generated exclusively by breeding heterozygotes (EPRSS/A and EPRSS/D), and most experiments shown use male mice unless otherwise indicated. Mice were not randomized and studies done unblinded with respect to mouse genotype.
Generation of mice with knock-in of EPRSD/D in S6K1-null background
S6K1−/− mice in C57BL/6 background were generated at the National Jewish Medical and Research Centre (Denver, CO) by blastocyst injection of embryonic stem cells with targeted disruption of the S6K1 gene as described previously19,42. Briefly, neomycin (Neo) selection cassette was inserted to disrupt the exon corresponding to amino acids 207–237 in the catalytic domain of S6K1 thereby frame-shifting the downstream coding region. S6K1−/− mice exhibited phenotypes consistent with the previously reported mice that were generated by similar approach i.e., replacing the catalytic domains of S6K1 with a Neo selection cassette9,20. EPRSD/D/S6K1−/− and EPRSS/S/S6K1−/− were generated by EPRSS/D/S6K1−/− × EPRSS/D/S6K1−/− crosses. Mice wild-type for both EPRS and S6K1 genes (EPRSS/S/S6K1+/+) were generated from crosses of S6K1+/– heterozygotes.
Recruitment and determination of EPRSA/A mouse longevity
Male and female mice of EPRSS/S and EPRSA/A genotypes were recruited (n = 212 total mice) exclusively from crosses of heterozygotes (EPRSS/A). All mice were housed in microisolator cages (maximum 5 per cage of same-sex littermates) with routine cage maintenance as above. Weaned mice (> 21 days) born between June, 2010 and December, 2012 from 40 heterozygous parents were monitored daily and weighed biweekly for entire duration of their life. Mice that spontaneously developed conditions common in the C57BL/6 strain, such as malocclusion and hydrocephalus, were sacrificed and excluded from the study43. Assessments of deterioration in general health and quality of individual life were made in consultation with veterinary services of the Biological Resources Unit (BRU) of the Cleveland Clinic Lerner Research Institute. Severely sick and moribund mice that were judged to not survive another 48 h were euthanized with this date considered date of death, and included in the longevity analysis. Mice euthanized due to imminent death include 11.5% (6/52) male and 11.1% (6/54) female of EPRSS/S genotype, and 7.7% (4/52) male and 9.3% (5/54) female of EPRSA/A genotype. Longevity was analyzed by Kaplan-Meier survival curves from 212 mice (52 ♂ and 54 ♀ of each genotype, EPRSS/S and EPRSA/A) using known birth and death dates. Statistical differences were evaluated by log-rank Mantel-Cox and Gehan-Breslow-Wilcoxon tests using GraphPad Prism 5.
Recruitment and determination of EPRSD/D mouse longevity
Male and female mice of EPRSS/S and EPRSD/D genotypes were recruited (n = 89 total mice) exclusively from crosses of heterozygotes (EPRSS/D). All weaned mice (> 21 days born between February, 2011 and September, 2014 from 23 EPRSS/D parents) were housed in microisolator cages (maximum 5 per cage of same-sex littermates) with routine cage maintenance and health monitoring as above. Mice euthanized due to imminent death (as described above) include 8.7% (2/23) male and 9.5% (2/21) female of EPRSS/S genotype, and 8.3% (2/24) male and 4.8% (1/21) female of EPRSA/A genotype. Longevity was analyzed by Kaplan-Meier survival curves from 89 mice (23, 21 ♂ and 24, 21 ♀ of genotype, EPRSS/S and EPRSA/A, respectively) using known birth and death dates and statistical analysis as above.
Recruitment and determination of S6K1−/− mouse longevity
Male and female mice of S6K1+/+ and S6K1−/− genotypes were recruited (n = 112 total mice) exclusively from crosses of heterozygotes (S6K1+/–). All weaned mice (> 21 days born between February, 2011 and December, 2013 from 23 S6K1+/– parents) were housed in microisolator cages (maximum 5 per cage of same-sex littermates) with routine cage maintenance and health monitoring as above. Mice euthanized due to imminent death (as described above) include 13.8% (4/29) male and 10.3% (3/29) female of S6K1+/+ genotype, and 14.3% (4/28) male and 14.3% (3/21) female of S6K1−/− genotype. Longevity estimation was analyzed by Kaplan-Meier survival curves from 112 mice (29, 29 ♂ and 28, 26 ♀ of genotype, S6K1+/+ and S6K1−/−, respectively) using known birth and death dates and statistical analysis as above.
Longevity analysis by Cox proportional hazard (CPH) regression
Univariate and multivariate CPH regression models were performed to analyze the effects of 4 variables; genotype, date of birth (DOB), gender, and parental identity (PID), on longevity of mice recruited for the study. The independent variables were fitted as categorical variables in the model. Genotype and gender were coded as binary variables. DOB and PID were coded as multiple categories. For CPH regression analysis of EPRSS/S and EPRSA/A mice (n= 212), the data were coded as follows: genotype, EPRSS/S (1) and EPRSA/A (0); gender, male (0) and female (1). Based on unique occurrences, DOB and PID were categorized into 79 (0–78, 0 being the DOB for oldest mice in the study) and 40 (1–40) categories, respectively. Oldest DOB category represents the reference for DOB. PID-1 was considered reference for PID variable. Models were fit using Cox proportional hazards regression in R package “Survival” using coxph function. Univariate model was built fitting each of the 4 variables individually and multivariate model was built fitting all 4 variables simultaneously. For CPH regression analysis of EPRSS/S and EPRSD/D mice (n= 89), the data were coded as follows: genotype, EPRSS/S (1) and EPRSD/D (0); gender, male (0) and female (1). Based on unique occurrences, DOB and PID were categorized into 38 (0–37, 0 being the DOB for oldest mice in the study) and 23 (1–23) categories, respectively. For CPH regression analysis of S6K1+/+ and S6K1−/− mice (n= 112), the data were coded as follows: genotype, S6K1+/+ (1) and S6K1−/− (0); gender, male (0) and female (1). Based on unique occurrences, DOB and PID were categorized into 36 (0–35, 0 being the DOB for oldest mice in the study) and 23 (1–23) categories, respectively.
Scanning electron microscopy
Scanning electron microscopy was performed by the Cleveland Clinic Imaging Core. WAT from 20-week male mice was fixed using 2.5% glutaraldehyde and 4% paraformaldehyde in phosphate-buffered saline (PBS) overnight at 4 °C. Tissues were washed three times in PBS followed by post-fixation with 1% osmium tetroxide in PBS for 1 h at 4 °C. Finally, the tissues were dehydrated through graded alcohol (50, 70, 90, and 100%), twice in ethanol:hexamethyldisilizane (HMDS; 1:1), and three times in 100% HMDS for 10 min each, and dried at room temperature. Samples were mounted on aluminum stubs and coated with palladium-gold using a sputter-coater, and viewed at X500 magnification with a Jeol JSM 5310 Electron Microscope (EOL, Peabody, MA).
Histochemistry
Adipose tissues from 20-week male mice were fixed in formalin, dehydrated in ethanol, embedded in paraffin, and cut at 5-μm thickness. Sections were deparaffinized, rehydrated, and stained with hematoxylin and eosin by the Cleveland Clinic Histology Core. Stained tissues were visualized with Leica DM2500 microscope, captured with Micropublisher 5.0 RTV digital camera (QImaging) using a 5X objective lens for magnification, and QCapture Pro 6.0 (QImaging) software for image acquisition.
Determination of adipose tissue cell number
Adipocytes from 100 mg EWAT of 20-week male mice were isolated as described above and suspended in DMEM. Cells were counted in a hemocytometer.
Lipolysis in primary adipocytes
Basal lipolysis in primary adipocytes from EPRSS/S, EPRSA/A, and EPRSD/D EWAT was measured by glycerol release using adipolysis assay kit (Cayman).
Fatty acid oxidation
Fatty acid oxidation in EWAT of 20-week male mice was performed as described13,44. Explants were placed in an Erlenmeyer flask (Kimble-chase Kontes) containing the reaction mixture (DMEM with 0.1 μCi of [14C]oleic acid, 100 mM L-carnitine, and 0.2% fat-free BSA), and conditioned for 5 min in a 37 °C CO2 incubator. The flask was sealed with a rubber stopper containing a center-well (Kimble-chase Kontes) fitted with a loosely folded filter paper moistened with 0.2 ml of 1 N NaOH, and incubated for 5 h at 37 °C. 14CO2 in the filter paper was trapped by addition of 200 μl of perchloric acid to the reaction mixture followed by incubation at 55 °C for 1 h. Radioactivity in the filter paper was determined by scintillation counting.
Food intake studies
At 16 weeks, mice were individually housed and given standard rodent diet and water ad libitum. Cumulative food intake was measured by weighing the mouse and food every second day for 30 consecutive days.
Glucose and insulin tolerance tests
Intraperitoneal glucose tolerance test (GTT) and insulin tolerance test (ITT) in EPRSS/S, EPRSA/A, and EPRSD/D mice were determined as described22,39. Briefly, GTT was done after an overnight (12 h) fast followed by peritoneal injection of glucose (2 mg/g body weight, Sigma). ITT was performed in 6-h fasted mice by injection of 0.75 U/kg body weight of insulin (Sigma). Blood glucose was determined using a commercial glucometer (Contour, Bayer).
Blood and serum measurements
Serum triglycerides (TG), free fatty acids (FFA), glucose, and insulin in 12-h fasted and in 1-h post-prandial (fed) mice were determined using commercially available kits. TG, FFA, and glucose kits were from Wako. Insulin was determined using enzyme-linked immunoassay-based, ultra-sensitive mouse insulin kit (Crystal). Determination of serum β-hydroxybutyrate (for ketone body analysis) from 6-h fasted mice was done using colorimetric assay kit from Cayman. WBC counts in blood freshly collected by cardiac puncture in the presence of 10 mM EDTA were determined using Advia hematology system.
Fecal lipid excretion
Lipid content in mouse feces was determined after extraction with chloroform:methanol (2:1)45,46.
GAIT system activity assay by in vitro translation
GAIT system activity in insulin-treated adipocytes was determined by in vitro translation of capped poly(A)-tailed Luc-Cp GAIT and T7 gene 10 reporter RNAs as described35,47. Gel-purified RNAs were incubated with lysates from U937 monocytes and differentiated 3T3-L1 adipocytes in the presence of rabbit reticulocyte lysate and [35S]methionine. Translation of the two transcripts was determined following resolution on 10% SDS-PAGE and autoradiography.
Serum cytokine determination
Cytokine levels in mouse serum (100 μg protein) were determined using mouse cytokine antibody array C3 kit (RayBiotech).
Assay of liver lipid content
Mouse liver triglyceride content was determined by measurement of glycerol following saponification in ethanolic KOH (2:1, ethanol: 30% KOH)48. For assessment of total neutral lipid, freshly isolated liver slices were frozen in OCT, 5-μm sections stained with Oil Red O, and analyzed by densitometry using NIH image J as described49.
Energy metabolism by indirect calorimetry
Mouse energy metabolism was determined by indirect calorimetry using the Oxymax CLAMS system (Columbus Instruments) in the Rodent Behavioral Core of the Cleveland Clinic Lerner Research Institute. Mice were housed individually in CLAMS cages and allowed to acclimate for 48 h with unrestricted excess to food and water. Thereafter, O2 consumption (VO2), CO2 release, RER and heat generation were recorded for 24 h spanning a single light-dark cycle.
32P-Metabolic labeling
Adipocytes from 500 mg WAT from wild-type and EPRSA/A mice were labeled with 150 μCi of 32P-orthophosphate (MP Biomedicals) in phosphate-free DMEM medium in absence or presence of insulin (100 nM) for 4 h. EPRS was immunoprecipitated with antibodies cross-linked to Protein A-Sepharose beads (Sigma) in 50 mM Tris-HCl (pH 7.6), 150 mM NaCl, 1% Triton X-100, 1% NP-40, 0.5% sodium deoxycholate, 0.1% SDS, and protease/phosphatase inhibitor cocktail. Immunoprecipitated beads were washed with 50 mM Tris-HCl (pH 7.6), 150 mM NaCl, and 0.1% Triton X-100, and then in 50 mM Tris-HCl (pH 7.6) and 150 mM NaCl. 32P incorporation in immunoprecipitated proteins was determined by Tris-glycine SDS-PAGE, fixation and autoradiography.
Determination of protein synthesis by labeling with [14C]Glu and [14C]Pro
Adipocytes (0.25 × 10⁶ cells) were pre-incubated in serum-free DMEM for 4 h. Subsequently, the medium was supplemented with 2.5 μCi [14C]Glu or [14C]Pro (Perkin-Elmer), and cells incubated for additional 6 h. Adipocytes were lysed and 14C incorporation determined by trichloroacetic acid-precipitation and scintillation counting.
Determination of protein synthesis by [35S]Met/Cys metabolic labeling
Mouse adipocytes (0.25 × 10⁶ cells) were pre-incubated in methionine-free RPMI medium (Invitrogen) with 10% FBS for 30 min. [35S]Met/Cys (250 μCi, Perkin-Elmer) was added and incubated at 37 °C with 5% CO2 for 15 min. Labeled cells were lysed in RIPA buffer (Thermo Fisher) and analyzed by Tris-glycine SDS-PAGE, fixation and autoradiography.
Immunoblot analysis
Cell lysates or immunoprecipitates were denatured in Laemmli sample buffer (Bio-Rad) and resolved on Tris-glycine SDS-PAGE (10, 12, or 15% polyacrylamide) prepared using 37.5:1 acrylamide:bis-acrylamide stock solution (National Diagnostics). After transfer to polyvinyl difluoride membrane, the membranes were probed with target-specific antibody, followed by incubation with horseradish peroxidase conjugated secondary antibody and detection with Amersham ECL prime western blotting detection reagent (GE Healthcare). Immunoblots shown are typical of experiments independently done at least three times.
Co-immunoprecipitation
Pre-cleared cell lysates (1 mg) were incubated with antibody cross-linked to protein A-Sepharose beads in detergent-free buffer containing 50 mM Tris-HCl (pH 7.6), 150 mM NaCl, and EDTA-free protease/phosphatase inhibitor cocktail. Immunoprecipitates were analyzed by Tris-glycine SDS-PAGE and immunoblotting either after washing the beads three times in the same buffer or after elution, followed by neutralization with 0.2 M glycine-HCl (pH 2.6) or 50 mM Tris-HCl (pH 8.5), respectively.
Fatty acid uptake assays
Fatty acid uptake assay kit (QBT, Molecular Devices) that utilizes fluorescent bodipy-C12, a LCFA analog, was used to determine fatty acid uptake50. Differentiated 3T3-L1 adipocytes were plated at 5 × 10⁴ cells per well in a 96-well plate. Adipocytes were first incubated in serum-free Hanks balanced salt (HBS) solution for 4 h, and then with 100 nM insulin and bodipy-C12 for an additional 4 h. After 30 min, relative fluorescence was read at 485 nm excitation and 515 nm emission wavelength in bottom-read mode (SpectraMax GeminiEM, Molecular Devices).
LCFA uptake was also determined in differentiated 3T3-L1 adipocytes as cellular accumulation of [14C]oleate (Perkin-Elmer). Adipocytes (10,000 cells) were seeded in a 24-well plate in DMEM with 10% calf serum overnight. Cells were serum-deprived for 4 h, treated with 100 nM insulin for 3.5 h, and then with 50 μM of [14C]oleate in HBS containing 0.1% fatty acid-free BSA for 30 min51,52. Cells were washed extensively in cold HBS with 0.1% fatty acid-free BSA to remove unincorporated [14C]oleate, lysed in RIPA buffer (Thermo Fisher), and centrifuged at 2000 rpm for 5 min. Supernatant radioactivity was determined by scintillation counting and normalized to protein. LCFA uptake by mouse WAT, hepatocytes, cardiac cells, BMDM, and soleus muscle strips were measured using essentially the same method13.
Glucose uptake assay
Adipocytes from wild-type and mutant mice were pre-incubated for 4 h in serum- and glucose-free DMEM and then rinsed with Krebs-Ringer buffer containing 20 mM HEPES (pH 7.4), 5 mM sodium phosphate, 1 mM MgSO4, 1 mM CaCl2, 136 mM NaCl, and 4.7 mM KCl53,54. Adipocytes were incubated for 4 h in the presence of 1 μCi of [14C]2-deoxy-D-glucose (DG; Perkin-Elmer) and 100 nM insulin in the same buffer supplemented with 100 mM unlabeled 2-DG (Sigma). Uptake was stopped using ice-cold PBS containing 50 μM cytochalasin, followed by four washes with PBS. Lysate radioactivity was determined by scintillation counting.
Separation of cytosolic and membrane fractions
Membrane fraction from differentiated 3T3-L1 adipocytes was isolated by phase partitioning using Mem-PER Eukaryotic Membrane Protein Extraction Reagent Kit (Thermo-Scientific).
Isolation of plasma membranes
Plasma membrane fractions from 3T3-L1 adipocytes were prepared as described14. Differentiated 3T3-L1 adipocytes were washed in buffer containing 250 mM sucrose, 10 mM Tris pH 7.4, and 0.5 mM EDTA. Lysates were prepared by homogenization in the same buffer supplemented with protease and phosphatase inhibitor cocktail, and centrifuged at 16,000 g for 20 min at 4 °C. The re-suspended pellet was layered onto a solution containing 1.12 M sucrose, 10 mM Tris, pH 7.4, and 0.5 mM EDTA, and centrifuged at 150,000 g for 20 min at 4 °C. The resulting pellet was suspended in RIPA buffer (Sigma) and plasma membrane was obtained by centrifugation at 74,000 g for 20 min at 4 °C.
Data availability
All data generated are included in the published article and in the supplementary informationfiles. Additional statistical datasets generated are available from the corresponding author upon request.
Extended Data
Extended Data Figure 1. Identification of S6K1 as EPRS Ser999 kinase.
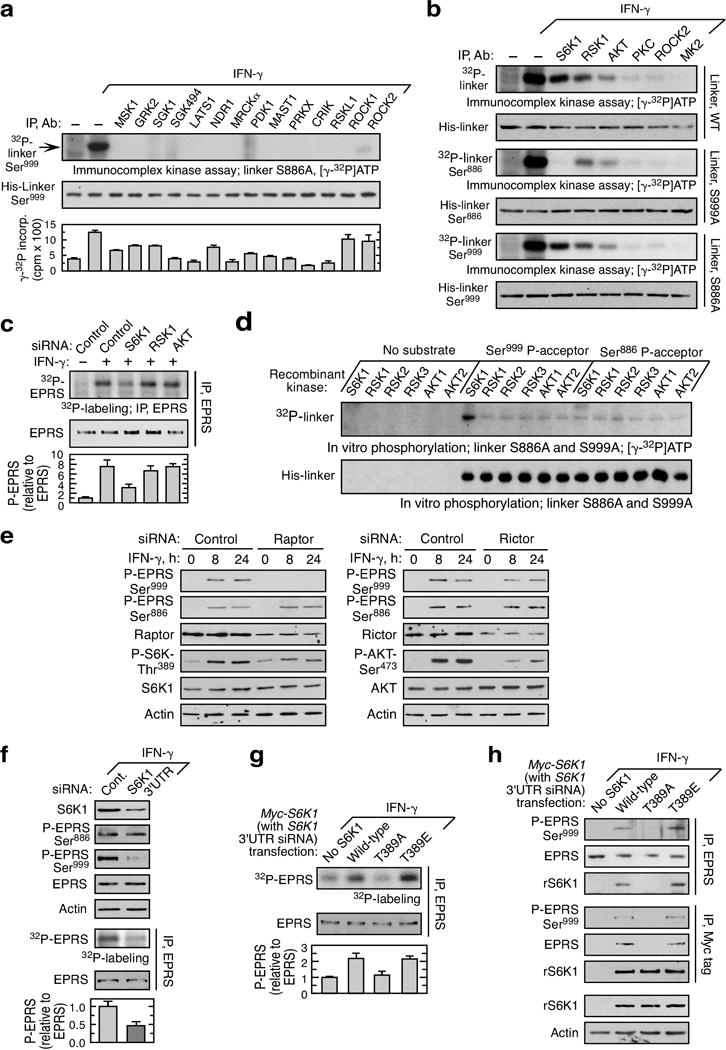
a, Screening of AGC kinase group members for phosphorylation of EPRS Ser999 by immunocomplex kinase assay and [γ-32P]ATP-labeling with S886A linker target in U937 cells. Kinase activity using kinase-specific substrate is shown (bottom; mean ± SEM, n = 3). b, Specificity of S6K1 for Ser999 phosphorylation, determined by 32P incorporation in wild-type (WT), S999A and S886 linker. c, siRNA targeting S6K1 inhibits IFN-γ-stimulated EPRS phosphorylation in U937 cells determined by 32P-labeling (mean ± SEM, n = 3). d, Active recombinant kinases used for in vitro phosphorylation of linker bearing S886A (Ser999 P-acceptor) mutation shows site-specific phosphorylation by S6K1. e, Raptor not rictor is required for Ser999 phosphorylation. f, siRNA targeting the S6K1 3’UTR inhibits S6K1 expression and phosphorylation of EPRS Ser999, but not Ser886 (mean ± SEM, n = 3). g, Phosphorylation of S6K1 Thr389 is required for phosphorylation of EPRS. Cells were co-transfected with siRNA targeting the 3’UTR to knock down endogenous S6K1, and with myc-tagged wild-type or mutant S6K1 cDNA; IFN-γ-stimulated EPRS phosphorylation determined by 32P-labeling (mean ± SEM, n = 3). h, Cells treated as in (e) but followed by reciprocal co-immunoprecipitation.
Extended Data Figure 2. Gene targeting and generation of EPRSA/A and EPRSD/D knock-in mice, and their body weight phenotypes.
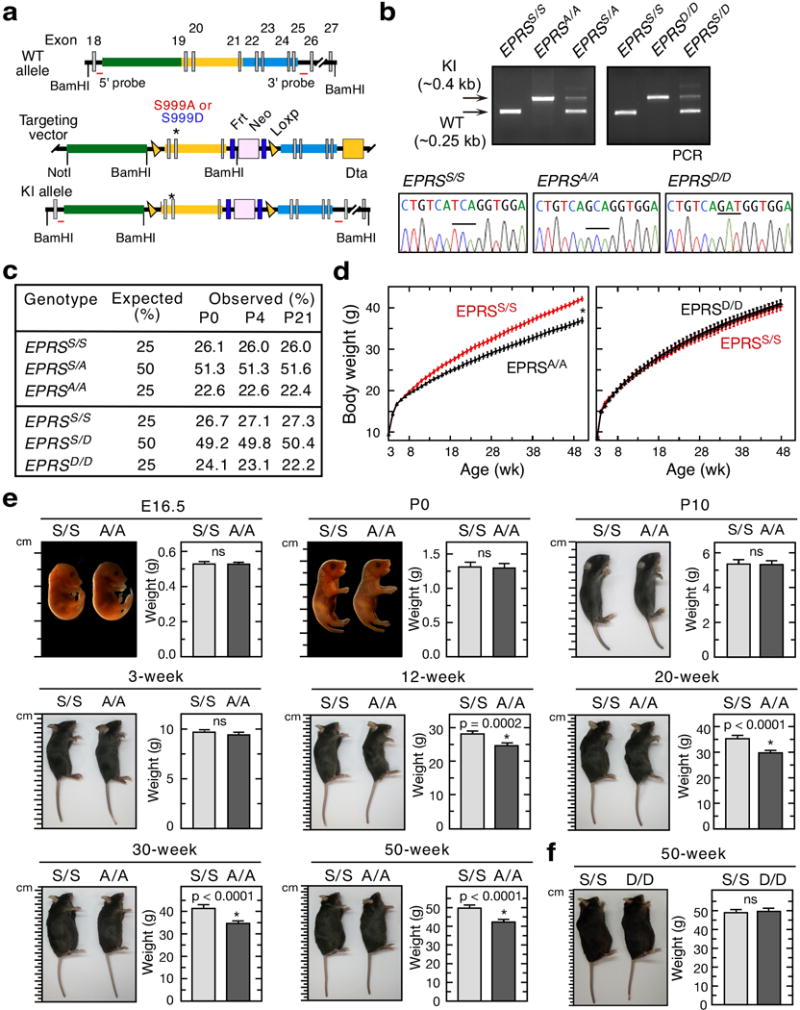
a, Knock-in mice bearing Ser999-to-Ala and -Asp mutations were generated by homologous recombination. b, Validation of wild-type (EPRSS/S) and EPRS knock-in mice by PCR genotyping (top) and sequence analysis (bottom). c, Genotype analysis of littermates. Total of 1410 and 644 progeny from interbreeding EPRSS/A and EPRSS/D mice, respectively, were used at postnatal days P0, P4, and P21. d, Growth curves of EPRSA/A (mean ± SEM, n = 10/group; P < 0.0001, 2-way ANOVA) and EPRSD/D (n = 10/group) female mice. e, Representative images (left) and weights (right) of wild-type (EPRSS/S; S/S) and EPRSA/A (A/A) mice on embryonic day E16.5 and post-embryonic development stages. Data shown are mean ± SEM; n = 11 for E16.5 embryos, n = 10 for P0 and P10 mice, and n = 14 for 3, 12, 20, 30, and 50-week mice. f, Representative images (left) and weights (right) of 50-week S/S and EPRSD/D (D/D) mice (mean ± SEM; n = 10/group).
Extended Data Figure 3. Lifespan analysis of EPRSS/S, EPRSA/A and EPRSD/D mice monitored from weaning (>21 days).
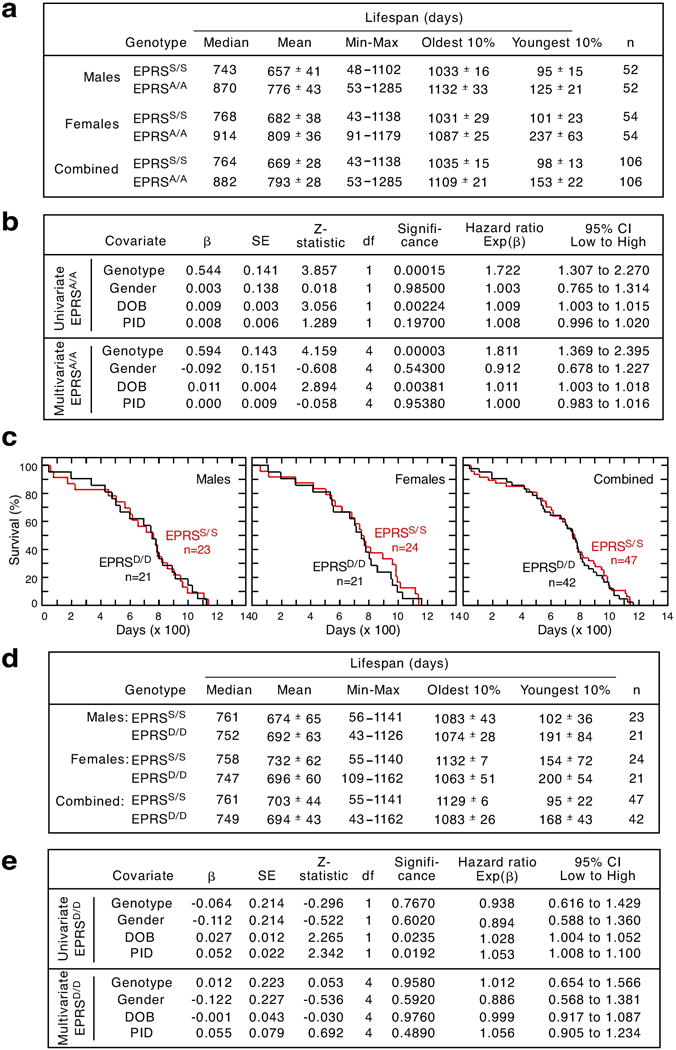
a, Youngest and oldest 10% are the mean lifespan of the shortest- and longest-living 10% mice. Numbers of days are represented to nearest full day. Median and mean ± SEM are shown. b, Cox proportional hazard (CPH) regression analyses of EPRSS/S and EPRSA/A mice shows genotype as the most significant predictor of increased longevity. Longevity relative to survival days (i.e., age at death) was analyzed in pooled mice by CPH regression model. The 4 independent variables genotype, date of birth (DOB), parental ID (PID), and gender were replaced with a set of category variables. In case of genotype and gender, category represents their presence or absence. DOB and PID data were divided into multiple categories as described in the supplementary methods. Independent variables were fitted into the CPH model individually (univariate) or simultaneously (multivariate). Shown are: β(the unstandardized regression coefficient) with standard error (SE), the degrees of freedom (df), and the significance for each model fit. Exp(β) for the covariate of interest is the predicted change in hazard ratio for a unit increase in the predictor, and its 95% confidence interval (CI). c, Kaplan-Meier survival curves show no change in lifespan of male, female, or combined EPRSD/D mice. Male (MC χ2 = 0.003, P = 0.956; GBW χ2 = 0.001, P = 0.972), female (MC χ2 = 0.158, P = 0. 0.691; GBW χ2= 0.206, P = 0.650), and gender-combined (MC χ2 = 0.079, P = 0. 0.779; GBW χ2= 0.076, P = 0.783). d and e, Survival and CPH regression analyses of EPRSS/S and EPRSD/D mice as described above in a and b.
Extended Data Figure 4. Adipose tissue deposition and lipolysis in EPRSA/A and EPRSD/D mice.
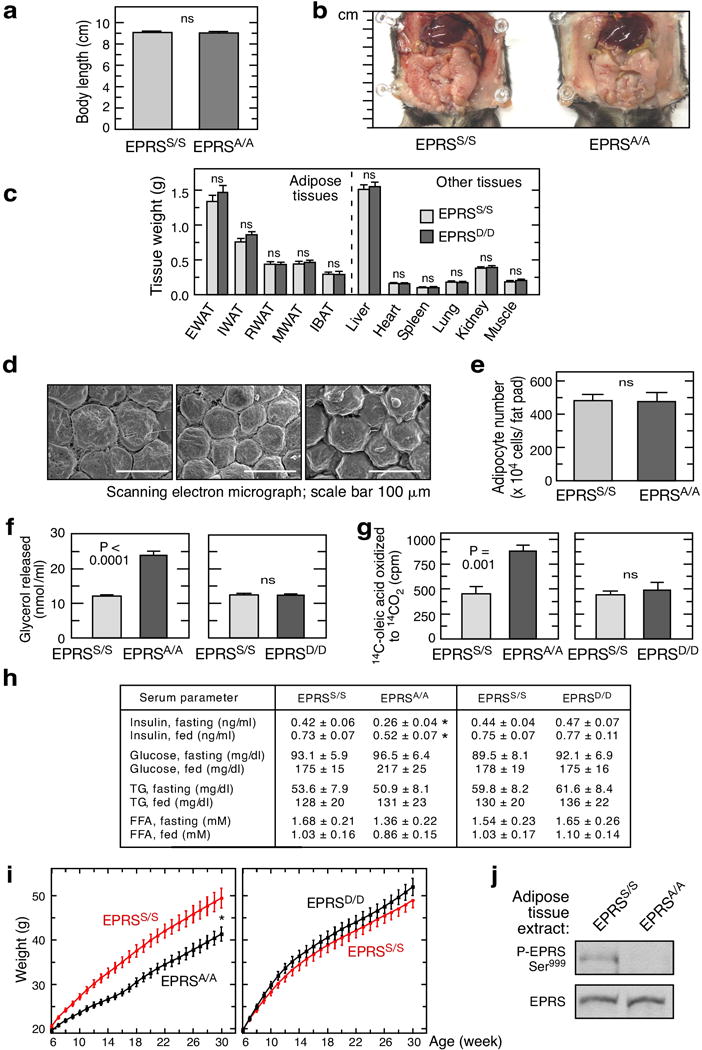
a, Length of mice was measured from head to beginning of tail using a digital caliper (Fisherbrand Traceable). Data shown are mean ± SEM, n = 15 for 20-week male mice. b, Ventral view of wild-type and EPRSA/A mice abdominal cavity. c, Weights of adipose and non-adipose tissues from 20-week male EPRSD/D and control mice (mean ± SEM, n = 14/group, P value from unpaired t-test). d, Scanning electron micrographs of EWAT in 20-week male EPRSS/S, EPRSA/A, and EPRSD/D mice. e, Total adipocyte cell number in EWAT of EPRSA/A knock-in and wild-type mice. Data represent mean ± SEM, n = 5/group. f, Elevated lipolysis in adipocytes from EPRSA/A, but not EPRSD/D, mice (mean ± SEM; n = 6/group). g, Elevated β-oxidation in WAT explants from EPRSA/A mice as determined by release of 14CO2 from 14C-oleic acid (mean ± SEM; n = 5/group). h, Serum levels of insulin, glucose, triglycerides (TG) and free fatty acids (FFA) in 12-h fasted and 1-h post-prandial (fed) 16-week old male mice (mean ± SEM, n = 10/group, *P < 0.05, unpaired t-test). i, Growth curves of EPRSA/A and EPRSD/D mice (males, n = 12/group, mean ± SEM, P < 0.001, 2-way ANOVA) started at 6 wk on an unrestricted high-fat diet (HFD, Harlan Teklad TD.06414) deriving 18, 60, and 21 kcal% from protein, fat, and carbohydrate, respectively. j, Phosphorylation of EPRS Ser999 in WAT from EPRSA/A and EPRSD/D mice after HFD feeding for 24 wk.
Extended Data Figure 5. Adiposity and lifespan of S6K1−/− mice.
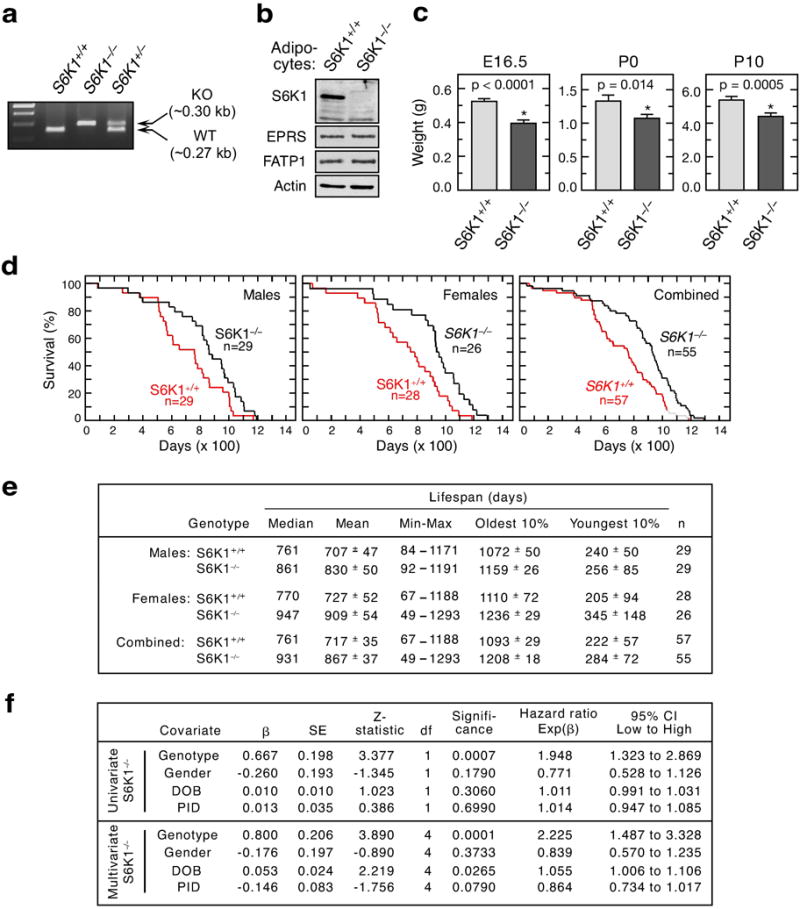
a, PCR genotyping of wild-type (S6K1+/+), heterozygous (S6K1+/–) and homozygous (S6K1−/−) mice. b, Immunoblot analysis of S6K1, EPRS, and FATP1 in S6K1−/− mice. c, Weight of S6K1−/− mice at embryonic day E16.5, and at postnatal days P0 and P10. d, Kaplan-Meier survival curves shows increased longevity in male, female or combined S6K1−/− mice. Male (n = 29/group; MC χ2 = 4.919, P = 0.027; GBW χ2 = 4.660, P = 0.031), female (n = 28 for S6K1+/+ and n = 26 for S6K1−/−; MC χ2 = 7.927, P = 0.005; GBW χ2= 7.277, P = 0.007), and gender-combined (n = 26 for S6K1+/+ and n = 55 for S6K1−/−; MC χ2 = 11.78, P = 0.0006; GBW χ2= 11.01, P = 0.0009). e and f, Lifespan and CPH regression analyses of S6K1+/+ and S6K1−/− mice as described above in Extended Data Fig. 3a,b.
Extended Data Figure 6. Glucose metabolism, food intake and fecal lipid excretion in EPRSA/A and EPRSD/D mice.
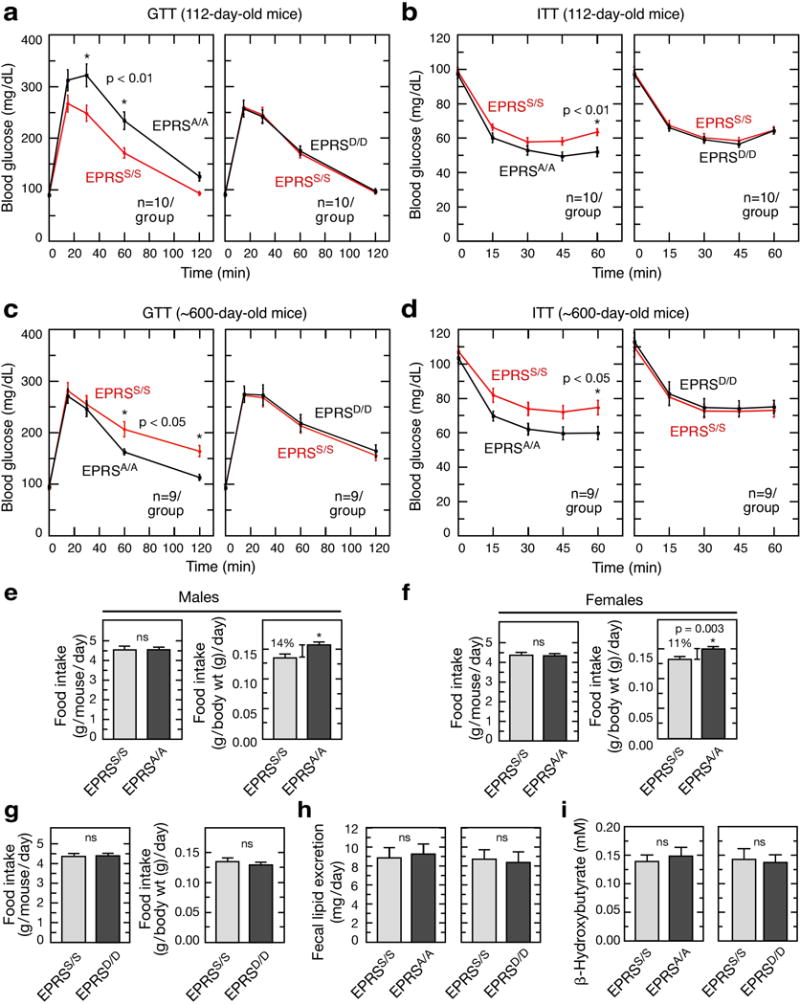
a, Glucose tolerance test (GTT) in 112-day-old EPRSS/S, EPRSA/A, and EPRSD/D mice (mean ± SEM, n = 10/group). b, Insulin tolerance test (ITT) on mice as in (a; mean ± SEM, n = 10/group). c,d, Same as a,b but using ~600-day-old mice (mean ± SEM, n = 9/group). e-g, Determination of food intake as g/mouse/day (left) or g/body weight (g)/day (right in male (e) and female (f) EPRSA/A mice, and in male EPRSD/D mice (g). All values represent mean ± SEM, n = 14/group. h, Fecal lipid excretion in EPRSS/S, EPRSA/A, and EPRSD/D mice (mean ± SEM, n = 6/group). i, Serum ketone body (β-hydroxybutyrate) level in 6-h fasted mice.
Extended Data Figure 7. Energy metabolism in EPRSA/A and EPRSD/D mice.
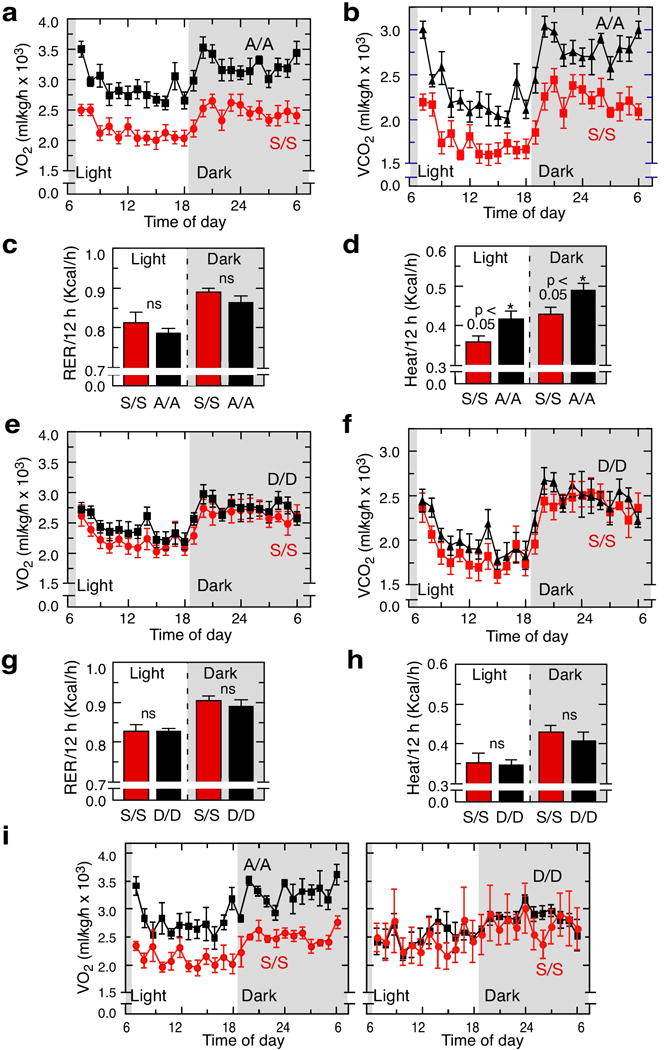
a,b, Determination of VO2 (left) and VCO2 (right) in EPRSS/S and EPRSA/A male mice over a 24-hour period. c,d, Respiratory exchange ratio (RER) (left) and heat generation (right) in 12-h light and dark cycles were determined (mean ± SEM, n = 6/group). e-h, Same as (a-d) but comparing EPRSS/S and EPRSD/D male mice (mean ± SEM, n = 6/group). i, Determination of VO2 in female EPRSS/S, EPRSA/A, and EPRSD/D mice (mean ± SEM, n = 3/group).
Extended Data Figure 8. Absence of GAIT pathway in adipocytes and inflammatory response in EPRSA/A mice.
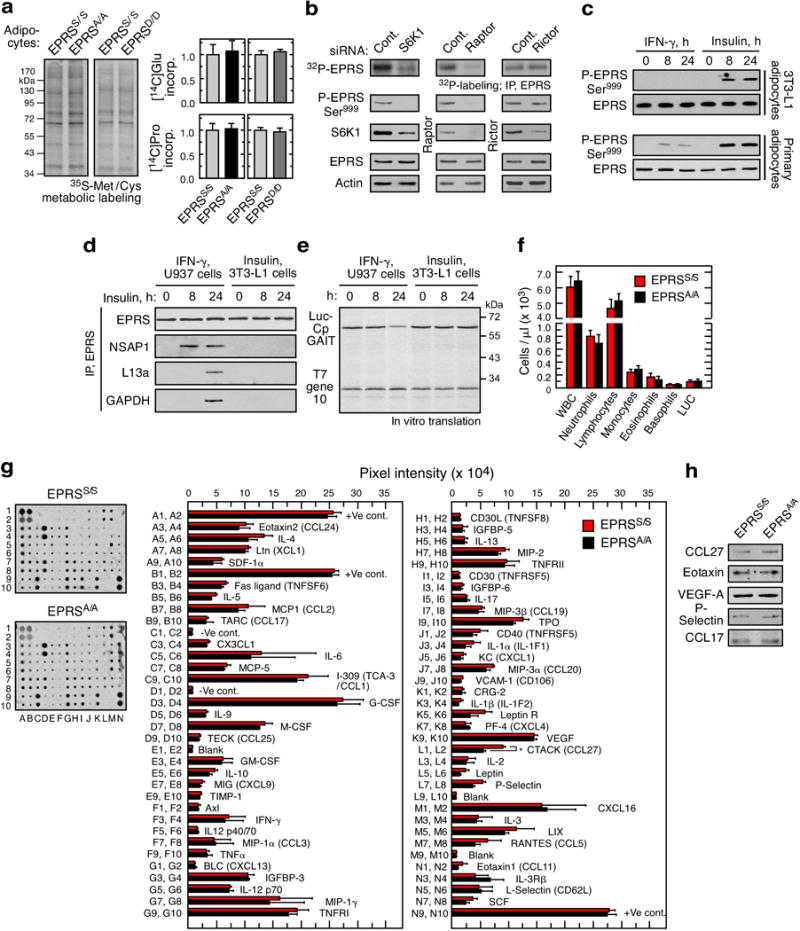
a, Total protein synthesis determined by [35S]Met/Cys labeling (left), and by incorporation of [14C]Glu and [14C]Pro into TCA-precipitated proteins in adipocytes from EPRSS/S, EPRSA/A, and EPRSD/D mice. b, Effect of siRNA-mediated knockdown of S6K1, raptor, and rictor on phosphorylation of EPRS Ser999 in differentiated mouse 3T3-L1 adipocytes in presence of 100 nM insulin. c, Effect of IFN-γ and insulin on phosphorylation of EPRS Ser999 in differentiated 3T3-L1 adipocytes or mouse primary adipocytes determined using phospho-specific EPRS antibody. d, GAIT complex formation in IFN-γ-stimulated U937 cells and insulin-stimulated 3T3-L1 adipocytes by immunoprecipitation with anti-EPRS antibody and immunoblot with antibodies against GAIT complex constituents. Cytosolic lysates from IFN-γ-treated U937 cells served as positive control. e, Determination of GAIT pathway activity in IFN-γ-stimulated U937 cells and insulin-stimulated 3T3-L1 adipocytes by in vitro translation of a control (T7 gene 10) and GAIT element bearing (Luc-ceruloplasmin (Cp) GAIT element) reporter RNAs. f, White blood cells (WBC) counts in blood from EPRSS/S and EPRSA/A mice by Advia hematology system (LUC, large unstained cells). g, Determination of cytokine levels in serum from EPRSS/S and EPRSA/A mice. Mouse cytokine antibody arrays were incubated with serum (100 μg, protein, right). Pixel intensity was determined by densitometry (right; mean ± SEM, 2 mice/group). h, Immunoblot analysis of selected cytokines in serum from EPRSS/S and EPRSA/A mice.
Extended Data Figure 9. Tissue-specificity of insulin-stimulated LCFA uptake and EPRS-FATP1 interaction.
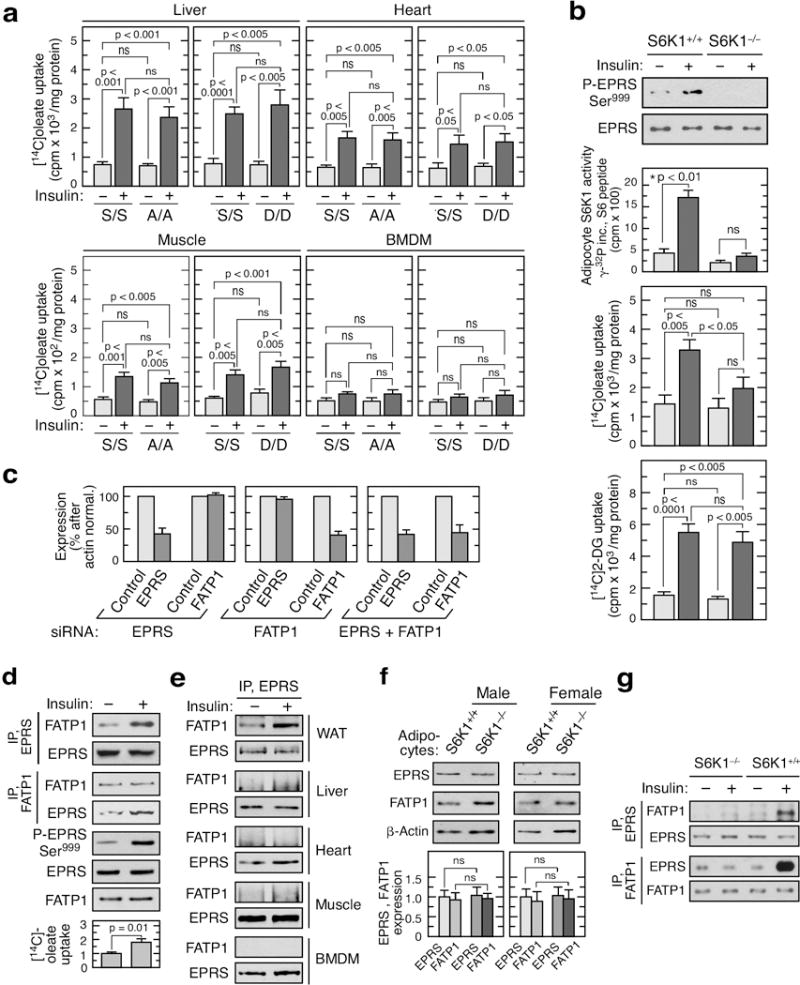
a, [14C]oleate uptake determined in insulin-stimulated hepatocytes, cardiac cells, soleus muscle strips, and BMDM from EPRSS/S, EPRSA/A, and EPRSD/D mice (mean ± SEM, n = 6 mice/group). b, Insulin-stimulated EPRS Ser999 phosphorylation (top), [14C]oleate uptake (middle), and [14C]2-deoxy-D-glucose (DG) uptake (bottom) in adipocytes from white adipose tissue of S6K1+/+ and S6K1−/− mice (mean ± SEM, n = 5 mice/group). c, Efficiency of EPRS and FATP1 knockdown in 3T3-L1 adipocytes by siRNA targeting each mRNA alone and in combination, as determined by densitometry (NIH image J) of immunoblots shown in Fig. 3g (mean ± SEM, n = 4 experiments). d, Insulin-induced EPRS Ser999 phosphorylation, interaction with FATP1, and [14C]oleate uptake in human adipocytes (mean ± SEM, n = 3 experiments in duplicate). e, Co-immunoprecipitation experiment to determine FATP1 binding to EPRS in lysates from multiple tissues as indicated. f, EPRS and FATP1 expression in male and female S6K1−/− mice (mean ± SEM, n = 3 mice/group). g, Lack of interaction of EPRS and FATP1 in insulin-stimulated adipocytes of S6K1−/− mice.
Extended Data Figure 10. Hepatic lipids and FATP1/EPRS membrane localization in EPRSA/A and EPRSD/D mice.
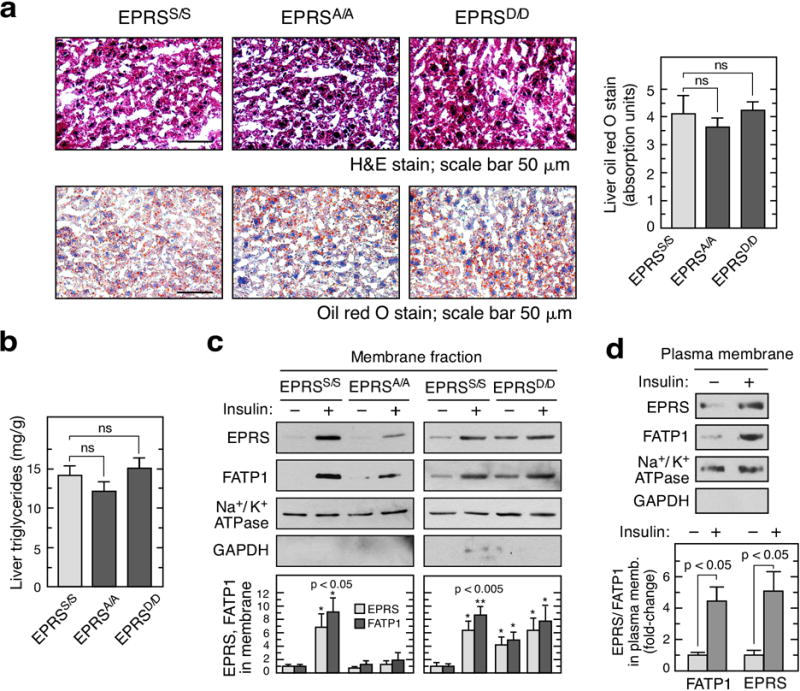
a, Optimum cutting temperature (OCT) compound-fixed liver slices from EPRSS/S, EPRSA/A, and EPRSD/D mice were stained with H&E (top) or oil red O (bottom), and the latter quantitated by densitometry (right; mean ± SEM, n = 3 mice/group). b, Determination of liver triglycerides in wild-type and mutant mice (mean ± SEM, n = 5 mice/group). c, Insulin-inducible membrane localization of EPRS and FATP1 in adipocytes from wild-type and mutant mice. d, Membrane fractionation shows EPRS and FATP1 co-localizing in plasma membrane (mean ± SEM, n = 3 experiments).
Acknowledgments
This work was supported by NIH grants P01HL029582, P01HL076491, R01GM086430, R01GM115476, and P50CA150964 (to P.L.F.), by AHA SDG 10SDG3930003 (to A.A), by CIHR fellowship (to D.H), by AHA fellowship (to K.V.), by NIH R01AR048914 and R01GM089771 (to J.C.), by Spanish Ministry BFU2012–38867 and Fundacio La Marato de TV3 #174/U/2016 grants (to S.C.K.), and by NIH R01CA158768, Spanish Ministry SAF2011-24967, and CIG European Commission PCIG10-GA-2011-304160 grants (to G.T.). We thank Pallavi Bhattaram for helpful discussion.
Footnotes
None of the material has been published or is under consideration elsewhere.
Author Contributions A.A. and P.L.F. conceived and interpreted most experiments with contributions from J.M.B., J.C., S.C.K., G.T., and X.L. A.A. performed most experiments with contributions from J.J., F.T., J.S., A.C., D.H., and K.V. A.A.P. performed longevity analysis. A.A. and P.L.F. wrote the manuscript with input from all authors.
The authors declare no competing financial interests.
References
- 1.Johnson SC, Rabinovitch PS, Kaeberlein M. mTOR is a key modulator of ageing and age-related disease. Nature. 2013;493:338–345. doi: 10.1038/nature11861. [DOI] [PMC free article] [PubMed] [Google Scholar]
- 2.Lamming DW, Sabatini DM. A Central role for mTOR in lipid homeostasis. Cell Metab. 2013;18:465–469. doi: 10.1016/j.cmet.2013.08.002. [DOI] [PMC free article] [PubMed] [Google Scholar]
- 3.Fontana L, Partridge L, Longo VD. Extending healthy life span–from yeast to humans. Science. 2010;328:321–326. doi: 10.1126/science.1172539. [DOI] [PMC free article] [PubMed] [Google Scholar]
- 4.Tumaneng K, Russell RC, Guan KL. Organ size control by Hippo and TOR pathways. Curr Biol. 2012;22:R368–379. doi: 10.1016/j.cub.2012.03.003. [DOI] [PMC free article] [PubMed] [Google Scholar]
- 5.Magnuson B, Ekim B, Fingar DC. Regulation and function of ribosomal protein S6 kinase (S6K) within mTOR signalling networks. Biochem J. 2012;441:1–21. doi: 10.1042/BJ20110892. [DOI] [PubMed] [Google Scholar]
- 6.Ruvinsky I, Meyuhas O. Ribosomal protein S6 phosphorylation: from protein synthesis to cell size. Trends Biochem Sci. 2006;31:342–348. doi: 10.1016/j.tibs.2006.04.003. [DOI] [PubMed] [Google Scholar]
- 7.Arif A, et al. Two-site phosphorylation of EPRS coordinates multimodal regulation of noncanonical translational control activity. Mol Cell. 2009;35:164–180. doi: 10.1016/j.molcel.2009.05.028. [DOI] [PMC free article] [PubMed] [Google Scholar]
- 8.Arif A, Jia J, Moodt RA, DiCorleto PE, Fox PL. Phosphorylation of glutamyl-prolyl tRNA synthetase by cyclin-dependent kinase 5 dictates transcript-selective translational control. Proc Natl Acad Sci USA. 2011;108:1415–1420. doi: 10.1073/pnas.1011275108. [DOI] [PMC free article] [PubMed] [Google Scholar]
- 9.Um SH, et al. Absence of S6K1 protects against age- and diet-induced obesity while enhancing insulin sensitivity. Nature. 2004;431:200–205. doi: 10.1038/nature02866. [DOI] [PubMed] [Google Scholar]
- 10.Selman C, et al. Ribosomal protein S6 kinase 1 signaling regulates mammalian life span. Science. 2009;326:140–144. doi: 10.1126/science.1177221. [DOI] [PMC free article] [PubMed] [Google Scholar]
- 11.Carnevalli LS, et al. S6K1 plays a critical role in early adipocyte differentiation. Dev Cell. 2010;18:763–774. doi: 10.1016/j.devcel.2010.02.018. [DOI] [PMC free article] [PubMed] [Google Scholar]
- 12.Polak P, et al. Adipose-specific knockout of raptor results in lean mice with enhanced mitochondrial respiration. Cell Metab. 2008;8:399–410. doi: 10.1016/j.cmet.2008.09.003. [DOI] [PubMed] [Google Scholar]
- 13.Wu Q, et al. FATP1 is an insulin-sensitive fatty acid transporter involved in diet-induced obesity. Mol Cell Biol. 2006;26:3455–3467. doi: 10.1128/MCB.26.9.3455-3467.2006. [DOI] [PMC free article] [PubMed] [Google Scholar]
- 14.Stahl A, Evans JG, Pattel S, Hirsch D, Lodish HF. Insulin causes fatty acid transport protein translocation and enhanced fatty acid uptake in adipocytes. Dev Cell. 2002;2:477–488. doi: 10.1016/s1534-5807(02)00143-0. [DOI] [PubMed] [Google Scholar]
- 15.Kim JK, et al. Inactivation of fatty acid transport protein 1 prevents fat-induced insulin resistance in skeletal muscle. J Clin Invest. 2004;113:756–763. doi: 10.1172/JCI18917. [DOI] [PMC free article] [PubMed] [Google Scholar]
- 16.Guo M, Yang XL, Schimmel P. New functions of aminoacyl-tRNA synthetases beyond translation. Nat Rev Mol Cell Biol. 2010;11:668–674. doi: 10.1038/nrm2956. [DOI] [PMC free article] [PubMed] [Google Scholar]
- 17.Ray PS, Fox PL. Origin and evolution of glutamyl-prolyl tRNA synthetase WHEP domains reveal evolutionary relationships within Holozoa. PLoS One. 2014;9:e98493. doi: 10.1371/journal.pone.0098493. [DOI] [PMC free article] [PubMed] [Google Scholar]
- 18.Ma XM, Blenis J. Molecular mechanisms of mTOR-mediated translational control. Nat Rev Mol Cell Biol. 2009;10:307–318. doi: 10.1038/nrm2672. [DOI] [PubMed] [Google Scholar]
- 19.Ge Y, et al. mTOR regulates skeletal muscle regeneration in vivo through kinase-dependent and kinase-independent mechanisms. Am J Physiol Cell Physiol. 2009;297:C1434–1444. doi: 10.1152/ajpcell.00248.2009. [DOI] [PMC free article] [PubMed] [Google Scholar]
- 20.Ohanna M, et al. Atrophy of S6K1(−/−) skeletal muscle cells reveals distinct mTOR effectors for cell cycle and size control. Nat Cell Biol. 2005;7:286–294. doi: 10.1038/ncb1231. [DOI] [PubMed] [Google Scholar]
- 21.Yi SA, et al. S6K1 Phosphorylation of H2B Mediates EZH2 Trimethylation of H3: A Determinant of Early Adipogenesis. Mol Cell. 2016;62:443–452. doi: 10.1016/j.molcel.2016.03.011. [DOI] [PMC free article] [PubMed] [Google Scholar]
- 22.Pende M, et al. Hypoinsulinaemia, glucose intolerance and diminished beta-cell size in S6K1-deficient mice. Nature. 2000;408:994–997. doi: 10.1038/35050135. [DOI] [PubMed] [Google Scholar]
- 23.Taniguchi CM, Emanuelli B, Kahn CR. Critical nodes in signalling pathways: insights into insulin action. Nat Rev Mol Cell Biol. 2006;7:85–96. doi: 10.1038/nrm1837. [DOI] [PubMed] [Google Scholar]
- 24.Wiczer BM, Bernlohr DA. A novel role for fatty acid transport protein 1 in the regulation of tricarboxylic acid cycle and mitochondrial function in 3T3-L1 adipocytes. J Lipid Res. 2009;50:2502–2513. doi: 10.1194/jlr.M900218-JLR200. [DOI] [PMC free article] [PubMed] [Google Scholar]
- 25.Pende M, et al. S6K1(−/−)/S6K2(−/−) mice exhibit perinatal lethality and rapamycin-sensitive 5′-terminal oligopyrimidine mRNA translation and reveal a mitogen-activated protein kinase-dependent S6 kinase pathway. Mol Cell Biol. 2004;24:3112–3124. doi: 10.1128/MCB.24.8.3112-3124.2004. [DOI] [PMC free article] [PubMed] [Google Scholar]
- 26.Ruvinsky I, et al. Mice deficient in ribosomal protein S6 phosphorylation suffer from muscle weakness that reflects a growth defect and energy deficit. PLoS One. 2009;4:e5618. doi: 10.1371/journal.pone.0005618. [DOI] [PMC free article] [PubMed] [Google Scholar]
- 27.Lin MH, Miner JH. Fatty acid transport protein 1 can compensate for fatty acid transport protein 4 in the developing mouse epidermis. J Invest Dermatol. 2015;135:462–470. doi: 10.1038/jid.2014.378. [DOI] [PMC free article] [PubMed] [Google Scholar]
- 28.Lobo S, Wiczer BM, Smith AJ, Hall AM, Bernlohr DA. Fatty acid metabolism in adipocytes: functional analysis of fatty acid transport proteins 1 and 4. J Lipid Res. 2007;48:609–620. doi: 10.1194/jlr.M600441-JLR200. [DOI] [PubMed] [Google Scholar]
- 29.Coburn CT, et al. Defective uptake and utilization of long chain fatty acids in muscle and adipose tissues of CD36 knockout mice. J Biol Chem. 2000;275:32523–32529. doi: 10.1074/jbc.M003826200. [DOI] [PubMed] [Google Scholar]
- 30.Richards MR, Harp JD, Ory DS, Schaffer JE. Fatty acid transport protein 1 and long-chain acyl coenzyme A synthetase 1 interact in adipocytes. J Lipid Res. 2006;47:665–672. doi: 10.1194/jlr.M500514-JLR200. [DOI] [PubMed] [Google Scholar]
- 31.Ray PS, Fox PL. A post-transcriptional pathway represses monocyte VEGF-A expression and angiogenic activity. EMBO J. 2007;26:3360–3372. doi: 10.1038/sj.emboj.7601774. [DOI] [PMC free article] [PubMed] [Google Scholar]
- 32.Kozma SC, et al. Active baculovirus recombinant p70s6k and p85s6k produced as a function of the infectious response. J Biol Chem. 1993;268:7134–7138. [PubMed] [Google Scholar]
- 33.Arif A, Chatterjee P, Moodt RA, Fox PL. Heterotrimeric GAIT complex drives transcript-selective translation inhibition in murine macrophages. Mol Cell Biol. 2012;32:5046–5055. doi: 10.1128/MCB.01168-12. [DOI] [PMC free article] [PubMed] [Google Scholar]
- 34.Mazumder B, et al. Regulated release of L13a from the 60S ribosomal subunit as a mechanism of transcript-specific translational control. Cell. 2003;115:187–198. doi: 10.1016/s0092-8674(03)00773-6. [DOI] [PubMed] [Google Scholar]
- 35.Sampath P, et al. Noncanonical function of glutamyl-prolyl-tRNA synthetase: gene-specific silencing of translation. Cell. 2004;119:195–208. doi: 10.1016/j.cell.2004.09.030. [DOI] [PubMed] [Google Scholar]
- 36.Wong GW, et al. Molecular, biochemical and functional characterizations of C1q/TNF family members: adipose-tissue-selective expression patterns, regulation by PPAR-gamma agonist, cysteine-mediated oligomerizations, combinatorial associations and metabolic functions. Biochem J. 2008;416:161–177. doi: 10.1042/BJ20081240. [DOI] [PMC free article] [PubMed] [Google Scholar]
- 37.Lee RG, et al. ACAT2 contributes cholesteryl esters to newly secreted VLDL, whereas LCAT adds cholesteryl ester to LDL in mice. J Lipid Res. 2005;46:1205–1212. doi: 10.1194/jlr.M500018-JLR200. [DOI] [PubMed] [Google Scholar]
- 38.Miao J, et al. Flavin-containing monooxygenase 3 as a potential player in diabetes-associated atherosclerosis. Nature Commun. 2015;6:6498. doi: 10.1038/ncomms7498. [DOI] [PMC free article] [PubMed] [Google Scholar]
- 39.Thomas G, et al. The serine hydrolase ABHD6 Is a critical regulator of the metabolic syndrome. Cell Rep. 2013;5:508–520. doi: 10.1016/j.celrep.2013.08.047. [DOI] [PMC free article] [PubMed] [Google Scholar]
- 40.Denzel MS, et al. T-cadherin is critical for adiponectin-mediated cardioprotection in mice. J Clin Invest. 2010;120:4342–4352. doi: 10.1172/JCI43464. [DOI] [PMC free article] [PubMed] [Google Scholar]
- 41.Casnellie JE. Assay of protein kinases using peptides with basic residues for phosphocellulose binding. Methods Enzymol. 1991;200:115–120. doi: 10.1016/0076-6879(91)00133-h. [DOI] [PubMed] [Google Scholar]
- 42.Kawasome H, et al. Targeted disruption of p70(s6k) defines its role in protein synthesis and rapamycin sensitivity. Proc Natl Acad Sci USA. 1998;95:5033–5038. doi: 10.1073/pnas.95.9.5033. [DOI] [PMC free article] [PubMed] [Google Scholar]
- 43.Burkholder T, Foltz C, Karlsson E, Linton CG, Smith JM. Health Evaluation of Experimental Laboratory Mice. Curr Protoc Mouse Biol. 2012;2:145–165. doi: 10.1002/9780470942390.mo110217. [DOI] [PMC free article] [PubMed] [Google Scholar]
- 44.Lee J, Ellis JM, Wolfgang MJ. Adipose fatty acid oxidation is required for thermogenesis and potentiates oxidative stress-induced inflammation. Cell Rep. 2015;10:266–279. doi: 10.1016/j.celrep.2014.12.023. [DOI] [PMC free article] [PubMed] [Google Scholar]
- 45.Folch J, Lees M, Sloane Stanley GH. A simple method for the isolation and purification of total lipides from animal tissues. J Biol Chem. 1957;226:497–509. [PubMed] [Google Scholar]
- 46.Kraus D, et al. Nicotinamide N-methyltransferase knockdown protects against diet-induced obesity. Nature. 2014;508:258–262. doi: 10.1038/nature13198. [DOI] [PMC free article] [PubMed] [Google Scholar]
- 47.Jia J, Arif A, Ray PS, Fox PL. WHEP domains direct noncanonical function of glutamyl-Prolyl tRNA synthetase in translational control of gene expression. Mol Cell. 2008;29:679–690. doi: 10.1016/j.molcel.2008.01.010. [DOI] [PMC free article] [PubMed] [Google Scholar]
- 48.Norris AW, et al. Muscle-specific PPARgamma-deficient mice develop increased adiposity and insulin resistance but respond to thiazolidinediones. J Clin Invest. 2003;112:608–618. doi: 10.1172/JCI17305. [DOI] [PMC free article] [PubMed] [Google Scholar]
- 49.Mehlem A, Hagberg CE, Muhl L, Eriksson U, Falkevall A. Imaging of neutral lipids by oil red O for analyzing the metabolic status in health and disease. Nat Protoc. 2013;8:1149–1154. doi: 10.1038/nprot.2013.055. [DOI] [PubMed] [Google Scholar]
- 50.Liao J, Sportsman R, Harris J, Stahl A. Real-time quantification of fatty acid uptake using a novel fluorescence assay. J Lipid Res. 2005;46:597–602. doi: 10.1194/jlr.D400023-JLR200. [DOI] [PubMed] [Google Scholar]
- 51.Carson SD. Chromatographic depletion of lipoproteins from plasma and recovery of apolipoproteins. Biochim Biophys Acta. 1983;750:317–321. doi: 10.1016/0005-2760(83)90034-6. [DOI] [PubMed] [Google Scholar]
- 52.Goldstein JL, Hoff HF, Ho YK, Basu SK, Brown MS. Stimulation of cholesteryl ester synthesis in macrophages by extracts of atherosclerotic human aortas and complexes of albumin/cholesteryl esters. Arteriosclerosis. 1981;1:210–226. doi: 10.1161/01.atv.1.3.210. [DOI] [PubMed] [Google Scholar]
- 53.Song EK, et al. NAADP mediates insulin-stimulated glucose uptake and insulin sensitization by PPARgamma in adipocytes. Cell Rep. 2012;2:1607–1619. doi: 10.1016/j.celrep.2012.10.018. [DOI] [PubMed] [Google Scholar]
- 54.Chiang SH, et al. Insulin-stimulated GLUT4 translocation requires the CAP-dependent activation of TC10. Nature. 2001;410:944–948. doi: 10.1038/35073608. [DOI] [PubMed] [Google Scholar]
Associated Data
This section collects any data citations, data availability statements, or supplementary materials included in this article.
Data Availability Statement
All data generated are included in the published article and in the supplementary informationfiles. Additional statistical datasets generated are available from the corresponding author upon request.


