

Abstract
Background:
Evolving immune-mediated therapeutic strategies for rheumatoid arthritis (RA) may benefit from an improved understanding of the complex role that T-cell activation plays in RA. This study assessed the potential of fluorine-18-labeled 9-β-d-arabinofuranosylguanine ([18F]F-AraG) positron emission tomography (PET) imaging to report immune activation in vivo in an adjuvant-induced arthritis (AIA) small animal model.
Methods:
Using positron emission tomography–computed tomography imaging, uptake of [18F]F-AraG in the paws of mice affected by arthritis at 6 (acute) and 20 (chronic) days following AIA induction in a single paw was assessed and compared to uptake in contralateral control paws. Fractions of T cells and B cells demonstrating markers of activation at the 2 time points were determined by flow cytometry.
Results:
Differential uptake of [18F]F-AraG was demonstrated on imaging of the affected joint when compared to control at both acute and chronic time points with corresponding changes in markers of T-cell activation observed on flow cytometry.
Conclusion:
[18F]F-AraG may serve as an imaging biomarker of T-cell activation in inflammatory arthritis. Further development of this technique is warranted and could offer a tool to explore the temporal link between activated T cells and RA as well as to monitor immune-mediated therapies for RA in clinical trials.
Keywords: animal models of disease, molecular imaging of inflammation
Introduction
Molecular imaging methods play a pivotal role in gaining a better understanding of the immunologic evolution of rheumatoid arthritis (RA) and will likely be critical to patient selection for and clinical monitoring of immune-based therapies for RA in the future. The complex roles that T cells and T-cell activation play in the development and progression of RA are not fully understood but appear to be related to the presence of autoreactive T cells (CD4+ T cell) and impaired regulatory T cells.1-4 Following infiltration of T cells into joints, cytokine and other cell signaling molecule levels increase and create an inflammatory environment that manifests in destruction of the synovial cartilage and bone with sustained autoimmunity enabled by memory T cells and T-effector cells.5-9
Understanding the relationship between T cells and the progression of RA has been instrumental in expanding the number of potential RA therapies.10,11 Rituximab, a monoclonal antibody directed against the CD20 antigen, has been used for many years in the treatment of RA in the approximate 40% of patients who do not respond to methotrexate, but its indirect role in T-cell depletion in peripheral blood in responders was only appreciated more recently.12-14 Newer therapies specifically target T cells or mediators of T-cell activation.15,16 Cytotoxic T-lymphocyte-associated antigen 4 IgG1 (CTLA4Ig) is a costimulation blocker that binds to CD80 and CD86 on antigen-presenting cells, preventing their ability to bind CD28 and thereby activate T cells.17 Rheumatoid arthritis therapeutics with other immune-modulating targets, such as antibodies to tumor necrosis factor alpha, have demonstrated the ability to decrease radiographic progression of RA.18 These newer therapeutic targets have complex and variable effects on T-cell activation, and current therapeutics aimed at any one of these targets have varying interactions with the inflammatory environment, highlighting the urgency to develop tools to both investigate relationships of immune-modulating networks in vivo and monitor the immune-based effects of therapy in patients.19-26
In vivo positron emission tomography (PET) imaging has been utilized to explore various points of the immune-mediated pathways targeted by new immunotherapeutics. Imaging targets have included PD-1/PD-L1, translocator protein, CD8+ T cells, T cell receptor (TCR)-transgenic T cells, and others.27-33 A minority of these approaches has been translated into humans.34
All aforementioned approaches are limited to directly labeling T cells or tracking TCR-transgenic T cells or T cells altered genetically or otherwise. Direct imaging of native T cells recruited in response to anti-CTLA-4 immunotherapy in a murine tumor xenograft model of colon cancer using the CD3 PET imaging agent [89Zr]-p-isothiocyanatobenzyl-deferoxamine-CD3 was only demonstrated recently by Larimer et al.35 An approach to native T-cell imaging that differentiates activated from nonactivated cells to further characterize the evolution of the immune response would significantly advance the utility of PET-based imaging of T cells and its use in evaluating inflammatory activity in diseases such as RA both before and following treatment.
Fluorine-18 labeled 9-β-d-arabinofuranosylguanine ([18F]F-AraG) is a positron-emitting guanosine analog that can be phosphorylated by salvage pathway enzymes, deoxyguanosine kinase and deoxycytidine kinase. Phosphorylated [18F]F-AraG accumulates in activated T cells, allowing imaging with PET. [18F]F-AraG, a labeled deoxyribonucleoside, accumulates in nonneoplastic activated T cells over nonactivated T cells, and its application in imaging activated T cells in graft-versus-host disease has recently been demonstrated.36,37 The aim of this feasibility study was to evaluate [18F]F-AraG imaging as a means to selectively and noninvasively assess the presence of an activated immune environment in the affected joint of an immune-mediated small animal model of arthritis, previously shown histologically to involve a mechanism of T-cell infiltration and activation.
Materials and Methods
All experiments involving animals were performed with approval of and oversight by the Institutional Animal Care and Use Committee.
Chemicals and Antibodies
Unless otherwise noted, all supplies were purchased from Sigma Aldrich (St Louis, Missouri). Fluorophore-conjugated antibodies (all purchased from BD-Pharmingen, San Diego, California) to the following murine marker epitopes (fluor and clone) were acquired: anti-CD3∊ (PE Cy7, 145-2C11), anti-CD4 (APC Cy7, GK1.5), anti-CD8 (Alexa 700, 53-6.7), anti-CD11b (APC Cy7, M1/70), anti-CD11c (PE Cy7, HL3), anti-CD19 (PE Cy7, 1D3), anti-CD44 (FITC, 1M7), anti-CD45.2 (V500, 104), anti-CD62 L (APC, MEL-14), anti-CD69 (PE, H1.2F3), anti-CD80 (FITC,16-10A1), and anti-CD86 (PE, GL1). Anti-F4/80 (e450, F4/80) was purchased from eBioscience (San Diego, California), and anti-CD25 (PE D594, PC61) was purchased from Biolegend (San Diego, California).
Preparation of the Adjuvant-Induced Arthritis Animal Model
Adjuvant-induced arthritis (AIA) was generated in the right hind paw (affected paw[AP]) of 12 BALB/C mice (25-30 g, aged 8-10 weeks) by means of a single injection of 0.4 mL/kg Freund’s complete adjuvant (CFA; Lee Laboratories, Grayson, Georgia) into the subcutaneous plantar tissue. Equal volume (≈12 μL) of sterile 0.9% sodium chloride was injected into the subcutaneous plantar tissue in the left hind paw of each animal as control (control paw[CP]).
Preparation of [18F]F-AraG
[18F]F-AraG was prepared via aromatic nucleophilic substitution from a previously published procedure.12 Using a cyclotron (PETtrace; General Electric Healthcare, Chicago, Illinois), no carrier-added [18F]fluoride ion was prepared via the 18O(p, n)18F reaction and transferred to an automated synthesis module (Neptis Perform; ORA, Philippeville, Belgium). The fully automated process provided HPLC-purified [18]F-AraG in radiochemical purities of greater than 95% (HPLC analysis) with specific activities ranging from 3 to 8 Ci/µmol (111-296 GBq/µmol) and decay-corrected radiochemical yields of 2% to 5% (total synthesis time 95 minutes).
[18F]F-AraG PET Imaging
At 6 and 20 days following preparation of the AIA model, 125-150 μCi (4.625-5.55 MBq) [18F]F-AraG was administered intravenous by tail vein injection (n = 3). Dynamic (4 × 5 minutes) whole-body μ PET-CT imaging (Siemens Inveon MicroPET/CT, Knoxville, TN USA) was performed 50 to 70 minutes following radiopharmaceutical administration. Region of interest analysis of PET images was performed over the AP, CP, and liver for each mouse at each time point.
Histopathology
Both a control and an inflamed paw were dissected, fixed, decalcified with Kristensen solution, embedded in paraffin, and sliced with a microtome for staining with hematoxylin–eosin for subsequent qualitative histologic analysis.
Flow Cytometry Analysis
Nonimaged AIA models were sacrificed at 6 (n = 4) and 20 (n = 4) days following model preparation. Each AP and CP was minced, as were all lymph nodes from AP and CP draining regions and spleens from 1 mouse each at the 6- and 20-day time points. All tissues were placed in a digestive mixture containing DNAse, fraction 4 low tryptinase collagenase (Worthington Biochemical Corp, Lakewood, New Jersey), magnesium acetate, and 4-(2-hydroxyethyl)-1-piperazineethanesulfonic acid (HEPES) buffer in Roswell Park Memorial Institute (RPMI)1640 medium supplemented with 5% calf serum for 1 hour at 37°C, after which 1/10th volume 0.5 M EDTA was added and cells were strained to remove conglomerates. Following filtration and removal of red cells by ammonium chloride buffer lysis, cells were washed and suspended in phosphate-buffered saline (PBS). Dead cell discrimination was achieved by staining the cells with violet amine reactive dye (Thermo Fisher, Carlsbad, California). Cells were washed once with PBS supplemented with 1% FBS and resuspended in PBS: FBS for every 1 × 10⁶ cells for 15 minutes. Nonspecific antibody binding sites were preblocked with 2 μL anti-CD16/32 and 0.5 μL hamster IgG for 15 minutes on ice. The cells were washed and passed through a 35-micron nylon mesh and divided into 200 µL aliquots, each containing approximately 1 × 10⁵ cells to which was added fluor-conjugated antibody (0.1-0.3 μg) for 20 minutes on ice. Cells were then washed, resuspended in PBS: FBS with 1% paraformaldehyde and events acquired on a 4 laser (407, 488, 561, 633 nm) FACSAria III flow cytometer (BD Biosciences, Palo Alto, California). Single stained and unstained controls were used to define sorting gates and to adjust fluorescence compensation. FlowJo software (Treestar, Palo Alto, California) was used postacquisition to adjust fluorescence compensation and set gating.
Lymphocytes and monocyte/macrophages were gated using FSC and SSC scatter plots. Events that excluded the violet dye and were CD45.2 positive were considered live tissue-resident leukocytes and analyzed for further expression of T, B, or macrophage markers. CD3 expression was used to identify T cells, CD19 expression to identify B cells. Macrophages were gated as CD11b-positive and CD11c-negative cells. T, B, and macrophage subsets were then further analyzed for the expression of markers in their antibody staining panels.
T, B, and macrophage subpopulations and their activation status were determined by cytometry using the following antibody combinations:
CD4+ and CD8+ T cells: antibodies to CD3, CD4, CD8, CD69, CD62 L, CD44, and CD25.
B cells: antibodies to CD19, CD69, and CD80.
Macrophages: antibodies to CD11b, CD11c, F4/80, CD80, and CD86.
Results
Imaging
Images demonstrated a visually detectable signal difference between the AP and CP in each animal, with Figure 1 demonstrating representative imaging from an animal. Compared to the CP, the AP in the AIA model demonstrated 7- to 9.5-fold greater signal in the acute phase (6-day postarthritis induction) and 1.5- to 4.5-fold greater signal in the chronic phase (20-day postarthritis induction; Figure 2).
Figure 1.
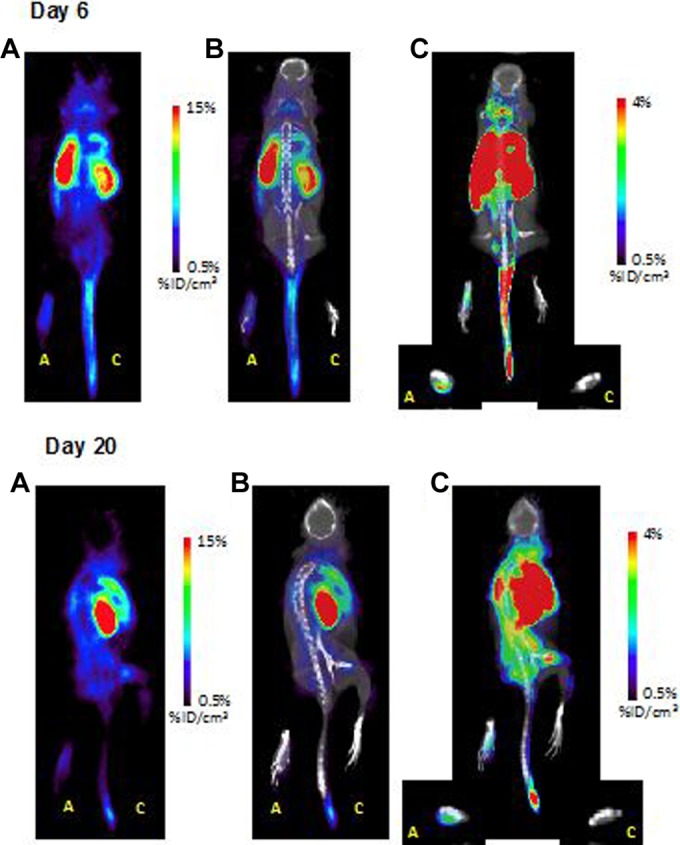
Coronal images of representative subjects at 6 days (top) and 20 days (bottom) following initial model preparation. For both time points: (A) PET image, (B) fused PET-CT image, (C) fused PET-CT image rescaled to demonstrate difference in uptake between paws. A = arthritic paw (adjuvant injection); C = control paw (saline injection). PET indicates positron emission tomography; PET-CT, positron emission tomography–computed tomography.
Figure 2.

Average percentage injected dose per volume in paws on PET images in control and affected animals and ratio of signals (affected/control) measured on days 6 and 20. PET indicates positron emission tomography.
Flow Cytometry
No significant differences were found between the percentages of counted cells that were CD4 or CD8-positive T-lymphocytes (gated as live CD45+, CD3+, CD4+, CD8+ cells) between the CPs and APs or between the 2 time points. The percentage of lymphocytes that were T cells remained constant between the 2 time points for the APs, whereas it decreased significantly between the early and late time points for the CPs (P < .001). The percentage of T cells that were CD4+ or CD8+ did not differ between CPs versus APs at either of the time points.
Indicators of T-Cell Activation
Figure 3A provides an overview of the differences in cell markers of T-cell activation between CP and AP at the time points studied. T-cell expression of CD25 differed significantly between AP and CP paws at 6 days (P < .05) but not at the 20-day time point. CD44 did not differ significantly between AP and CP paws at either time point. The percentage of CD4+ T cells that were CD69+ were significantly greater in the AP when compared to CP at the earlier time point (P < .01), but there was no significant difference found at the later time point. A higher percentage of CD4+ cells from the APs were CD69+ at the earlier time point (P < .001; Figure 3A). No significant difference was found between the APs and CPs in the percentage of CD8+ T cells that were CD69+; however, CD69 positivity of CD8+ cells decreased between the early and late time points (P < .01 for AP; P < .01 for CP; Figure 3A). CD69 mean fluorescence did not differ between CD4+ or CD8+ control and APs at either time point or within either treatment group between time points. Figure 3B provides an overview of the differences in CD62 L expressed by T cells as they go into memory phase, prior to homing to lymph nodes, indicating deactivation. Ki67 staining demonstrated greater activity of CD8+ T-effector cells in APs when compared to CPs (Figure 4).
Figure 3.


Summary of cell surface marker expression at 6 and 20 days. A, Percentages of T-cell populations expressing markers of activation including CD25 (only CD4+ cells tested), CD44 (only CD4+ cells tested at 6 days), and CD69 (both CD4+ and CD8+ cells populations tested). B, Percentages of T-cell populations expressing CD62 L marker of resting state (only CD4+ cells tested at 20 days). C, Percentage of CD4+ B-cell populations expressing markers of activation including CD19 and CD80. (*P < .05; **P < .01).
Figure 4.

Ki67 staining at day 6 demonstrates no significant difference in mean fluorescence of CD4+ cells in affected versus control paws, but greater nuclear activity in CD8+ cells (A), *P ≤ .02. Examples of Ki67 flow cytometry data from single mouse showing fluorescence of CD4+ (B) and CD8+ (C) cells from affected (red) versus control (blue) paws.
Indicators of B-Cell Activation
Figure 3C provides an overview of the differences in cell markers of B-cell activation between CP and AP at the time points studied. The percentage of CD19+ B cells, indicating facilitated B-cell receptor signaling, were significantly greater in the AP when compared to CP (P < .05) at the earlier time point. B cells from APs demonstrated a significantly higher mean fluorescence and a higher percentage of CD80 positivity (P < .001), essential for autoreactive T-cell activation, at the earlier time point versus the later time point (Figure 3C).
Indicators of Macrophage Activity
There was no significant difference in percentage of CD11b+ macrophages between CPs and APs. However, in both groups, the percentages decreased significantly between the early and late time points (P < .01 for controls, P < .01 for affected). Macrophage CD80 expression did not differ between AP and CP paws.
Lymph Nodes
A single lymph node was taken from the nodal basin draining the CP and AP in each animal, and all cells from each of the respective groups were combined into a single sample for flow cytometry. Trends in the relative CD expression levels of cells from draining nodal basins matched findings in the primary site.
Histology
Microscopy with hematoxylin–eosin stain (×200) demonstrated inflammatory cell infiltrate in cartilage of APs but not CPs (Figure 5).
Figure 5.

Hematoxylin–eosin stain (×200) demonstrating inflammatory cell infiltrate in cartilage of affected (A) versus control (B) paws at day 6. B = bone; DS = dorsal surface; I = inflammation; M = muscle; T = tendon.
Discussion
The aim of this feasibility study was to provide initial assessment of the ability of [18F]F-AraG to report the in vivo presence of an activated T-cell environment in an animal model of inflammatory arthritis using noninvasive PET imaging. A PET approach to native T-cell imaging that differentiates activated from nonactivated cells to further characterize the evolution of the immune response would significantly advance the utility of PET-based imaging of T cells and its use in evaluating inflammatory activity in diseases such as RA both before and following treatment.
The AIA animal model of inflammatory arthritis was used whereby CFA was administered into the paw of mice at the level of the ankle. Freund’s complete adjuvant is an emulsion made by combining paraffin oil containing the surfactant mannide monooleate with an aqueous suspension of heat-killed mycobacteria that serves as the antigen. Freund’s complete adjuvant generally produces transient activation and proliferation of CD4+ T cells. The mycobacterial antigenic components of CFA provide signal inducing T cells to assume a Th1 profile, manifesting in a robust delayed-type hypersensitivity reaction. Freund’s complete adjuvant induces arthritis in animal models characterized by an acute phase of inflammation around the joint, followed by a chronic phase that involves bone. This chronic arthritis is CD4+ T-cell dependent, possibly mediated by cross reaction of host T cells with mycobacterial heat shock protein (HSP) epitopes and the host’s own HSP. Freund’s complete adjuvant also generates cytokines and other signals that change rates of leukocyte proliferation and differentiation, providing an overall prolongation of the immune response.38
[18F]F-AraG PET imaging in this study demonstrated specific uptake within the AIA-injected paw (AP) when compared to the CP in the same animal at both early and late time points. This specific uptake corresponded to the presence of T-cell and B-cell epitopes indicative of T-cell activation and evidence of greater CD8+ T-effector cell activity rather than any significant difference in cell fractions of lymphocytes. The pattern of markers of T-cell activation in the AP was reflected in the lymph node region draining the AP.
Although Ki67 staining provided evidence of proliferation of CD8+ T cells in the AP but did not demonstrate CD4+ T-cell proliferation, the complementarity of measures of proliferation and flow cytometry analyses of activation antigens is well documented.39 In this study, the combination of these assays further supported the presence of an active cell–mediated immune response occurring within the AP, as indicated on [18F]F-AraG PET imaging. The time course of the T-cell activation environment observed on [18F]F-AraG PET and corroborated by flow cytometry analysis in the present study is in keeping with similar models that have demonstrated peak splenic populations of activated T cells at approximately 2 weeks following paw injection.38
The study was limited to imaging at 2 discrete time points, one chosen to reflect the molecular and cellular characteristics of “acute” inflammation and the other chosen to represent the “chronic” inflammatory environment. The rate of immune-mediated response will naturally vary between animals, and the exact constituents of the immune response likely depends somewhat on the exact site of adjuvant injection. The make-up of the cellular response at the given time points cannot, therefore, be precisely predicted and did vary across animals. Therefore, it was not surprising that not all markers of T-cell activation were significantly higher on flow cytometry analysis of cells from the joints and lymph nodes from AIA-affected paws when compared to control. Different stimuli have been shown to produce variations in the percentages of CD4+ and CD8+ T cells expressing any given activation antigen, with the variation mediated by a complex network of cytokine signals, the levels of which are also highly dependent on the stimuli and observation timing.38-41 An additional limitation of the study was the requirement to perform imaging on a cohort of animals in which AIA was induced in a similar manner at the same time point as the animals whose tissues underwent cellular analysis. In the case of radiolabeled nucleobase analogs, such as 1-(2’-deoxy-2’-[18F]fluoroarabinofuranosyl) cytosine ([18F]FAC), T cells, B cells, macrophages, and granulocytes, all demonstrate some level of accumulation of the tracer.42 [18F]F-AraG would be expected to demonstrate a similar lack of specificity for accumulation in hematogenous cell lines and would, therefore, rely on the amplification of uptake by T cells in the activated state. The inability to directly correlate levels of activated T cells with signal on PET prohibits the ability to provide direct quantitative correlation between [18F]F-AraG and number of activated T cells in the tissue. However, the reflection of an environment of activated T-cell immunity was clearly evident.
The ability to characterize the temporal and spatial evolution of inflammatory arthritis in vivo will allow improved understanding of the similarities and differences in the development of RA in patients with various genetic mutations contributing to their RA as well as the relationship of RA development with other factors such as the external environment.43-45 By detecting active inflammation in the joints or elsewhere early in patients known to be at risk for the development of RA, treatment may be able to be initiated earlier, even prior to clinical onset of disease.46,47
Conclusion
[18F]F-AraG PET provides a noninvasive means of reporting an activated immunological environment in inflammatory arthritis and appears to correspond to the presence of activated T cells. Further development of this technique in small animal models of RA is warranted and could offer a tool to further explore the temporal link between activated T cells and RA as well as to monitor immune-mediated therapies for RA in clinical trials.
Acknowledgment
The authors wish to acknowledge CellSight Technologies Inc for their insightful discussions and providing the 9-β-d-arabinofuranosylguanine for radiolabeling.
Footnotes
Declaration of Conflicting Interests: The author(s) declared the following potential conflicts of interest with respect to the research, authorship, and/or publication of this article. Two of the authors (S.G., T.L.) are employed by CellSight.
Funding: The author(s) disclosed receipt of the following financial support for the research, authorship, and/or publication of this article: This research was internally funded by investigator startup funds. CellSight Technologies Inc provided the 9-β-d-arabinofuranosylguanine substrate for radiolabeling.
References
- 1. Ostrov BE. Immunotherapeutic biologic agents in autoimmune and autoinflammatory diseases. Immunol invest. 2015;44(8):777–802. [DOI] [PubMed] [Google Scholar]
- 2. Li Y, Shen Y, Hohensinner P, et al. Deficient activity of the nuclease MRE11A induces T cell aging and promotes arthritogenic effector functions in patients with rheumatoid arthritis. Immunity. 2016;45(4):903–916. [DOI] [PMC free article] [PubMed] [Google Scholar]
- 3. Ren CF, Zhao YX, Hou CF, et al. Expression of soluble programmed death-1 protein in peripheral blood regulatory T cells and its effects on rheumatoid arthritis progression. Mol Med Rep. 2017;15(1):460–466. [DOI] [PubMed] [Google Scholar]
- 4. Mellado M, Martinez-Munoz L, Cascio G, Lucas P, Pablos JL, Rodriguez-Frade JM. T cell migration in rheumatoid arthritis. Front Immunol. 2015;6:384. [DOI] [PMC free article] [PubMed] [Google Scholar]
- 5. Ahmed MS, Bae YS. Dendritic cell-based immunotherapy for rheumatoid arthritis: from bench to bedside. Immune Netw. 2016;16(1):44–51. [DOI] [PMC free article] [PubMed] [Google Scholar]
- 6. McInnes IB, al-Mughales J, Field M, et al. The role of interleukin-15 in T-cell migration and activation in rheumatoid arthritis. Nat Med. 1996;2(2):175–182. [DOI] [PubMed] [Google Scholar]
- 7. Lebre MC, Vieira PL, Tang MW, et al. Synovial IL-21/TNF-producing CD4+ T cells induce joint destruction in rheumatoid arthritis by inducing matrix metalloproteinase production by fibroblast-like synoviocytes. J Leukoc Biol. 2017;101(3):775–783. [DOI] [PubMed] [Google Scholar]
- 8. Berard M, Tough DF. Qualitative differences between naive and memory T cells. Immunology. 2002;106(2):127–138. [DOI] [PMC free article] [PubMed] [Google Scholar]
- 9. Roeleveld DM, Koenders MI. The role of the Th17 cytokines IL-17 and IL-22 in rheumatoid arthritis pathogenesis and developments in cytokine immunotherapy. Cytokine. 2015;74(1):101–107. [DOI] [PubMed] [Google Scholar]
- 10. Cope AP. T cells in rheumatoid arthritis. Arthritis Res Ther. 2008;10(suppl 1):S1. [DOI] [PMC free article] [PubMed] [Google Scholar]
- 11. Semerano L, Minichiello E, Bessis N, Boissier MC. Novel immunotherapeutic avenues for rheumatoid arthritis. Trends Mol Med. 2016;22(3):214–229. [DOI] [PubMed] [Google Scholar]
- 12. Brown PM, Pratt AG, Isaacs JD. Mechanism of action of methotrexate in rheumatoid arthritis, and the search for biomarkers. Nat Rev Rheumatol. 2016;12(12):731–742. [DOI] [PubMed] [Google Scholar]
- 13. Cohen MD, Keystone E. Rituximab for rheumatoid arthritis. Rheumatol Ther. 2015;2(2):99–111. [DOI] [PMC free article] [PubMed] [Google Scholar]
- 14. Lavielle M, Mulleman D, Goupille P, et al. Repeated decrease of CD4+ T-cell counts in patients with rheumatoid arthritis over multiple cycles of rituximab treatment. Arthritis Res Ther. 2016;18(1):253. [DOI] [PMC free article] [PubMed] [Google Scholar]
- 15. Huang X, Wu H, Lu Q. The mechanisms and applications of T cell vaccination for autoimmune diseases: a comprehensive review. Clin Rev Allergy Immunol. 2014;47(2):219–233. [DOI] [PubMed] [Google Scholar]
- 16. Rosenthal KS, Mikecz K, Steiner HL, III, et al. Rheumatoid arthritis vaccine therapies: perspectives and lessons from therapeutic ligand epitope antigen presentation system vaccines for models of rheumatoid arthritis. Expert Rev Vaccines. 2015;14(6):891–908. [DOI] [PMC free article] [PubMed] [Google Scholar]
- 17. Kremer JM, Westhovens R, Leon M, et al. Treatment of rheumatoid arthritis by selective inhibition of T-cell activation with fusion protein CTLA4Ig. N Engl J Med. 2003;349(20):1907–1915. [DOI] [PubMed] [Google Scholar]
- 18. Deeks ED. Certolizumab Pegol: a review in inflammatory autoimmune diseases. BioDrugs. 2016;30(6):607–617. [DOI] [PubMed] [Google Scholar]
- 19. Aspalter RM, Eibl MM, Wolf HM. Regulation of TCR-mediated T cell activation by TNF-RII. J Leukoc Biol. 2003;74(4):572–582. [DOI] [PubMed] [Google Scholar]
- 20. Aspalter RM, Eibl MM, Wolf HM. Defective T-cell activation caused by impairment of the TNF receptor 2 costimulatory pathway in common variable immunodeficiency. J Allergy Clin Immunol. 2007;120(5):1193–1200. [DOI] [PubMed] [Google Scholar]
- 21. Aspalter RM, Wolf HM, Eibl MM. Chronic TNF-alpha exposure impairs TCR-signaling via TNF-RII but not TNF-RI. Cell Immunol. 2005;237(1):55–67. [DOI] [PubMed] [Google Scholar]
- 22. Monaco C, Nanchahal J, Taylor P, Feldmann M. Anti-TNF therapy: past, present and future. Int Immunol. 2015;27(1):55–62. [DOI] [PMC free article] [PubMed] [Google Scholar]
- 23. Alfonso-Cristancho R, Armstrong N, Arjunji R, et al. Comparative effectiveness of biologics for the management of rheumatoid arthritis: systematic review and network meta-analysis. Clin Rheumatol. 2017;36(1):25–34. [DOI] [PubMed] [Google Scholar]
- 24. Kim GW, Lee NR, Pi RH, et al. IL-6 inhibitors for treatment of rheumatoid arthritis: past, present, and future. Arch Pharm Res. 2015;38(5):575–584. [DOI] [PubMed] [Google Scholar]
- 25. Mitoma H, Horiuchi T, Tsukamoto H, Ueda N. Molecular mechanisms of action of anti-TNF-α agents—comparison among therapeutic TNF-α antagonists [published online August 24, 2016]. Cytokine. pii:S1043–4666(16) 30468–30469. [DOI] [PubMed] [Google Scholar]
- 26. Hodge JA, Kawabata TT, Krishnaswami S, et al. The mechanism of action of tofacitinib—an oral Janus kinase inhibitor for the treatment of rheumatoid arthritis. Clin Exp Rheumatol. 2016;34(2):318–328. [PubMed] [Google Scholar]
- 27. England CG, Ehlerding EB, Hernandez R, et al. Preclinical pharmacokinetics and biodistribution studies of 89Zr-labeled pembrolizumab. J Nucl Med. 2017;58(1):162–168. [DOI] [PMC free article] [PubMed] [Google Scholar]
- 28. Hettich M, Braun F, Bartholoma MD, Schirmbeck R, Niedermann G. High-resolution PET imaging with therapeutic antibody-based PD-1/PD-L1 checkpoint tracers. Theranostics. 2016;6(10):1629–1640. [DOI] [PMC free article] [PubMed] [Google Scholar]
- 29. Li A, Wu Y, Linnoila J, et al. Surface biotinylation of cytotoxic T lymphocytes for in vivo tracking of tumor immunotherapy in murine models. Cancer Immunol Immunother. 2016;65(12):1545–1554. [DOI] [PMC free article] [PubMed] [Google Scholar]
- 30. Mall S, Yusufi N, Wagner R, et al. Immuno-PET imaging of engineered human T cells in tumors. Cancer Res. 2016;76(14):4113–4123. [DOI] [PubMed] [Google Scholar]
- 31. Shao X, Wang X, English SJ, et al. Imaging of carrageenan-induced local inflammation and adjuvant-induced systemic arthritis with [(11)C]PBR28 PET. Nucl Med Biol. 2013;40(7):906–911. [DOI] [PMC free article] [PubMed] [Google Scholar]
- 32. Vedvyas Y, Shevlin E, Zaman M, et al. Longitudinal PET imaging demonstrates biphasic CAR T cell responses in survivors. JCI Insight. 2016;1(19):e90064. [DOI] [PMC free article] [PubMed] [Google Scholar]
- 33. Yaghoubi SS, Creusot RJ, Ray P, Fathman CG, Gambhir SS. Multimodality imaging of T-cell hybridoma trafficking in collagen-induced arthritic mice: image-based estimation of the number of cells accumulating in mouse paws. J Biomed Opt. 2007;12(6):064025. [DOI] [PubMed] [Google Scholar]
- 34. Keu KV, Witney TH, Yaghoubi S, et al. Reporter gene imaging of targeted T cell immunotherapy in recurrent glioma. Sci Transl Med. 2017;9(373). pii: eaag2196. [DOI] [PMC free article] [PubMed] [Google Scholar]
- 35. Larimer BM, Wehrenberg-Klee E, Caraballo A, Mahmood U. Quantitative CD3 PET imaging predicts tumor growth response to anti-CTLA-4 therapy. J Nucl Med. 2016;57(10):1607–1611. [DOI] [PMC free article] [PubMed] [Google Scholar]
- 36. Namavari M, Chang YF, Kusler B, Yaghoubi S, Mitchell BS, Gambhir SS. Synthesis of 2’-deoxy-2’-[18F]fluoro-9-β-D-arabinofuranosylguanine: a novel agent for imaging T-cell activation with PET. Mol Imaging Biol. 2011;13(5):812–818. [DOI] [PubMed] [Google Scholar]
- 37. Ronald JA, Kim BS, Gowrishankar G, et al. A PET imaging strategy to visualize activated T cells in acute graft-versus-host disease elicited by allogenic hematopoietic cell transplant. Cancer Res. 2017. In press. [DOI] [PMC free article] [PubMed] [Google Scholar]
- 38. Billiau A, Matthys P. Modes of action of Freund’s adjuvants in experimental models of autoimmune diseases. J Leukoc Biol. 2001;70(6):849–860. [PubMed] [Google Scholar]
- 39. Caruso A, Licenziati S, Corulli M, et al. Flow cytometric analysis of activation markers on stimulated T cells and their correlation with cell proliferation. Cytometry. 1997;27(1):71–76. [DOI] [PubMed] [Google Scholar]
- 40. Obar JJ, Molloy MJ, Jellison ER, et al. CD4+ T cell regulation of CD25 expression controls development of short-lived effector CD8+ T cells in primary and secondary responses. Proc Natl Acad Sci U S A. 2010;107(1):193–198. [DOI] [PMC free article] [PubMed] [Google Scholar]
- 41. Tao JH, Cheng M, Tang JP, Liu Q, Pan F, Li XP. Foxp3, regulatory T cell, and autoimmune diseases. Inflammation. 2017;40(1):328–339. [DOI] [PubMed] [Google Scholar]
- 42. Leung K. 1-(2’-Deoxy-2’-[18F]Fluoroarabinofuranosyl)Cytosine In: Molecular Imaging and Contrast Agent Database (MICAD). Bethesda, MD: National Center for Biotechnology Information (US); 2004. [PubMed] [Google Scholar]
- 43. Lai NS, Koo M, Yu CL, Lu MC. Immunopathogenesis of systemic lupus erythematosus and rheumatoid arthritis: the role of aberrant expression of non-coding RNAs in T cells. Clin Exp Immunol. 2017;187(3):327–336. [DOI] [PMC free article] [PubMed] [Google Scholar]
- 44. Rogier R, Koenders MI, Abdollahi-Roodsaz S. Toll-like receptor mediated modulation of T cell response by commensal intestinal microbiota as a trigger for autoimmune arthritis. J Immunol Res. 2015;2015:527696. [DOI] [PMC free article] [PubMed] [Google Scholar]
- 45. Ali AM, Vino S. Genetic markers as therapeutic target in rheumatoid arthritis: a game changer in clinical therapy. Rheumatol Int. 2016;36(11):1601–1607. [DOI] [PubMed] [Google Scholar]
- 46. Quaresma JA, Yoshikawa GT, Koyama RV, Dias GA, Fujihara S, Fuzii HT. HTLV-1, immune response and autoimmunity. Viruses. 2015;8(1). pii: E5. [DOI] [PMC free article] [PubMed] [Google Scholar]
- 47. Merlo LM, Mandik-Nayak L. IDO2: a pathogenic mediator of inflammatory autoimmunity. Clin Med Insights Pathol. 2016;9(suppl 1):21–28. [DOI] [PMC free article] [PubMed] [Google Scholar]