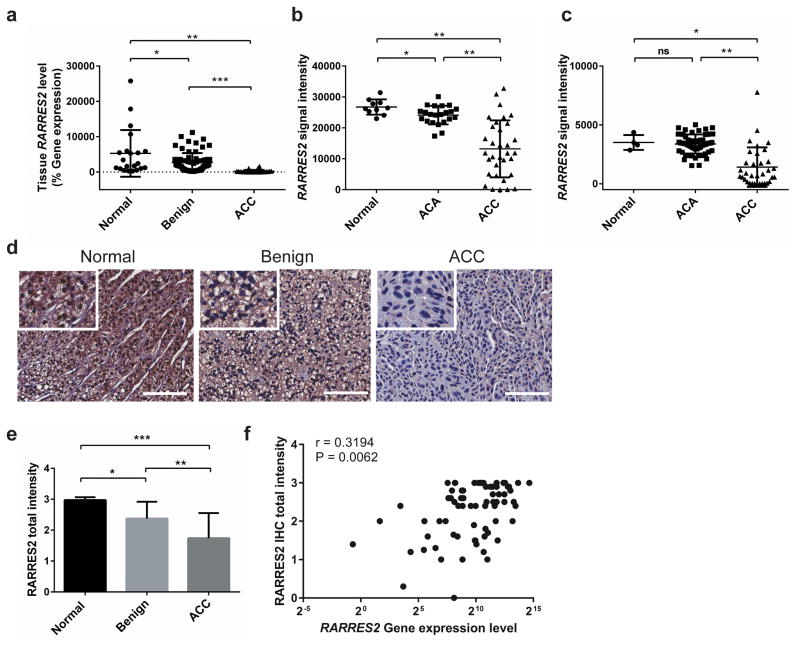
Figure 2.
RARRES2 expression is significantly downregulated in adrenocortical carcinomas. (a) TaqMan real-time qPCR result confirms RARRES2 downregulation in ACCs in our cohort of adrenocortical tissue samples. Normal, n = 21; Benign, n = 68; ACC, n = 26. *, P < 0.05; **, P < 0.0005; ***, P < 0.0001. (b) RARRES2 expression in publicly available microarray data from the GEO database (accession no. GSE10927). ACA, adrenocortical adenoma. Normal, n = 10; ACA, n = 22; ACC, n = 33. *, P < 0.05; **, P < 0.0001. (c) RARRES2 expression in publicly available microarray data from EMBL-EBI (accession no. E-TABM-311). Normal, n = 4; ACA, n = 58; ACC, n = 34. *, P < 0.05; **, P < 0.0001; ns, not significant. (a) – (c), Individual tissue samples were represented by dots. Long horizontal lines represent the means; short horizontal lines represent the SD. (d) Representative IHC staining images for RARRES2 in adrenocortical tissues. Scale bars, 100 μm. Inset, zoom in images. (e) Quantification of RARRES2 staining intensity in adrenocortical tissues. Normal, n = 10; Benign, n = 56; ACC, n = 19. Intensity scores: 0, no staining; 1, weak staining; 2, moderate staining, 3, strong staining. Total staining intensity = Σ (intensity scores × percent positivity). *, P < 0.005; **, P < 0.0005; ***, P < 0.0001. (f) Correlation between tissue RARRES2 mRNA expression level, measured by Taqman qPCR as % gene expression relative to GAPDH, and RARRES2 protein level, as scored from IHC. r, correlation coefficient. Paired RNA and tissue slides from 9 normal, 48 benign and 15 ACC tissues were analyzed.

