

Abstract
Background and Purpose
Neuroinflammation is initiated by a variety of stimuli including infections, sepsis, neurodegenerative diseases or traumatic brain injury and, if not adequately controlled, can lead to various degrees of neuronal damage and behavioural impairment. A critical event in the initial steps of inflammation is neutrophil extravasation. Semicarbazide‐sensitive amine oxidase (SSAO, also known as vascular adhesion protein 1 or VAP‐1) regulates neutrophil adhesion and extravasation. Here, we elucidate the role of SSAO/VAP‐1 in the early stage inflammatory response after LPS insult in the brain.
Experimental Approach
PXS‐4681A, a selective and irreversible SSAO/VAP‐1 inhibitor, was tested in two rat models of neuroinflammation, following systemic or i.c.v. LPS. Immunohistochemical and immunofluorescence techniques were used to measure neutrophils and microglia. VAP‐1 was quantitated by Western blotting.
Key Results
Both systemic and i.c.v. administration of LPS induced an increase in neutrophil recruitment and microglial response in various brain areas including the substantia nigra and striatum. PXS‐4681A produced a significant inhibition of neutrophil recruitment and extravasation after i.c.v. LPS injection and also reversed microglial cell recruitment and morphological changes to the level of the sham controls in both LPS models.
Conclusions and Implications
PXS‐4681A acted as an effective anti‐inflammatory agent after both systemic and i.c.v. LPS injections suggesting that SSAO/VAP‐1 inhibition could be beneficial in the treatment of brain inflammation.
Abbreviations
- BBB
blood–brain barrier
- BCA
bicinchoninic acid
- DAB
3,3′‐diaminobenzidine
- Iba‐1
ionized calcium‐binding adapter molecule 1
- MPO
myeloperoxidase
- PFA
paraformaldehyde
- RECA‐1
rat endothelial cell antibody 1
- SSAO
semicarbazide‐sensitive amine oxidase
- VAP‐1
vascular adhesion protein 1
Introduction
A number of stimuli originating in either the external environment or in peripheral organs can trigger an innate immune response in the brain. This response is characterized by the rapid activation of microglia and brain endothelial cells, expression and release of inflammatory mediators, including cytokines and chemokines, prostaglandins, free radicals, complement and adhesion molecules and subsequent leukocyte recruitment (Downes and Crack, 2010). A single systemic injection of an inflammatory stimulus, for example, LPS, is able to induce an innate immune response in the brain by directly activating microglia and endothelial cells (Zhou et al., 2006, 2009).
An important event in the LPS‐induced inflammatory response is an increase in the expression of adhesion molecules on endothelial cells. These adhesion molecules reduce the rolling speed of leukocytes, facilitating adhesion at the endothelial cell surface and, eventually, can result in extravasation from the bloodstream both peripherally and in the brain.
Semicarbazide‐sensitive amine oxidase (SSAO), also called vascular adhesion protein 1 (VAP‐1), is a membrane‐bound amine oxidase located on endothelial cells, adipocytes and smooth muscle cells, which is known to assist inflammation‐driven neutrophil influx (Salmi and Jalkanen, 1992, 1996, 2001). Studies with clinical samples have revealed that VAP‐1 is up‐regulated on the vasculature at many sites of inflammation (Salmi and Jalkanen, 2001), contributing to LPS‐induced inflammation in various organs including the brain (Ferrer et al., 2002). Besides controlling granulocyte recruitment, SSAO/VAP‐1 metabolizes primary amines, releasing aldehydes with concomitant formation of the biologically active by‐products, hydrogen peroxide and ammonia (Salmi and Jalkanen, 2001) in an enzymatic reaction that is essential for neutrophil extravasation (Tohka et al., 2001).
The mode of action of SSAO/VAP‐1 involves the binding of an as yet uncharacterized neutrophil receptor (possibly Siglec 9, Aalto et al., 2011) to the adhesion domain of the protein, followed by the enzymatic action of the amine oxidase to facilitate migration from the circulation.
LPS has been extensively used in rat and mouse models to determine the role of inflammation in neurodegeneration and behaviour. Both systemic and i.c.v. LPS induce a progressive neurodegeneration of dopaminergic neurons in the substantia nigra, suggesting a particular sensitivity of the substantia nigra to the inflammatory process and oxidative stress, whether the insult comes from within the brain or from the periphery (Liu and Hong, 2003; Qin et al., 2007; Ji et al., 2008; Zhou et al., 2012; Reinert et al., 2014).
Here, we extended the findings of previous studies, which investigated the effects of a selective inhibitor of SSAO (PXS‐4681A) in in vitro and in vivo models of lung inflammation (Foot et al., 2013), to assess its effects on an early stage inflammatory response in the brain induced by systemic or i.c.v. injections of LPS. This allowed further investigation of the relationship between neutrophil regulation and microglial activation in these models.
Methods
Animals
All animal care and experimental procedures were performed according to protocols approved by the Animal Ethics Committee of the University of Sydney, which complies with the National Health and Medical Research Council of Australia code of practice for the care and use of animals for scientific purposes. Animal studies are reported in compliance with the ARRIVE guidelines (Kilkenny et al., 2010; McGrath and Lilley, 2015). A total of 90 male Long Evans rats (350 ‐ 400 g) obtained from the Monash Animal Platform (Monash University, Australia) were used in these experiments. Animals were housed in groups of up to three per cage in a 12/12 h light/dark cycle with full access to food and water and with environmental enrichment. After treatment was completed, all animals were humanely killed by injection of pentobarbitone sodium. Animals were randomly assigned to experimental groups. There was no unplanned mortality due to the experimental procedures.
Systemic LPS
Long Evans rats were divided in three groups: Group LPS‐PXS received i.p. injections of LPS and PXS‐4681A (n = 15), Group LPS‐VEH received LPS and vehicle injections (n = 15) whereas Group SAL‐VEH received saline and vehicle injections (n = 10) (Figure 1, top, for a scheme of the experiment). Vehicle was made of saline and DMSO diluted 1:100. At time 0 h (10 mg·kg−1), 6 and 24 h (3 mg·kg−1), the animals received LPS injections, i.p. Either PXS‐4681A (2 mg·kg−1) or vehicle was administered 1 h before the first and the third injections of LPS. The saline group received 1 mL per animal of sterile saline (Figure 1, top). Thirty hours after the first LPS injection, animals were killed with pentobarbitone sodium (Lethabarb, Virbac, NSW, Australia) and transcardially perfused with 400 mL PBS at 4°C followed by 400 mL of 4% paraformaldehyde (PFA) solution. Other groups of rats SAL‐VEH and LPS‐VEH (n=6 rats per group) were killed 6 h after LPS (i.p.) for VAP‐1 quantification.
Figure 1.
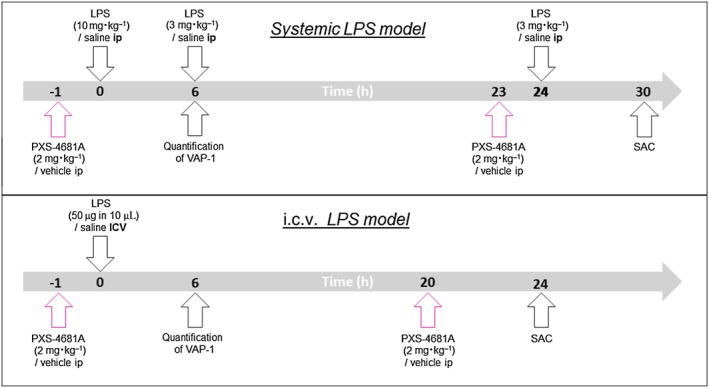
Experimental plan. (Top panel) In the systemic LPS model, rats received repeated i.p. injections of LPS at 0, 6 and 24 h with the aim of inducing a general inflammatory state both in the periphery and in the brain. PXS‐4681A (2 mg·kg−1) or vehicle was administered i.p. 1 h before the first dose of LPS and again 24 h after in order to maximize the effect of the inhibitor. At 30 h after the first dose of LPS, animals were killed to evaluate neuroinflammatory markers. (Bottom panel) In a second model, LPS was injected directly into the brain ventricles (i.c.v.) causing a more dramatic recruitment of leukocytes and microglia response compared with the systemic model. The rats received two treatments of 2 mg·kg−1 of PXS‐4681A or vehicle 1 h before LPS infusion and 20 h after. At 24 h, the rats were killed and brains were collected for histological assessment. In both models, VAP‐1 expression was quantified 6 h after i.p. or i.c.v. LPS treatment.
LPS injected i.c.v
Rats were randomly divided into three groups: Group SAL‐VEH (n = 6) received bilateral i.c.v. injections of sterile saline, whereas the other two groups, Groups LPS‐VEH (n = 10) and LPS‐PXS (n = 10), received bilateral injections of 25 μg LPS, diluted in 5 μL of saline, into the lateral ventricles. Groups SAL‐VEH and LPS‐VEH received vehicle i.p., whereas Group LPS‐PXS received PXS‐4681A i.p. (2 mg·kg−1) at time −1 h (Figure 1, bottom). Six further rats were added to groups SAL‐VEH and LPS‐VEH and were killed 6 h after LPS infusion for VAP‐1 quantification.
Rats were anaesthetized with isoflurane (5% for induction and 2–3% for maintenance) and positioned in a stereotaxic frame (Stoelting, Wood Dale, IL, USA). An incision was made to expose the scalp, and the incisor bar was adjusted to align bregma and λ on the same horizontal plane. For all rats, holes were drilled into the skull above the appropriate targeted structures according to the following coordinates: −0.8 mm posterior; ±1.5 mm lateral; and 4.3 mm ventral to bregma. Each injection of LPS was stereotaxically delivered at a rate of 0.5 μL·min−1 using a 25 μL Hamilton syringe. After each injection, the needle was left in situ for an additional 5 min to avoid reflux along the injection track. Before the start of the surgery, the animals received injections of antibiotic, Benacillin (Ilium) and of local anaesthetic Bupivicaine (Hospira) injected s.c. at the surgical site. About 5 mL of warm saline are administered at the end of the surgical procedure, as approved by the Animal Ethics Committee of the University of Sydney. Twenty hours after LPS injections, animals received a second dose of PXS‐4681A, i.p. At 24 h, animals were killed with pentobarbitone sodium and perfused transcardially with 400 mL PBS at 4°C followed by 400 mL of 4% PFA solution at 4°C. Placements of i.c.v. LPS injections were verified using Nissl staining, and animals with a misplaced injection site were excluded from further analysis. Thus, this part of the study ultimately had the following group sizes: Group SAL‐VEH (n = 6), Group LPS‐VEH (n = 8), Group LPS‐PXS (n = 8), with two animals in LPS‐VEH and two animals in LPS‐PXS groups excluded because injection sites were found misplaced. Placements of i.c.v. LPS injections for VAP‐1 quantification were assessed by investigator observation of coronal sections before tissue collection. This part of the study ultimately had the following group sizes: Group SAL‐VEH (n = 6), Group LPS‐VEH (n = 6).
Experimental procedures
Immunohistochemical procedures
Brains were fixed in 4% PFA, post‐fixed in the same fixative and cryoprotected overnight in sucrose (25%w·v−1 in PBS) before being sectioned with a cryostat microtome (Leica Microsystem). About 40 μm coronal sections were taken, and one in every six sections was stained for immunofluorescence and immunohistochemistry.
Microglia cells were stained with rabbit anti ionized calcium‐binding adapter molecule 1 (Iba‐1) antibody (1:1000, Wako, Japan). Immunostaining was visualized by using 3,3′‐diaminobenzidine (DAB) and nickel‐enhanced DAB. Extravasated and adhering neutrophils and macrophage were stained with anti‐rabbit myeloperoxidase (MPO) (1:300 Abcam, NSW, Australia), anti‐mouse rat endothelial cells antibody 1 (RECA‐1) (1:300, Serotec, UK) and anti‐goat Iba‐1 (1:1000, Abcam, NSW, Australia) and visualized by Alexa Fluor 488 (1:400, Invitrogen, Australia), Alexa Fluor 546 (1:400, Invitrogen, Australia) and Alexa Fluor 647 (1:400, Invitrogen, Australia) secondary antibodies. Sections were then mounted and coverslipped with Vectashield mounting medium with DAPI (Vector Laboratories).
Another set of brain sections were stained using anti‐rabbit MPO and anti‐RECA1 and visualized with Alexa Fluor 488 and Alexa Fluor 546 secondary antibodies. Fluorescent Nissl, far‐red NeuroTrace Fluorescent Nissl (1:500; Invitrogen, Australia) was incubated with secondary antibodies for 2 h at room temperature. Samples for total neutrophil quantification were imaged under 10× Zeiss LSM 7110 CLSM (Carl Zeiss, Germany) lens with (LSM 710, Carl Zeiss) at the maximum resolution (2048 × 2048 pixels), while samples for the quantification of extravasated neutrophils and macrophages were imaged under 20× Zeiss LSM 7110 CLSM (Carl Zeiss, Germany) lens with (LSM 710, Carl Zeiss) at the resolution 2048 × 2048 pixels.
Images were quantified using Open Source ImageJ software (MacBiophotonics upgrade version 1.43u, Wayne Rasband, National Institutes of Health, Bethesda, MD, USA).
Microglia cell reconstruction with Neurolucida software
Slides were coded and an experimenter blinded to the treatment condition performed image acquisition and data analysis with the code not broken until all analyses were complete. The single microglia cells were specifically recognized with Iba‐1 immunohistochemistry and imaged using a 100X objective with a Zeiss LSM 7110 CLSM (Carl Zeiss, Germany) throughout the entire thickness of the section. A three‐dimensional reconstruction of microglia was conducted with Neurolucida software (version 10, MicroBrightField Bioscience, Inc., Vermont, USA) using automatic reconstruction and standard settings. Trace information was then rendered into a 2D diagram of each cell (cf. Figure 4). Inclusion for analysis required that microglia were located in the substantia nigra for the systemic LPS model and in the striatum for the i.c.v. LPS model and exhibited intact microglial processes. Four or six cells per animal were randomly selected and each cell was considered independently for statistical purpose.
Cell count
Microglia
Cell counts were made at the microscope (Olympus BX50, Japan) under 10× Zeiss LSM 7110 CLSM (Carl Zeiss, Germany) lens. Boundaries of the regions of interest were created with a 10 × 10 grid reticule (1 × 1 mm) located in the right eye‐piece of the microscope such that 10 graduations of the grid were equivalent to 0.1 mm on the section. For the substantia nigra, four sections between bregma −4.80 and −6.12 mm (Paxinos and Watson, 2007) were counted, and the average for each animal was considered. A grid (1 mm (h) × 0.5 mm (w)) was aligned with the substantia nigra. For the striatum, four sections between bregma 1.08 and −1.2 mm (Paxinos and Watson, 2007) were counted, and the average for each animal was considered. A grid (1 mm (h) × 1 mm (w)) was placed on the dorsolateral part of the striatum, placing one square of the grid on the corpus callosum. In the systemic LPS model, the n per group were as follows: 15 (LPS‐PXS), 15 (LPS‐VEH) and 10 (SAL‐VEH), while in the i.c.v. LPS model, the n per group were as follows: 8 (LPS‐PXS), 8 (LPS‐VEH) and 6 (SAL‐VEH). The operator was blinded by random renumbering of the samples before the beginning of the data acquisition by a different experimenter blinded to the treatment condition, and the code was not broken until all analyses were completed.
Neutrophils
Total number of neutrophil was quantified in the three different experimental conditions in images representing an area of 1350 μm (h) × 1350 μm (w). For the substantia nigra, eight sections between bregma −4.80 and −6.12 mm and six sections between bregma 1.08 and 0.12 mm for the striatum were counted. The areas were identified by Nissl or DAPI staining. Images were randomly renumbered using a Microsoft Excel plug‐in (created by Romain Bouju, Paris, France) before cell counting was manually performed with Open Source ImageJ software (MacBiophotonics upgrade version 1.43u, Wayne Rasband, National Institutes of Health, Bethesda, MD, USA). In the systemic LPS model, the n per group were as follows: 15 (LPS‐PXS), 15 (LPS‐VEH) and 10 (SAL‐VEH), while in the i.c.v. LPS model, the n per group were as follows: 8 (LPS‐PXS), 8 (LPS‐VEH) and 6 (SAL‐VEH). Extravasated and adhering neutrophils were quantified in the three different conditions in images representing an area of 635.9 × 635.9 μm. In the systemic LPS model, the quantification was performed in the substantia nigra in three sections between bregma −4.80 and −6.12 mm. The areas were identified by DAPI, and the number of neutrophils was averaged across the three sections. A total n per group of 15 (LPS‐PXS), 15 (LPS‐VEH) and 10 (SAL‐VEH) was used. In the i.c.v. LPS model, neutrophils, pericytes and perivascular macrophages were quantified in three sections of the striatum, one correspondent to the injection site (bregma −0.8 mm) and the other two at around bregma −0.3 and −1.2 mm. Images were randomly renumbered using a Microsoft Excel plug‐in (created by Romain Bouju, Paris, France) before cell counting. Cell counting was manually performed with Open Source ImageJ software (MacBiophotonics upgrade version 1.43u, Wayne Rasband, National Institutes of Health, Bethesda, MD, USA) using cell counter plugin. A total n per group of 8 (LPS‐PXS), 8 (LPS‐VEH) and 6 (SAL‐VEH) was used.
Distinction between MPO+/Iba1− cells extravasated or adhering to the blood vessels was made according to the level of co‐localization with RECA‐1 staining. Only when cells were completely non‐overlapping with RECA‐1 staining, they were considered extravasated. When MPO staining completely or partially co‐localized with RECA‐1, the cell was considered in the adhesion state.
SSAO/VAP‐1 quantification
Cerebral microvessel isolation
Six hours after LPS or saline treatments, given either i.p. or ICV, the striatum and substantia nigra samples were collected and immediately processed for isolation of cerebral microvessels using the method of Dallaire et al. (1991) with some modifications. Extra care was taken to remove meninges and associated blood vessels, as well as ventricles and choroid plexuses before tissue collection. Briefly, striatum and substantia nigra were homogenized with a tissue grinder with a loose pestle (Wheaton, Mexico) in 4× vol of PB containing 147 mM NaCl, 4 mM KCl, 3 mM CaCl2, 1.2 mM MgCl2, 5 mM glucose, 15 mM HEPES, pH 7.4 with 10% protease inhibitor (Sigma, USA) with seven up‐and‐down strokes. Each brain was processed separately. After centrifugation at 3500 g × 10 min, the pellets were resuspended in 20% Ficoll T‐400 and homogenized by 20 up‐and‐down strokes with a loose‐fitting homogenizer at about 400 rotations min−1. After centrifugation at 25 000 g × 10 min, the myelin floating on top of the supernatant was removed. In order to form a discontinuous gradient, the pellets were resuspended in 2 mL 15% dextran T‐500 and 1.5 mL was applied on to 0.5 mL of 20% dextran T‐500 and centrifuged at 25 000 g × 10 min. The pellets were resuspended in 2 mL of PB and passed through a glass beads column. The column was then washed with 2 × 2 mL of PB. The isolated capillaries were collected by resuspension of the beads in 5 mL of PB, agitation, decantation and centrifugation at 3500 g × 10 min. The final pellet was resuspended in PB at a concentration of approximately 2 mg of protein mL−1 and stored at −80°C. Blood vessels were quantified for each sample by Western blot against RECA‐1 (1:500). No differences were observed between groups (Figure S2).
Western blot
Protein concentrations were determined using bicinchoninic acid (BCA) protein assay (Thermo Scientific) and a Bio‐Rad xMark microplate spectrophotometer. For Western blot, 20 μg protein was separated by SDS‐PAGE and transferred to Immobilon‐FL 0.45 μm PVDF membrane (Millipore) using a Bio‐Rad Trans‐Blot SD semi‐dry transfer cell. Membranes were blocked for 1 h in 5% BSA (Sigma, USA) and incubated in rabbit anti‐VAP‐1 (Abcam, Australia) diluted 1:1000 in 2% BSA overnight at 4°C. An HRP‐conjugated donkey anti‐rabbit secondary (Millipore, USA) 1:20 000 was incubated for 1 h at room temperature in 2% BSA. Mouse anti‐β‐actin monoclonal antibody (Millipore, USA) was used at 1:1000 dilution, with HRP‐conjugated goat anti‐mouse secondary (Millipore, USA) also at 1:20 000. Membranes were washed before and after being incubated in HRP‐conjugated secondaries, and HRP signal detected using Amersham ECL Plus Western Blotting Detection Reagent (GE Healthcare, Australia) and developed using Amersham Hyperfilm ECL chemiluminescent film (GE Healthcare, Australia). After VAP‐1 detection, the signal was removed with 8 min incubation at room temperature with Restore™ stripping buffer (ThermoFisher) and washed and blocked before the incubation with RECA‐1 antibody. Membrane washes were performed in Tris‐buffered saline with 0.1% Tween‐20.
Western blot images were scanned using an Epson Perfection U700 Photo scanner and quantified with Open Source ImageJ software (MacBiophotonics upgrade version 1.43u, Wayne Rasband, National Institutes of Health, Bethesda, MD, USA).
Data and statistical analysis
The data and statistical analysis comply with the recommendations on experimental design and analysis in pharmacology (Curtis et al., 2015). The data are expressed as mean ± SEM, and statistical significance was assessed using ANOVA followed by Tukey's multicomparison test and simple effects analysis. When only two groups were presented, statistical significance was assessed with t‐test. A value of P < 0.05 was considered statistically significant. All data were analysed using Prism 5 for Mac OS X, Version 5.0 (Graph Pad software).
Materials
Unless otherwise specified, chemical reagents and solvents were purchased from Sigma Aldrich (St. Louis, MO, USA). The SSAO/VAP‐1 inhibitor PXS‐4681A, [(Z)‐4‐(2‐(aminomethyl)‐3fluoroallyloxy)benzenesulfonamide hydrochloride], was synthesized by Pharmaxis Ltd, (Frenchs Forest, NSW, Australia)as described by Foot et al. (2013).
Nomenclature of targets and ligands
Key protein targets and ligands in this article are hyperlinked to corresponding entries in http://www.guidetopharmacology.org, the common portal for data from the IUPHAR/BPS Guide to PHARMACOLOGY (Southan et al., 2016), and are permanently archived in the Concise Guide to PHARMACOLOGY 2015/16 (Alexander et al., 2015a,b).
Results
Quantification of neutrophil recruitment in the systemic LPS model
Leukocyte recruitment was evaluated in systemic LPS‐induced inflammation in rats that received i.p. injections of LPS or saline and PXS‐4681A (2 mg·kg−1, dose selection based on previously published PK/PD study; Foot et al., 2013) or vehicle at different time points (refer Figure 1, top panel, for an illustration of the design of the experiment). Leukocytes were identified as MPO+ cells and were found in both substantia nigra and striatum after LPS insult. To differentiate the type of leukocyte, double staining for Iba‐1 and MPO was performed, and MPO+/Iba1− cells with a polylobate nucleus were counted as neutrophils (Figure 2A–C). RECA‐1 was used to establish the interaction of the neutrophil with blood vessels (Figure 2D–G). In well‐perfused healthy animals, very few leukocytes were present in the brain. After systemic LPS treatment, neutrophil recruitment was increased in the striatum (Figure 2H) and in the substantia nigra (Figure 2I); however, systemic LPS mostly increased the rolling and adhesion of MPO+/Iba1− cells on the endothelial cell surface, as they were mainly localized in close proximity to the blood vessels (Figure 2D–G). This increase was not significantly altered by the treatment with PXS‐4681A (Figure 2H, I).
Figure 2.
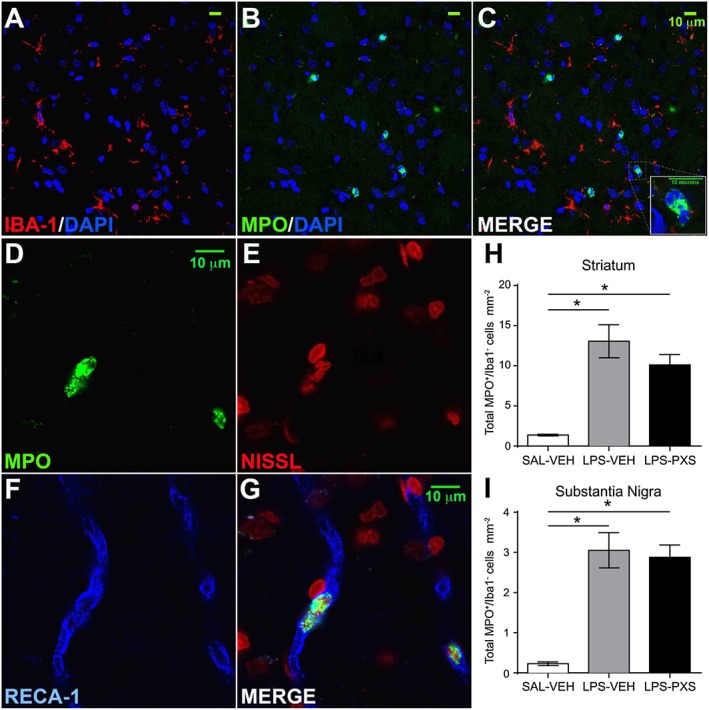
Neutrophil staining and quantification in the systemic LPS model. (A–C) Iba‐1 (red) / MPO (green) / DAPI (blue) staining to identify neutrophils and macrophages. Neutrophils are Iba‐1−, express high level of MPO and characterized by a polylobate nucleus. (D–G) MPO (green) / Nissl (red) / RECA‐1 (blue) staining to identify neutrophils and endothelial cells of the blood vessels. After systemic LPS, neutrophils were mainly localized inside the blood vessels. (H–I) Quantification of total number of MPO+/Iba‐1− cells in the striatum and in the substantia nigra. Graphs represent (left to right) a group that received saline i.p. and vehicle i.p. (SAL‐VEH), LPS i.p. and vehicle i.p. (LPS‐VEH) and LPS i.p. and PXS‐4681A i.p. (LPS‐PXS). Systemic LPS (LPS‐VEH; n = 15) increased the recruitment of MPO+/Iba‐1− cells, compared with the saline group (SAL‐VEH; n = 10). Treatment with PXS‐4681A (LPS‐PXS; n = 15) did not change neutrophil recruitment in both areas. Data represent the mean values ± SEM. *P < 0.05; one‐way ANOVA followed by Tukey's multiple comparison test.
Quantification of microglia activation in the systemic LPS model
The cells of the microglia are part of the brain immune system, responsible for regulating neuronal activity and integrity in physiological and pathological conditions, and their response to LPS, involving cell recruitment and morphological changes from resting to activated state, was also investigated. The microglial activation process has been previously described (Beynon and Walker, 2012) and was also demonstrated in the present study. Systemic LPS in Group LPS + vehicle (LPS‐VEH) increased the number of Iba‐1+ cells in the striatum (Figure 3A–D) and in the substantia nigra (Figure 3E) compared with Group saline + vehicle (SAL‐VEH). This increase was abolished in both areas by the treatment with PXS‐4681A (LPS‐PXS group in Figure 3).
Figure 3.
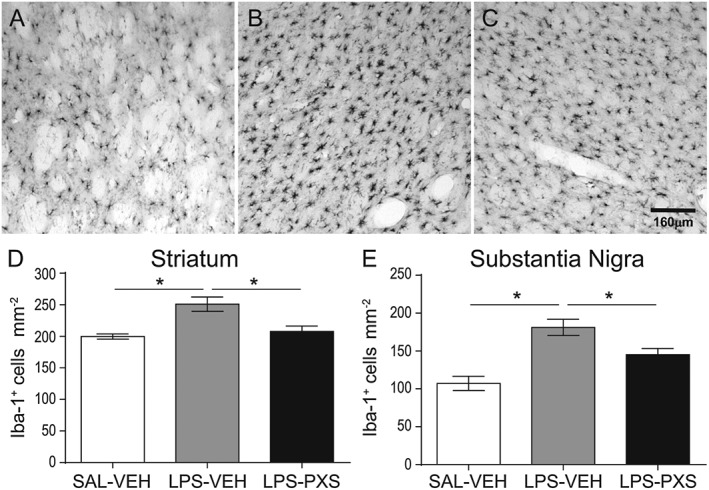
Microglia cell recruitment after systemic LPS. The micrographs represent Iba‐1+ cells in the striatum 30 h after LPS or saline i.p. first injection. Micrographs represent group SAL‐VEH (A), LPS‐VEH (B) and LPS‐PXS (C). Systemic LPS induces an increase in microglia response that is reversed by PXS‐4681A. The graphs represent microglia cell number in striatum (D) and substantia nigra (E). Graphs represent (left to right) a group that received saline i.p. and vehicle i.p. (SAL‐VEH), LPS i.p. and vehicle i.p. (LPS‐VEH) and LPS i.p. and PXS‐4681A i.p. (LPS‐PXS). Systemic LPS (LPS‐VEH; n = 15) increased Iba‐1+ cells recruitment as compared with saline group (SAL‐VEH; n = 10). PXS‐4681A (LPS‐PXS; n = 15) was able to decrease microglia cell recruitment induced by systemic LPS. Data represent mean values ± SEM. *P < 0.05, significantly different as indicated; one‐way ANOVA followed by Tukey's multiple comparison test.
Morphological changes of microglia were quantified by single cell reconstruction using Neurolucida software (version 10, MicroBrightField Bioscience, Inc., Vermont, USA) with automatic reconstruction and standard settings (Hinwood et al., 2013). Trace information was rendered into a 2D diagram of each cell (cf. Figure 4). NeuroExplorer software (MBF Biosciences, VT, USA) was used to generate metric analyses of reconstructed microglia. Cells were collected in the substantia nigra as one of the areas richest in microglia as well as being sensitive to systemic LPS (Lawson et al., 1990; Qin et al., 2007).
Figure 4.
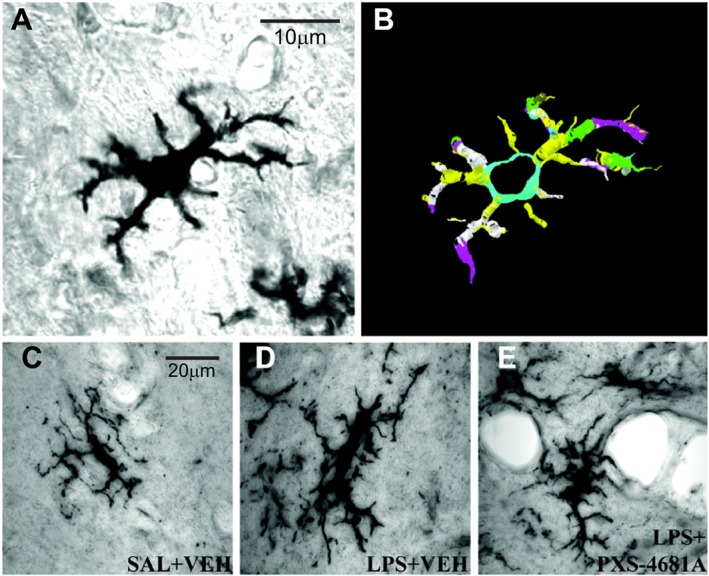
Morphological differences of microglia cells between the groups and three‐dimensional digital reconstruction with Neurolucida software. (A) Original ramified Iba‐1‐labelled microglial cells at 100× (objective lens); (B) automatic reconstruction of the cell conducted in Neurolucida; (C–E) morphological differences of microglia cells between the groups. Micrographs represent respectively SAL + VEH (C), LPS + VEH (D) and LPS + PXS‐4681A (E) groups. LPS increased cell and soma sizes as well as length and volume of cell processes. Thirty hours after systemic LPS treatments, microglia were mostly in the early activation state with process extension and reorientation towards blood vessels. PXS‐4681A was able to restore microglia phenotype to control level. Scale bars are 20 μm.
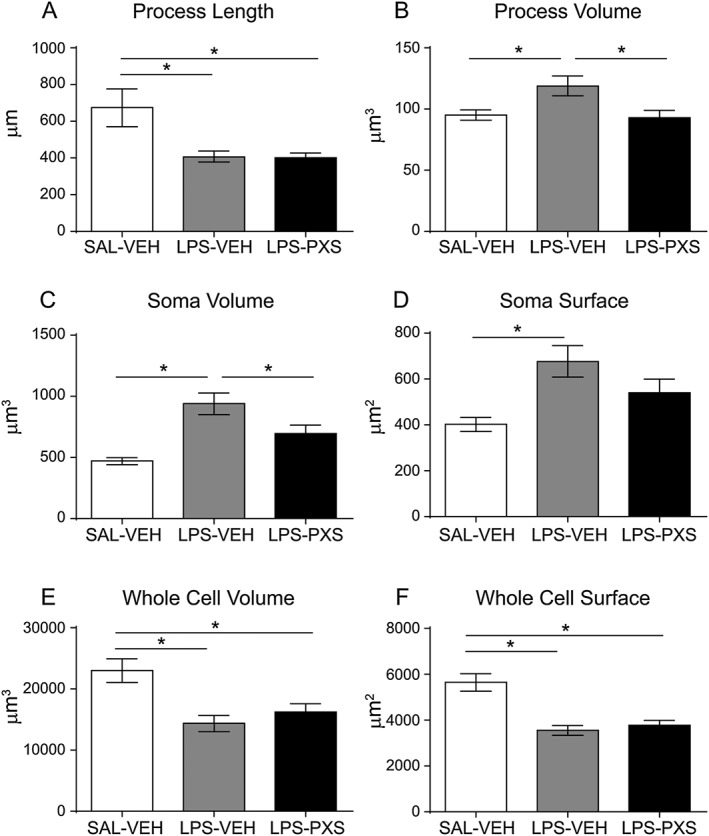
Microglia responded to systemic LPS insult by increasing whole cell, soma and process sizes (Figure 5B–F) characteristic of an early activation state (Stence et al., 2001). PXS‐4681A reduced this activation, decreasing the volume of processes (Figure 5B), the soma surface (Figure 5D) and whole cell volume (Figure 5E).
Figure 5.
Microglia processes and soma characterization with Neurolucida. The graphs represent length (A) and volume (B) of microglia processes, volume (C) and surface (D) of the soma and, lastly, volume (E) and surface (F) of the whole cell for each microglia cell. Systemic LPS (LPS‐VEH; n = 60 cells) increased cell and soma sizes as well as the volume of cell processes as compared with saline group (SAL‐VEH; n = 40 cells). PXS‐4681A (LPS‐PXS; n = 60 cells) was able to inhibit the morphological changes induced by LPS, decreasing the volume of the processes and of the whole cell as compared with LPS‐VEH group. Data represent mean values ± SEM. *P < 0.05, significantly different as indicated; ANOVA followed by Tukey's multiple comparison test.
Quantification of neutrophil and microglia in the i.c.v. LPS model
Although systemic LPS is unable to cross the blood–brain barrier (BBB), endothelial cells of the BBB can stimulate the rolling and adhesion of leukocytes in the CNS vessels (Zhou et al., 2009). However, endothelial activation is not sufficient to allow neutrophil transmigration into CNS parenchyma. In contrast, when LPS is applied to the ventricles, the BBB does not limit LPS action (Korytko and Boje, 1996; Tsushima and Mori, 2000), and the major mediator of leukocyte recruitment is microglia, which induce a robust neutrophil recruitment and extravasation within the brain tissue (Zhou et al., 2006). Thus, systemic and i.c.v. LPS represent two different models of leukocyte recruitment: the first induces an increase in leukocyte adhesion to the blood vessels driven by extracerebral conditions, resulting in the early activation of microglia, whereas the latter represents the response to a local cerebral inflammation within brain tissue (Zhou et al., 2006; Fan et al., 2005). Consistent with this suggestion, i.c.v. LPS induced a much greater extravasation of MPO+/Iba1− granulocytes into the parenchyma: we found that around 30% of neutrophils in the striatum and 18% in the substantia nigra were localized outside the blood vessels (thus considered extravasated), while systemic LPS induced an increase in adhering cells, with very few cells found outside the blood vessels (Figure 6A–E). The SSAO inhibitor interfered with both adhesion and extravasation of MPO+/Iba1− cells in both substantia nigra and striatum (Figure 6F–G).
Figure 6.
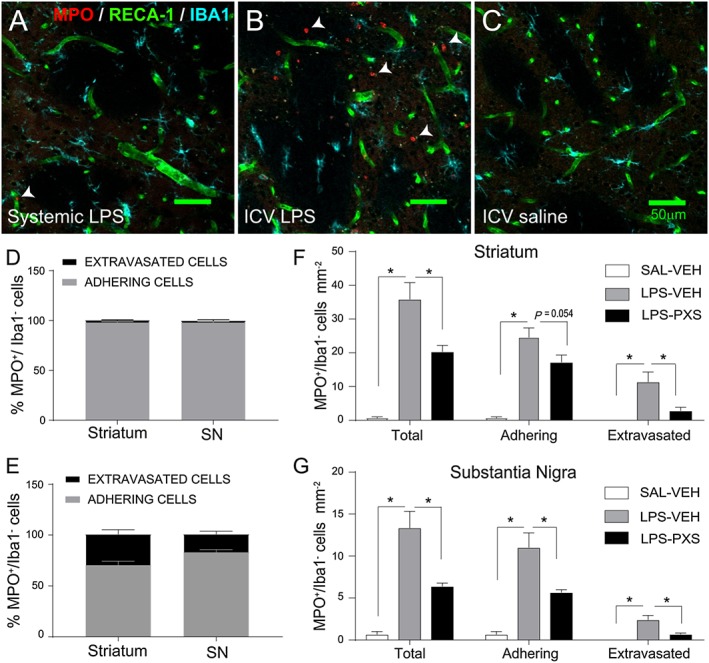
Neutrophil recruitment in the systemic and i.c.v. LPS models. Differences in neutrophil recruitment in the striatum after (A) systemic LPS, (B) i.c.v. LPS and (C) i.c.v. saline. Systemic LPS increased neutrophil recruitment compared with the saline group but did not induce any extravasation in the brain parenchyma [MPO+/Iba1− cells – examples indicated by white arrows – were localized only within the endothelial cell RECA‐1+ (A)]. i.c.v. LPS dramatically increased neutrophil recruitment when compared with systemic LPS and saline: leukocytes extravasate at 24 h after the endotoxin insult [MPO+/Iba1− cells were localized within and outside the endothelial cell RECA‐1+ (B)]. Percentage of adhesion and extravasation of MPO+/Iba1− cells in systemic LPS (D) and i.c.v. LPS (E) models in striatum and substantia nigra (SN). Systemic LPS did not induce neutrophil extravasation when compared with i.c.v. LPS. (F–G) Quantification of neutrophil cells after i.c.v. LPS in the striatum and SN. Graphs represent (left to right) the group that received i.c.v. saline and vehicle i.p. (SAL‐VEH; n = 6), i.c.v. LPS and vehicle i.p. (LPS‐VEH; n = 8) and i.c.v. LPS and PXS‐4681A i.p. (LPS‐PXS; n = 8). i.c.v. LPS increased the number of neutrophils adhering to the blood vessels and extravasating in the tissue in both areas when compared with the saline group. SSAO/VAP‐1 activity was shown to be crucial in eliciting the neutrophilic inflammatory response: PXS‐4681A (LPS‐PXS; n = 8) decreased neutrophil infiltration as compared with LPS‐VEH group in the striatum (F) and interfere with the adhesion process in the substantia nigra (G). Data represent mean values ± SEM. *P < 0.05, significantly different as indicated; two‐way ANOVA followed by simple effect analysis with t‐test.
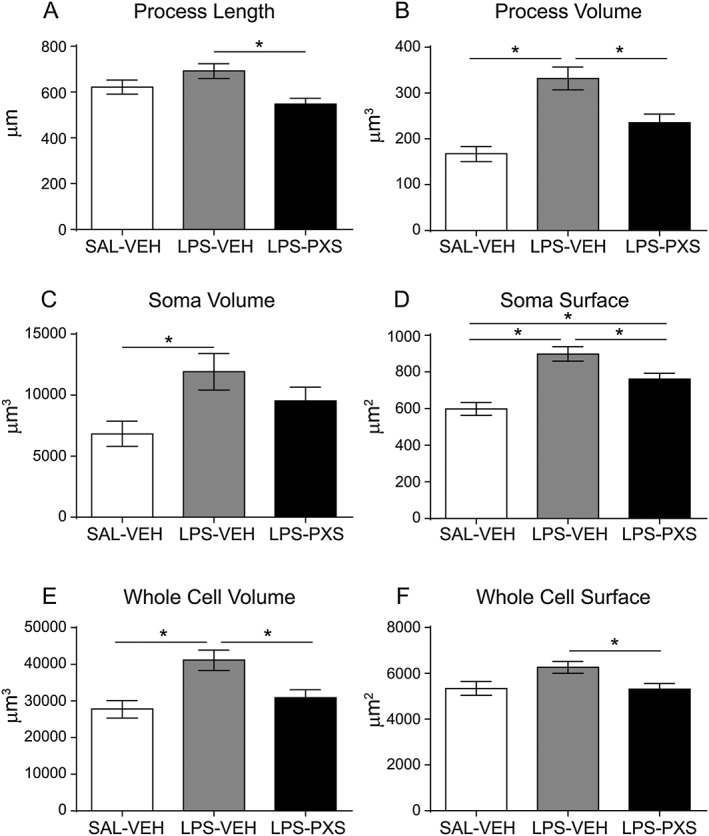
Microglia recruitment was also examined in the striatum and in the substantia nigra after i.c.v. LPS injection. LPS treatment increased microglia cell number compared with the control group (LPS‐VEH vs. SAL‐VEH, Figures 7), and PXS‐4681A significantly decreased the microglia cell number induced by LPS treatment in the striatum (Figure 7A) but not in the substantia nigra (Figure 7B). Morphological changes in microglia were quantified by single cell reconstruction using Neurolucida software in the same manner as in the systemic LPS experiment. Given the coordinates of the LPS injections into the brain ventricles, cells of the posterior dorsal striatum were chosen for the analysis because of their close proximity to the LPS injection sites. After i.c.v. LPS, microglia responded by dramatically changing their morphology, decreasing whole cell volume and surface and process length, whereas the soma and process size increased (Figure 8A–F). All these changes are the characteristic of reactive cells (Beynon and Walker, 2012). The inhibition of SSAO/VAP‐1 was able to reduce microglia activation, decreasing the volume of processes (Figure 8B) and of the soma (Figure 8C).
Figure 7.
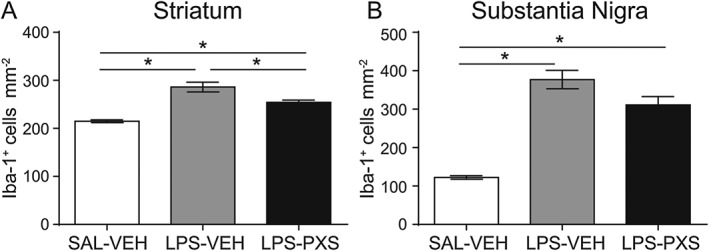
Microglia cell count in i.c.v. LPS model. Microglia responded to the i.c.v. inflammatory stimulus increasing in cells number in both striatum (A) and substantia nigra (B). Graphs represent (left to right) the group that received i.c.v. saline and vehicle i.p. (SAL‐VEH; n = 6), i.c.v. LPS and vehicle i.p. (LPS‐VEH; n = 8) and i.c.v. LPS and PXS‐4681A i.p. (LPS‐PXS; n = 8). i.c.v. LPS induced an increase in cell number in both areas, and SSAO/VAP‐1 inhibition decreased this increase in the striatum (A) but did not significantly change the LPS‐induce increase in the substantia nigra (B). Data represent average ± SEM. *P < 0.05, significantly different as indicated; one‐way ANOVA followed by Tukey's multiple comparison test.
Figure 8.
Microglia morphological quantification in the i.c.v. LPS model. The graphs represent the following: (A) length and (B) volume of microglia processes; (C) volume and (D) surface of the soma; and, lastly, (E) volume and (F) surface of the whole cell for each microglia cell in the striatum. Graphs represent (left to right) the group that received i.c.v. saline and vehicle i.p. (SAL‐VEH, n = 36 cells), i.c.v. LPS and vehicle i.p. (LPS‐VEH; n = 48 cells) and i.c.v. LPS and PXS‐4681A i.p. (LPS‐PXS; n = 48 cells). Despite there was no effect on process length, PXS‐4681A was able to decrease process volume (B) as well as soma volume (C) of microglia. Data represent mean values ± SEM. *P < 0.05, significantly different as indicated; ANOVA followed by Tukey's multiple comparison test.
Blood‐derived macrophage has been shown to infiltrate the tissue 24 h after an intracerebral injection of LPS (Ji et al., 2007). To establish whether the increase in microglia cell number was caused by monocytes infiltration after that point, we quantified Iba‐1+ cells after both systemic and i.c.v. LPS injections. Currently, a single, specific marker for microglia that can distinguish them from macrophages has not been described, with the exception of the scanning electron microscopy (Giulian et al., 1995). As a consequence, we were unable to distinguish microglia and macrophage on the base on their morphology and immunophenotype. Only perivascular macrophages and pericytes were recognized for their amoeboid form, a size of about 20 μm, monolobate nucleus, the expression of Iba‐1 marker and their localization around blood vessels. Injection of LPS, systematically or through the cerebral ventricles, did not induce any increase in perivascular macrophage and pericytes, and treatment with the SSAO/VAP‐1 inhibitor did not affect their population number (Figure S1).
Quantification of VAP‐1 regulation in cerebral microvessels after LPS
As the two LPS models elicited different inflammatory responses based on neutrophils and microglia, there could be a different involvement of VAP‐1 in the two inflammatory models. Thus, we quantified VAP‐1 regulation after systemic and i.c.v. LPS as compared with corresponding saline groups. Six hours after LPS/saline was infused i.c.v. or administered i.p., cerebral microvessels were extracted for striatum and substantia nigra. Collection of samples was performed to avoid contamination of ventricles and meninges, particularly rich in VAP‐1. Western blot analysis, using a polyclonal anti‐SSAO antibody, revealed the presence of an immunoreactive band of 95 kDa in brain extracts in both saline‐ and LPS‐treated animals, corresponding to the molecular weight of the subunit of membrane‐bound SSAO. We found that VAP‐1 was up‐regulated after i.c.v. LPS as compared with the saline group but not after systemic LPS (Figure 9), confirming VAP‐1 plays a role in regulating neutrophil recruitment only after i.c.v. LPS and not after systemic LPS. Quantification of RECA‐1 protein in each sample showed that the content of microvessels was comparable across animals (Figure S2).
Figure 9.
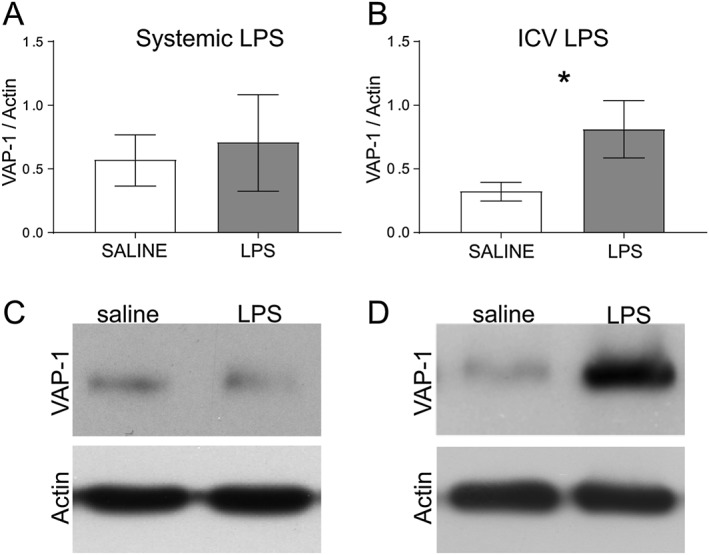
VAP‐1 quantification in brain microvessels after (A, C) systemic LPS (n = 6) and (B, D) i.c.v. LPS (n = 6). Data represents means ± SEM. *P < 0.05, significantly different from saline; t‐test.
Discussion
Many animal models of acute and chronic inflammation, whether through the use of an anti‐VAP‐1 antibody (Merinen et al., 2005), low MW inhibitors (Salter‐Cid et al., 2005) or gene‐deleted animals (Stolen et al., 2005), have demonstrated the role of SSAO/VAP‐1 in leukocyte trafficking, but few of these studies have attempted to define SSAO/VAP‐1‐ mediated leukocyte recruitment into the brain.
LPS, a well‐known pro‐inflammatory agent, was used in this study to stimulate the leukocyte and microglia response in the brain. Although systemic LPS is unable to cross the BBB (Banks and Robinson, 2010), endothelial cells express all the machinery necessary to detect LPS, including TLR4 and CD14 (Andonegui et al., 2002; Zhou et al., 2009). After LPS treatment, the endothelium up‐regulates adhesion molecules that allow leukocytes to roll and to establish contacts with integrins expressed on leukocytes (Zhou et al., 2009). The interaction between integrins and adhesion molecules permits firm adhesion of the leukocyte, which consequently allows the leukocyte to emigrate to the surrounding tissue. SSAO/VAP‐1 is well distributed in all organs; it is expressed on the surface of endothelial cells including those of the BBB (Ferrer et al., 2002; Hernandez‐Guillamon et al., 2012) exposing the catalytic domain in the extracellular space. Up‐regulation of this protein occurs 6–8 h after an inflammatory stimulus (Salmi and Jalkanen, 2001) and results in an increase in the adhesion and extravasation of leukocytes in the CNS. As reported by Castillo et al. (1998), SSAO/VAP‐1 is absent from the brain parenchyma and only expressed on the brain blood vessels and in meninges. In the present study, we showed that systemic LPS was able to increase leukocyte adhering and rolling on the blood vessels in the brain, although very few were observed inside the parenchyma. Conversely, when LPS was applied in the ventricles instead of systemically, the BBB did not limit LPS action, and the major type of leukocyte invading the brain was found to be neutrophils. The different response in terms of neutrophil recruitment can be explained by different involvement of VAP‐1 in the two animal models. Only when given i.c.v. did LPS induce an up‐regulation of VAP‐1 adhesion molecules on the BBB in the areas investigated, while systemic LPS did not affect VAP‐1 expression.
We analysed the role of SSAO/VAP‐1 in the basal ganglia because of its particular sensitivity to inflammatory changes. The substantia nigra and striatum are areas rich in delicate dopaminergic neurons, which are particularly sensitive to inflammatory changes, and prone to die after neutrophil invasion (Ji et al., 2008). As a consequence, both systemic and i.c.v. LPS induce neuronal loss. at long times after its administration (Qin et al., 2007; Zhou et al., 2012), and therefore, using these models, we wanted to establish whether the inhibition of SSAO/VAP‐1 at an early stage had any effects on the inflammatory cascade, which can possibly lead to neuronal death.
PXS‐4681A, an SSAO/VAP‐1 inhibitor, was given immediately prior to the initial LPS injection, showing an inhibitory effect of PXS‐4681A on neutrophil adhesion and extravasation after i.c.v. LPS stimulation, but did not affect total number of neutrophils after systemic LPS. This discrepancy between the two responses can most likely be attributed to differences in cell activation and VAP‐1 regulation, induced by LPS, in the two models (Zhou et al., 2006; Zhou et al., 2009). Systemic LPS does not directly activate microglia but does lead to neutrophil patrolling on the BBB by direct activation of cerebral endothelial cells (Zhou et al., 2009). Neutrophil infiltration requires an up‐regulation of cytokines inside the brain parenchyma, such as an increase in TNF‐α, as has been reported after i.c.v., but not systemic, LPS (Zhou et al., 2006; Zhou et al., 2009). In the proposed mechanism, an increase of intracerebral cytokines up‐regulates SSAO/VAP‐1 and is followed by an increase in SSAO/VAP‐1‐dependent neutrophil extravasation (Abella et al., 2004; García‐Vicente et al., 2005). SSAO/VAP‐1‐specific inhibition failed to modulate neutrophil adhesion in the systemic LPS model, arguably because SSAO/VAP‐1 is not changed by systemic LPS and the adhesion protein is more relevant for transmigration of the leukocyte inside the tissue, while leukocyte rolling is mediated mainly by endothelial P‐ and E‐selectins. The expression on brain microvessels of these selectins, in turn, was shown to be promoted by systemic TNF‐α and LPS (Carvalho‐Tavares et al., 2000; Zhou et al., 2009). Therefore, it is plausible that P‐selectins are mainly involved in mediating the rolling and adhering of neutrophil on the BBB after systemic LPS (Zhou et al., 2009).
Systemic LPS acts on endothelial cells increasing the levels of IL‐1β in the blood and in the brain parenchyma (Zhou et al., 2009), which in turn can activate microglia. SSAO/VAP‐1 inhibition affected microglia response: as microglia and macrophages do not interact with VAP‐1 (Kivi et al., 2009), we speculate that the decreased response is not a direct inhibitory effect but a result of a decreased peripheral inflammatory response. Foot et al. (2013) showed that SSAO/VAP‐1 inhibition decreased neutrophil trafficking and the release of TNF‐α and IL‐6 in the lungs in a LPS‐induced lung inflammatory model. Therefore, in the mechanism we are postulating after systemic LPS, the primary response mediated by SSAO/VAP‐1 is the reduction of neutrophil trafficking at the periphery, with a concomitant decreased release of cytokines, chemokines and pro‐inflammatory mediators in the blood‐stream, which subsequently activate the BBB (Zhou et al., 2009) or directly modulate microglial response in the brain (Figure 10). Alteration of peripheral immune activity can, in fact, affect the brain immune system (Quan and Banks, 2007).
Figure 10.
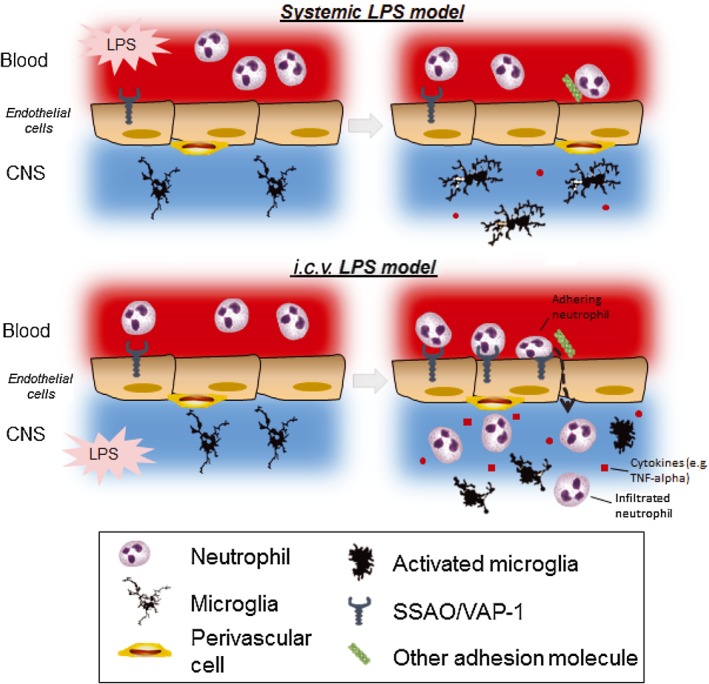
Schematic representation of the inflammatory sequence occurring in systemic and i.c.v. LPS models. (Top) When given systemically, a minimal amount of LPS can cross the BBB (Banks and Robinson, 2010), increasing rolling and adhering neutrophils on the endothelial cell layer. Systemic LPS might act on the BBB, activating endothelial cells, which affects leukocyte rolling and adhesion but does not increase the expression of VAP‐1 and thus does not increase leukocyte extravasation (Zhou et al., 2009). Systemic LPS also induced a mild response of microglia, characterized by increased cell number and changed morphology, consistent with other studies (Lemstra et al., 2007; Hoogland et al., 2015), possibly induced by the increase of cytokines in the brain parenchyma (Zhou et al., 2009). In peripheral organs, where the LPS action is not restricted by the BBB, systemic LPS leads to a strong neutrophil recruitment and extravasation associated with the release of proinflammatory cytokines that is inhibited by a SSAO/VAP‐1 inhibitor (Foot et al., 2013). We suggest that in the systemic LPS model, SSAO/VAP‐1 is involved mainly peripherally, leading to a reduced overall inflammatory response, which might result in a reduced microglia response in the brain. (Bottom) LPS given i.c.v. is not restricted by the BBB and can enter the brain parenchyma, resulting in a stronger neutrophil recruitment and extravasation and a stronger microglia response. We suggest that i.c.v. LPS induces a stronger signal from the brain parenchyma, eliciting a higher expression of VAP‐1 on the BBB and a higher neutrophil‐mediated inflammatory response. The increased adhesion and extravasation of neutrophils, in turn, amplifies microglial response. It is logical to assume then that a reduced neutrophil response would lead to decreased microglia activation in the brain as well.
We observed an increase in Iba‐1+ cell number after systemic LPS. This increase might have been caused by cell proliferation as has been shown in the hippocampus after a single systemic LPS injection (Fukushima et al., 2015) or by infiltration of peripheral monocytes or migration of microglia cells from one area to another. Further experiments will elucidate the effect of systemic LPS on microglia cells in striatum and substantia nigra as well as the role of VAP‐1 inhibition on microglia response.
Microglial activation plays an essential role in initiating the inflammatory response after i.c.v. LPS injection through the detection of the endotoxin in the brain parenchyma and, thereby, inducing endothelial activation and subsequent neutrophil recruitment into the CNS (Zhou et al., 2006). In the experiments described here , one of the effects of the inhibition of SSAO/VAP‐1 was also a reduced microglia response. SSAO/VAP‐1 does not interact directly with Siglec‐11, expressed on microglia (Kivi et al., 2009). Nevertheless, glial cells can be activated by the cytokines secreted by neutrophils (Ear and McDonald, 2008) and that a decrease in the extravasation of neutrophil could reduce the pro‐inflammatory signals to microglia as a consequence. With the group size chosen for i.c.v. experiments, the effect of PXS‐4681A on LPS‐induced microglia recruitment in the substantia nigra was not statistically significant. This might be due to the distance of the substantia nigra from the LPS injection site, where neutrophil extravasation and microglia response are more pronounced.
Our results show clear microglia activation after i.c.v. LPS – the cell processes become shorter and the cell smaller and rounder, which is typical of reactive microglia morphology (Beynon and Walker, 2012), whereas after systemic LPS, only a limited microglial activation was observed with the cells becoming bigger, with longer processes directed towards blood vessels. Few perivascular macrophages and pericytes were observed, as recognized by the amoeboid form and localization around blood vessels. LPS administration did not increase the number of those cells on blood vessels, ruling out the involvement of these macrophages.
The ability of an SSAO/VAP‐1 inhibitor to decrease the microglial response in both inflammatory models opens up, therefore, a large spectrum of applications in the many CNS diseases with a neuroinflammatory component. Moreover, PXS‐4681A efficiently diminished, without completely abolishing, neutrophil influx to the brain, potentially affording a more beneficial approach to treating brain inflammation than blockers of the chemokine receptor CXCR2, which have been shown to cause neutropenia (Holz et al., 2010) and so increasing the susceptibility to bacterial infection. Schilter et al. (2015) showed that a similar SSAO/VAP‐1 inhibitor is accompanied by neutrophil recruitment at a sufficient level to effectively combat lung infection, yet in low enough numbers to diminish injury.
The present findings suggest that treatment with a highly selective blocker of SSAO/VAP‐1 provides significant anti‐inflammatory activity in both systemic and local inflammatory models. Inhibition of SSAO/VAP‐1 activity decreased the LPS‐induced microglia response, even in the absence of neutrophil recruitment. Furthermore, the SSAO/VAP‐1 inhibitor PXS‐4681A reduced inflammation triggered by both a systemic and a local stimulus, suggesting that PXS‐4681A could act as a potent anti‐inflammatory agent in neurodegenerative diseases and in the various neurological conditions involving leukocyte activation.
In conclusion, the present findings show that SSAO/VAP‐1 inhibition, through treatment with a highly selective molecule, provided significant anti‐inflammatory activity in the brain after both systemic and i.c.v. LPS injections. Even in the absence of neutrophil extravasation in the brain, inhibition of SSAO/VAP‐1 activity decreased the microglia response after systemic LPS. In the local i.c.v. LPS model, SSAO/VAP‐1 inhibition decreased leukocyte migration and microglia recruitment and activation. Thus, SSAO/VAP‐1 inhibition was able to reduce the response of resident microglia, as well as infiltrating leukocytes, after either a systemic or a local inflammatory stimulus, suggesting that PXS‐4681A may provide an important tool for treating pathological conditions involving leukocyte infiltration and microglia response in the brain.
Author contributions
S.B. performed the experiments, participated in the design of the study, performed the statistical analysis and wrote the paper; A.B. participated in the design of the study and helped to draft the manuscript; J.F. performed the synthesis of the PXS‐4681A used in the study and helped to draft the manuscript; W.J. conceived the study and helped to draft the manuscript; B.W.B. conceived the study, participated in its design and coordination and helped to draft the manuscript. All authors read and approved the final manuscript.
Conflict of interest
S.B., A.B., J.F. and WJ have declared that a conflict of interest exists as A.B., J.F. and W.J. are employed by Pharmaxis, a pharmaceutical company that may gain or lose financially through publication of the paper. Moreover, A.B., J.F. and W.J. own shares in the company that may gain or lose financially through publication. S.B. declares conflict of interest as family member of A.B. B.W.B. declares that no conflict of interest exists.
Declaration of transparency and scientific rigour
This Declaration acknowledges that this paper adheres to the principles for transparent reporting and scientific rigour of preclinical research recommended by funding agencies, publishers and other organizations engaged with supporting research.
Supporting information
Figure S1 Pericytes and perivascular macrophage recruitment after i.c.v. LPS. (A‐D) The micrographs represent a triple staining to recognize neutrophils (MPO+/Iba1‐) and microglia/monocytes (MPO+/Iba1+) in the striatum after i.c.v. LPS or saline injection. Pericytes and perivascular macrophages can be distinguished from neutrophils by the expression of the Iba‐1 marker and they are only localized around blood vessels. (E) Pericytes and perivascular macrophages localized around blood vessels (arrows). (F) i.c.v. LPS (LPSVEH) did not increased pericytes and perivascular macrophage cell recruitment as compared to saline group (SAL‐VEH) and systemic treatment with the SSAO/VAP‐1 inhibitor did not affect the population either. Scale bars are 50 μm.
Figure S2 Microvessels quantification after BBB extraction induced by (A) i.c.v. LPS and (B) systemic LPS.
Acknowledgements
This project was supported by a Laureate Fellowship from the Australian Research Council, Grant #FL0992409, a Research in Business Award from the Australian Research Council, and with additional research funding provided by Pharmaxis Ltd supporting S.B.
Becchi, S. , Buson, A. , Foot, J. , Jarolimek, W. , and Balleine, B. W. (2017) Inhibition of semicarbazide‐sensitive amine oxidase/vascular adhesion protein‐1 reduces lipopolysaccharide‐induced neuroinflammation. British Journal of Pharmacology, 174: 2302–2317. doi: 10.1111/bph.13832.
References
- Aalto K, Autio A, Kiss EA, Elima K, Nymalm Y, Veres TZ et al. (2011). Siglec‐9 is a novel leukocyte ligand for vascular adhesion protein‐1 and can be used in PET imaging of inflammation and cancer. Blood 118: 3725–3733. [DOI] [PMC free article] [PubMed] [Google Scholar]
- Abella A, García‐Vicente S, Viguerie N, Ros‐Baró A, Camps M, Palacín M et al. (2004). Adipocytes release a soluble form of VAP‐1/SSAO by a metalloprotease‐dependent process and in a regulated manner. Diabetologia 47: 429–438. [DOI] [PubMed] [Google Scholar]
- Alexander SPH, Fabbro D, Kelly E, Marrion N, Peters JA, Benson HE et al. (2015a). The Concise Guide to PHARMACOLOGY 2015/16: Enzymes. Br J Pharmacol 172: 6024–6109. [DOI] [PMC free article] [PubMed] [Google Scholar]
- Alexander SPH, Davenport AP, Kelly E, Marrion N, Peters JA, Benson HE et al. (2015b). The Concise Guide to PHARMACOLOGY 2015/16: G protein‐coupled receptors. Br J Pharmacol 172: 5744–5869. [DOI] [PMC free article] [PubMed] [Google Scholar]
- Andonegui G, Goyert SM, Kubes P (2002). Lipopolysaccharide‐induced leukocyte‐endothelial cell interactions: a role for CD14 versus toll‐like receptor 4 within microvessels. J Immunol 169: 2111–2119. [DOI] [PubMed] [Google Scholar]
- Banks WA, Robinson SM (2010). Minimal penetration of lipopolysaccharide across the murine blood–brain barrier. Brain Behav Immun 24: 102–109. [DOI] [PMC free article] [PubMed] [Google Scholar]
- Beynon SB, Walker FR (2012). Microglial activation in the injured and healthy brain: what are we really talking about? Practical and theoretical issues associated with the measurement of changes in microglial morphology. Neuroscience 225: 162–171. [DOI] [PubMed] [Google Scholar]
- Carvalho‐Tavares J, Hickey MJ, Hutchison J, Michaud J, Sutcliffe IT, Kubes P (2000). A role for platelets and endothelial selectins in tumor necrosis factor‐alpha‐induced leukocyte recruitment in the brain microvasculature. Circ Res 87: 1141–1148. [DOI] [PubMed] [Google Scholar]
- Castillo V, Lizcano JM, Visa J, Unzeta M (1998). Semicarbazide‐sensitive amine oxidase (SSAO) from human and bovine cerebrovascular tissues: biochemical and immunohistological characterization. Neurochem Int 33: 415–423. [DOI] [PubMed] [Google Scholar]
- Curtis MJ, Bond RA, Spina D, Ahluwalia A, Alexander SPA, Giembycz MA et al. (2015). Experimental design and analysis and their reporting: new guidance for publication in BJP. Br J Pharmacol 172: 3461–3471. [DOI] [PMC free article] [PubMed] [Google Scholar]
- Dallaire L, Tremblay L, Béliveau R (1991). Purification and characterization of metabolically active capillaries of the blood–brain barrier. Biochem J 276 (Pt 3): 745–752. [DOI] [PMC free article] [PubMed] [Google Scholar]
- Downes CE, Crack PJ (2010). Neural injury following stroke: are Toll‐like receptors the link between the immune system and the CNS? Br J Pharmacol 160: 1872–1888. [DOI] [PMC free article] [PubMed] [Google Scholar]
- Ear T, McDonald PP (2008). Cytokine generation, promoter activation, and oxidant‐independent NF‐kappaB activation in a transfectable human neutrophilic cellular model. BMC Immunol 9: 14. [DOI] [PMC free article] [PubMed] [Google Scholar]
- Fan LW, Pang Y, Lin S, Rhodes PG, Cai Z (2005). Minocycline attenuates lipopolysaccharide‐induced white matter injury in the neonatal rat brain. Neuroscience 133: 159–168. [DOI] [PubMed] [Google Scholar]
- Ferrer I, Lizcano JM, Hernández M, Unzeta M (2002). Overexpression of semicarbazide sensitive amine oxidase in the cerebral blood vessels in patients with Alzheimer's disease and cerebral autosomal dominant arteriopathy with subcortical infarcts and leukoencephalopathy. Neurosci Lett 321: 21–24. [DOI] [PubMed] [Google Scholar]
- Foot JS, Yow TT, Schilter H, Buson A, Deodhar M, Findlay AD et al. (2013). PXS‐4681A, a potent and selective mechanism‐based inhibitor of SSAO/VAP‐1 with anti‐inflammatory effects in vivo. J Pharmacol Exp Ther 347: 365–374. [DOI] [PubMed] [Google Scholar]
- Fukushima S, Furube E, Itoh M, Nakashima T, Miyata S (2015). Robust increase of microglia proliferation in the fornix of hippocampal axonal pathway after a single LPS stimulation. J Neuroimmunol 285: 31–40. [DOI] [PubMed] [Google Scholar]
- García‐Vicente S, Abella A, Viguerie N, Ros‐Baró A, Camps M, Testar X et al. (2005). The release of soluble VAP‐1/SSAO by 3T3‐L1 adipocytes is stimulated by isoproterenol and low concentrations of TNFalpha. J Physiol Biochem 61: 395–401. [DOI] [PubMed] [Google Scholar]
- Giulian D, Li J, Bartel S, Broker J, Li X, Kirkpatrick JB (1995). Cell surface morphology identifies microglia as a distinct class of mononuclear phagocyte. J Neurosci 15: 7712–7726. [DOI] [PMC free article] [PubMed] [Google Scholar]
- Hernandez‐Guillamon M, Solé M, Delgado P, García‐Bonilla L, Giralt D, Boada C et al. (2012). VAP‐1/SSAO plasma activity and brain expression in human hemorrhagic stroke. Cerebrovasc Dis 33: 55–63. [DOI] [PubMed] [Google Scholar]
- Hinwood M, Tynan RJ, Charnley JL, Beynon SB, Day TA, Walker FR (2013). Chronic stress induced remodeling of the prefrontal cortex: structural re‐organization of microglia and the inhibitory effect of minocycline. Cereb Cortex 23: 1784–1797. [DOI] [PubMed] [Google Scholar]
- Holz O, Khalilieh S, Ludwig‐Sengpiel A, Watz H, Stryszak P, Soni P et al. (2010). SCH527123, a novel CXCR2 antagonist, inhibits ozone‐induced neutrophilia in healthy subjects. Eur Respir J 35: 564–570. [DOI] [PubMed] [Google Scholar]
- Hoogland IC, Houbolt C, van Westerloo DJ, van Gool WA, van de Beek D (2015). Systemic inflammation and microglial activation: systematic review of animal experiments. J Neuroinflammation 12: 114. [DOI] [PMC free article] [PubMed] [Google Scholar]
- Ji KA, Yang MS, Jeong HK, Min KJ, Kang SH, Jou I et al. (2007). Resident microglia die and infiltrated neutrophils and monocytes become major inflammatory cells in lipopolysaccharide‐injected brain. Glia 55: 1577–1588. [DOI] [PubMed] [Google Scholar]
- Ji KA, Eu MY, Kang SH, Gwag BJ, Jou I, Joe EH (2008). Differential neutrophil infiltration contributes to regional differences in brain inflammation in the substantia nigra pars compacta and cortex. Glia 56: 1039–1047. [DOI] [PubMed] [Google Scholar]
- Kilkenny C, Browne W, Cuthill IC, Emerson M, Altman DG (2010). Animal research: reporting in vivo experiments: the ARRIVE guidelines. Br J Pharmacol 160: 1577–1579. [DOI] [PMC free article] [PubMed] [Google Scholar]
- Kivi E, Elima K, Aalto K, Nymalm Y, Auvinen K, Koivunen E et al. (2009). Human Siglec‐10 can bind to vascular adhesion protein‐1 and serves as its substrate. Blood 114: 5385–5392. [DOI] [PMC free article] [PubMed] [Google Scholar]
- Korytko PJ, Boje KM (1996). Pharmacological characterization of nitric oxide production in a rat model of meningitis. Neuropharmacology 35: 231–237. [DOI] [PubMed] [Google Scholar]
- Lawson LJ, Perry VH, Dri P, Gordon S (1990). Heterogeneity in the distribution and morphology of microglia in the normal adult mouse brain. Neuroscience 39: 151–170. [DOI] [PubMed] [Google Scholar]
- Lemstra AW, Groen in't Woud JC, Hoozemans JJ, van Haastert ES, Rozemuller AJ, Eikelenboom P et al. (2007). Microglia activation in sepsis: a case‐control study. J Neuroinflammation 4: 4. [DOI] [PMC free article] [PubMed] [Google Scholar]
- Liu B, Hong JS (2003). Role of microglia in inflammation‐mediated neurodegenerative diseases: mechanisms and strategies for therapeutic intervention. J Pharmacol Exp Ther 304: 1–7. [DOI] [PubMed] [Google Scholar]
- McGrath JC, Lilley E (2015). Implementing guidelines on reporting research using animals (ARRIVE etc.): new requirements for publication in BJP. Br J Pharmacol 172: 3189–3193. [DOI] [PMC free article] [PubMed] [Google Scholar]
- Merinen M, Irjala H, Salmi M, Jaakkola I, Hänninen A, Jalkanen S (2005). Vascular adhesion protein‐1 is involved in both acute and chronic inflammation in the mouse. Am J Pathol 166: 793–800. [DOI] [PMC free article] [PubMed] [Google Scholar]
- Paxinos G, Watson C (2007). The Rat Brain in Stereotaxic Coordinates, 6th edn. Academic: San Diego. [Google Scholar]
- Qin L, Wu X, Block ML, Liu Y, Breese GR, Hong JS et al. (2007). Systemic LPS causes chronic neuroinflammation and progressive neurodegeneration. Glia 55: 453–462. [DOI] [PMC free article] [PubMed] [Google Scholar]
- Quan N, Banks WA (2007). Brain‐immune communication pathways. Brain Behav Immun 21: 727–735. [DOI] [PubMed] [Google Scholar]
- Reinert KR, Umphlet CD, Quattlebaum A, Boger HA (2014). Short‐term effects of an endotoxin on substantia nigra dopamine neurons. Brain Res 1557: 164–170. [DOI] [PMC free article] [PubMed] [Google Scholar]
- Salmi M, Jalkanen S (1992). A 90‐kilodalton endothelial cell molecule mediating lymphocyte binding in humans. Science 257: 1407–1409. [DOI] [PubMed] [Google Scholar]
- Salmi M, Jalkanen S (1996). Human vascular adhesion protein 1 (VAP‐1) is a unique sialoglycoprotein that mediates carbohydrate‐dependent binding of lymphocytes to endothelial cells. J Exp Med 183: 569–579. [DOI] [PMC free article] [PubMed] [Google Scholar]
- Salmi M, Jalkanen S (2001). VAP‐1: an adhesin and an enzyme. Trends Immunol 22: 211–216. [DOI] [PubMed] [Google Scholar]
- Salter‐Cid LM, Wang E, O'Rourke AM, Miller A, Gao H, Huang L et al. (2005). Anti‐inflammatory effects of inhibiting the amine oxidase activity of semicarbazide‐sensitive amine oxidase. J Pharmacol Exp Ther 315: 553–562. [DOI] [PubMed] [Google Scholar]
- Schilter HC, Collison A, Russo RC, Foot JS, Yow TT, Vieira AT et al. (2015). Effects of an anti‐inflammatory VAP‐1/SSAO inhibitor, PXS‐4728A, on pulmonary neutrophil migration. Respir Res 16: 42. [DOI] [PMC free article] [PubMed] [Google Scholar]
- Southan C, Sharman JL, Benson HE, Faccenda E, Pawson AJ, Alexander SP et al. (2016). The IUPHAR/BPS guide to PHARMACOLOGY in 2016: towards curated quantitative interactions between 1300 protein targets and 6000 ligands. Nucleic Acids Res 44: D1054–D1068. [DOI] [PMC free article] [PubMed] [Google Scholar]
- Stence N, Waite M, Dailey ME (2001). Dynamics of microglial activation: a confocal time‐lapse analysis in hippocampal slices. Glia 33: 256–266. [PubMed] [Google Scholar]
- Stolen CM, Marttila‐Ichihara F, Koskinen K, Yegutkin GG, Turja R, Bono P et al. (2005). Absence of the endothelial oxidase AOC3 leads to abnormal leukocyte traffic in vivo. Immunity 22: 105–115. [DOI] [PubMed] [Google Scholar]
- Tohka S, Laukkanen M, Jalkanen S, Salmi M (2001). Vascular adhesion protein 1 (VAP‐1) functions as a molecular brake during granulocyte rolling and mediates recruitment in vivo. FASEB J 15: 373–382. [DOI] [PubMed] [Google Scholar]
- Tsushima H, Mori M (2000). In vivo evidence that activation of tyrosine kinase is a trigger for lipopolysaccharide‐induced fever in rats. Brain Res 852: 367–373. [DOI] [PubMed] [Google Scholar]
- Zhou H, Lapointe BM, Clark SR, Zbytnuik L, Kubes P (2006). A requirement for microglial TLR4 in leukocyte recruitment into brain in response to lipopolysaccharide. J Immunol 177: 8103–8110. [DOI] [PubMed] [Google Scholar]
- Zhou H, Andonegui G, Wong CH, Kubes P (2009). Role of endothelial TLR4 for neutrophil recruitment into central nervous system microvessels in systemic inflammation. J Immunol 183: 5244–5250. [DOI] [PubMed] [Google Scholar]
- Zhou Y, Zhang Y, Li J, Lv F, Zhao Y, Duan D et al. (2012). A comprehensive study on long‐term injury to nigral dopaminergic neurons following intracerebroventricular injection of lipopolysaccharide in rats. J Neurochem 123: 771–780. [DOI] [PubMed] [Google Scholar]
Associated Data
This section collects any data citations, data availability statements, or supplementary materials included in this article.
Supplementary Materials
Figure S1 Pericytes and perivascular macrophage recruitment after i.c.v. LPS. (A‐D) The micrographs represent a triple staining to recognize neutrophils (MPO+/Iba1‐) and microglia/monocytes (MPO+/Iba1+) in the striatum after i.c.v. LPS or saline injection. Pericytes and perivascular macrophages can be distinguished from neutrophils by the expression of the Iba‐1 marker and they are only localized around blood vessels. (E) Pericytes and perivascular macrophages localized around blood vessels (arrows). (F) i.c.v. LPS (LPSVEH) did not increased pericytes and perivascular macrophage cell recruitment as compared to saline group (SAL‐VEH) and systemic treatment with the SSAO/VAP‐1 inhibitor did not affect the population either. Scale bars are 50 μm.
Figure S2 Microvessels quantification after BBB extraction induced by (A) i.c.v. LPS and (B) systemic LPS.