

Abstract
Background and Purpose
Agonists acting at GPCRs promote biased signalling via Gα or Gβγ subunits, GPCR kinases and β‐arrestins. Since the demonstration of biased agonism has implications for drug discovery, it is essential to consider confounding factors contributing to bias. We have examined bias at human α1A‐adrenoceptors stably expressed at low levels in CHO‐K1 cells, identifying off‐target effects at endogenous receptors that contribute to ERK1/2 phosphorylation in response to the agonist oxymetazoline.
Experimental Approach
Intracellular Ca2+ mobilization was monitored in a Flexstation® using Fluo 4‐AM. The accumulation of cAMP and ERK1/2 phosphorylation were measured using AlphaScreen® proximity assays, and mRNA expression was measured by RT‐qPCR. Ligand bias was determined using the operational model of agonism.
Key Results
Noradrenaline, phenylephrine, methoxamine and A61603 increased Ca2+ mobilization, cAMP accumulation and ERK1/2 phosphorylation. However, oxymetazoline showed low efficacy for Ca+2 mobilization, no effect on cAMP generation and high efficacy for ERK1/2 phosphorylation. The apparent functional selectivity of oxymetazoline towards ERK1/2 was related to off‐target effects at 5‐HT1B receptors endogenously expressed in CHO‐K1 cells. Phenylephrine and methoxamine showed genuine bias towards ERK1/2 phosphorylation compared to Ca2+ and cAMP pathways, whereas A61603 displayed bias towards cAMP accumulation compared to ERK1/2 phosphorylation.
Conclusion and Implications
We have shown that while adrenergic agonists display bias at human α1A‐adrenoceptors, the marked bias of oxymetazoline for ERK1/2 phosphorylation originates from off‐target effects. Commonly used cell lines express a repertoire of endogenous GPCRs that may confound studies on biased agonism at recombinant receptors.
Abbreviations
- ECAR
extracellular acidification rate
- HEAT
2‐(β‐4‐hydroxyphenyl)ethylaminomethyltetralone
- PTX
pertussis toxin
Introduction
Agonists acting at GPCRs are often shown to promote promiscuous receptor coupling and to activate multiple signalling pathways (Kukkonen et al., 2001; Perez and Karnik, 2005; Kenakin and Christopoulos, 2013). Some agonists can selectively activate signalling pathways by stabilizing distinct receptor conformations, thereby promoting differential interaction with particular Gα subunits or alternative effector proteins, a characteristic known as biased agonism or functional selectivity (Evans et al., 2010; Kenakin and Christopoulos, 2013; Luttrell et al., 2015). Biased agonists that promote beneficial cellular responses but not detrimental effects are considered to have great therapeutic promise. Biased agonism has been studied primarily in recombinant GPCR expression systems with the advantages that receptor abundance can be modulated, and nominally that only the receptor subtype of interest is present. It is essential, however, that studies performed on cells expressing recombinant GPCRs represent bias that can be translated to therapeutically relevant cells, tissues and in vivo experiments.
For example, the agonist TRV130 (oliceridine) displays marked bias towards Gαi/o‐mediated inhibition of cAMP accumulation over β‐arrestin recruitment in HEK293 cells expressing the μ‐opioid receptor from human and other mammalian species (DeWire et al., 2013). In animal studies, oliceridine was found to have analgesic potency similar to morphine, but produced less gastrointestinal dysfunction and respiratory depression than morphine. Recent Phase 3 clinical trials have demonstrated effective post‐operative analgesia following oliceridine treatment, with diminished nausea and vomiting compared to morphine. Another example is the development of biased agonists at the κ‐opioid receptor to treat pain and chronic itch, but lacking the adverse effects of dysphoria and sedation (Brust et al., 2016). The κ‐receptor agonist triazole 1.1 displayed bias towards beneficial Gαi/o signalling over detrimental β‐arrestin mediated pathways. This bias in CHO‐K1 cells expressing the κ‐receptor (Zhou et al., 2013) was reflected in mouse behavioural studies showing that triazole 1.1 had antinociceptive and antipruritic activity without β‐arrestin‐mediated dopaminergic inhibition (Brust et al., 2016).
Despite these successes, the determination of relevant agonist bias remains a challenge, and many factors can confound interpretation such as off‐target effects, cell background, receptor and effector expression levels, and the kinetic properties of agonists. Thus, while recombinant cell lines are generally checked for expression of related receptor subtypes from the same family as the target GPCR, less attention has been paid to the possibility that biased agonists may be acting at both the target receptor and another receptor belonging to a distinct GPCR family that is expressed endogenously in the host cells. This type of ‘off‐target’ activity is likely to be widespread, based on classification of receptors by the chemical similarity of their ligands (Keiser et al., 2009; Lin et al., 2013). Our study examines this problem in CHO‐K1 cells expressing the human α1A‐adrenoceptor.
α1A‐adrenoceptors are the main adrenoceptor subtype involved in the contractile responses to endogenous or exogenous agonists in the smooth muscle of the genitourinary system (Civantos Calzada and Aleixandre de Artinano, 2001) including the vas deferens (Campos et al., 2003), seminal vesicle (Silva et al., 1999), cauda epididymis (Queiroz et al., 2002) and prostate gland (Gray et al., 2008). This uroselectivity has driven the development of selective drugs for the treatment of benign prostatic hypertrophy (Ventura et al., 2011), and this receptor is also a target for male contraception (White et al., 2013). It is now evident that α1A‐adrenoceptors have important metabolic (Hutchinson and Bengtsson, 2005; Hutchinson and Bengtsson, 2006) and cardioprotective effects (O'Connell et al., 2014).
The α1A‐adrenoceptor classically activates Gαq/11, stimulating PLC to hydrolyse phosphatidylinositol 4,5‐bisphosphate and form inositol 1,4,5‐trisphosphate and diacylglycerol. These molecules mediate intracellular Ca2+ mobilization and activation of PKC, respectively (Chen and Minneman, 2005). α1A‐adrenoceptors also activate multiple signalling pathways in addition to canonical effects on Ca2+ mobilization. For instance, activation of α1A‐adrenoceptors may increase cAMP accumulation and ERK1/ERK2 phosphorylation in native tissues and in recombinant systems (Ruan et al., 1998; Hu et al., 1999; Jiao et al., 2002; Bauer et al., 2011; Evans et al., 2011; Perez‐Aso et al., 2013). Agonist bias towards particular signalling pathways has also been demonstrated for different ligands and we have previously shown that phenylephrine (α1‐adrenoceptor agonist) displays substantial bias towards extracellular acidification rate (ECAR) versus Ca2+ mobilization or cAMP accumulation. On the other hand, A61603 (α1A‐adrenoceptor agonist) displays bias towards cAMP accumulation relative to Ca2+ mobilization while oxymetazoline shows bias towards ECAR compared to Ca2+ in CHO‐K1 cells over‐expressing the human α1A‐adrenoceptor (Evans et al., 2011).
Here, we have investigated biased agonism in CHO‐K1 cells expressing low levels of the human α1A‐adrenoceptor (CHOα1A‐adrenoceptor, 204 fmol·mg−1 protein). All of the agonists except oxymetazoline increased intracellular Ca2+ mobilization, cAMP accumulation and ERK1/2 phosphorylation. Oxymetazoline was a partial agonist for Ca2+ mobilization and a super‐agonist for ERK1/2 phosphorylation yet failed to stimulate cAMP accumulation even at high concentrations. We found that phenylephrine, methoxamine and A61603 displayed ligand bias at α1A‐adrenoceptors. However, the distinct signalling profile of oxymetazoline, particularly for ERK1/2 phosphorylation, was related to off‐target effects at 5‐HT1B receptors that are endogenously expressed in CHO‐K1 cells.
Methods
Cell culture and production of clones stably expressing α1A‐adrenoceptors
Plasmid containing the human α1A‐4‐adrenoceptor cDNA was kindly donated by Dr. Thomas Chang (Roche Bioscience, Palo Alto, CA) and modified to produce the human α1A‐1‐adrenoceptor as described by Evans et al. (2011). CHO‐K1 cells were cultivated in a 50:50 DMEM /Ham's F12 medium supplemented with 5% (v.v−1) FBS, glutamine (2 mM), penicillin (100 U mL−1) and streptomycin (100 μg·mL−1) at 37°C with 5% CO2. Transfections were performed using Lipofectamine (Invitrogen) as per the manufacturer's instructions. Transfected cells were selected in media containing G418 (800 μg·mL−1) and maintained in media containing 400 μg·mL−1 G418. Clonal cell lines were isolated by selecting G418‐resistant colonies and preliminary screening of clones made using 2000 pM of [3H]‐prazosin in whole‐cell binding assays. Suitable clones were amplified and receptor levels determined in saturation binding assays using [125I]‐HEAT. Transient transfection of HEK293 cells with the α1A‐adrenoceptor construct in pcDNA3.1 was performed using polyethylenimine (PEI). Transfection solution comprised NaCl (150 mM; pH 7.0) containing 15 μL PEI (1 mg·mL−1) and 5 μg DNA incubated at room temperature for 20 min with 200 μL added to each well of a six‐well plate containing 500 000 cells in growth medium. Transfected cells were harvested after 24 h and plated into 96‐well plates for 6 h before serum starving overnight prior to experimentation.
Radioligand binding studies
Cells from a 75 cm2 flask were washed twice with HEPES‐buffered saline and scraped from flasks with lysis buffer (25 mM Tris, pH 7.5 at room temperature (21°C), 1 mM EDTA, 10 μg·mL−1 leupeptin, 200 μg·mL−1 bacitracin, 2.5 μg·mL−1 aprotinin and 2.5 μg·mL−1 pepstatin A,). The suspension was homogenised in a Dounce homogeniser and centrifuged at low speed (1000 g, 10 min) to remove cell debris. Supernatants were pooled and centrifuged (39 000 g, 15 min, 4°C). The pellet was resuspended in binding buffer (50 mM Tris, pH 7.4, 5 mM MgCl2, 1 mM EDTA, 200 μg·mL−1 bacitracin, 10 μg·mL−1 leupeptin, 2.5 μg·mL−1 pepstatin A, and 2.5 μg·mL−1 aprotinin) and frozen at −70°C until required. Membranes (10–20 μg of protein) were incubated with [125I]‐HEAT (20–1200 pM) in a total volume of 100 μL for 90 min at room temperature (21°C). Phentolamine (100 μM) was used to define nonspecific binding. Competition binding experiments were conducted using a range of concentrations of unlabelled ligand and [125I]‐HEAT (500 pM), at room temperature for 90 min (Sharpe et al., 2003). Reactions were terminated by rapid filtration through GF/C filters presoaked for 30 min in 0.5% polyethylenimine using a Packard Filtermate cell harvester. Filters were washed three times with wash buffer (50 mM Tris, pH 7.4, 4 °C), dried, and 25 μL of Microscint O (PerkinElmer Life and Analytical Sciences) added and radioactivity counted on a Packard TopCount. Protein concentrations were quantified using the Lowry et al. (1951) assay. All experiments were performed in duplicate using at least three different membrane preparations.
Measurement of intracellular free Ca2+ concentration
CHOα1A‐adrenoceptor cells were seeded at 25000 cells per well in 96‐well plates overnight. On the day of the experiment, the medium was removed and cells washed three times in a modified Hanks' balanced saline solution (HBSS; 150 mM NaCl, 2.6 mM KCl, 1.18 mM MgCl2.2H2O, 10 mM D‐glucose, 10 mM HEPES, 2.2 mM CaCl2.2H2O, and 2 mM probenecid, pH 7.4) containing 0.5% (w·v−1) BSA. In light‐diminished conditions, cells were treated with fluoro‐4 (0.1% (v·v−1) in modified HBSS for 1 h at 37°C. Cells were washed twice in modified HBSS and incubated for a further 30 min before transfer to a FlexStation (Molecular Devices, Sunnyvale, CA). Real‐time fluorescence measurements were recorded every 1.7 over 200 s, with drug additions occurring after 17 s, at an excitation wavelength of 485 nm and emission wavelength of 520 nm. All experiments were performed in duplicate. Agonist responses represent the difference between basal fluorescence and peak [Ca2+]i measurements expressed as a percentage of the response to the Ca2+ ionophore A23187 (1 μM) in each experiment.
cAMP accumulation or inhibition studies
Cells were seeded into 96‐well plates at 25000 cells per well in media with 0.5% (v·v−1) FBS the night before the experiment. On the day of the experiment, the media was replaced with stimulation buffer (1 mg·mL−1 BSA, 0.5 mM IBMX, and 5 mM HEPES, pH 7.4, in HBSS, 90 μL per well). Cells were exposed to agonists for 30 min at 37°C in cAMP accumulation assays. For the study evaluating the inhibition of cAMP production, cells were treated with oxymetazoline or 5‐HT for 15 min, then forskolin (1 μM) was added for 30 min. The reactions were terminated by the removal of the stimulation buffer and the addition of 50 μL ice‐cold 100% ethanol. The uncovered plates were then incubated at 37°C, to allow complete evaporation of the ethanol. After the ethanol was evaporated, 50 μL of detection buffer [1 mg·mL−1 BSA, 0.3% (v.v−1) Tween 20 and 5 mM HEPES, pH 7.4] was added to each well. cAMP accumulation was measured using a Lance™ cAMP kit (PerkinElmer), and detected using the EnVision™ Multilabel Plate Reader (PerkinElmer). Results are expressed as the percentage of the forskolin response (100 μM) in the given experiment. All experiments were performed in duplicate, and n is the number of independent experiments.
AlphaScreen ERK1/2 signalling assays
ERK1/2 phosphorylation was detected using the AlphaScreen SureFire Assay Kit (PerkinElmer Life Sciences). Briefly, cells were seeded in clear 96‐well plates (10 000 cells per well) and allowed to adhere for 24 h, then incubated in serum‐free DMEM/ Ham's F12 medium overnight at 37°C and 5% CO2. Cells were treated in the presence or absence of antagonists for 30 min (or 12–18 h for PTX), before stimulation with agonists for 5 min. The medium was replaced with SureFire lysis buffer (TGR Biosciences) followed by incubation for 5 min at room temperature with agitation, and samples were frozen at −20°C. Approximately 5 μL of lysate per well was transferred to a 384‐well white ProxiPlate (PerkinElmer), and 4 μL of acceptor mix (activation buffer, reaction buffer, and AlphaScreen beads (10:40:1) added. Plates were incubated for 2 h at 37°C before addition of 2 μL of donor mix (donor beads and dilution buffer, 1:20), then incubated for 2 h at 37°C. Plates were read on an EnVision™ Multilabel Plate Reader (PerkinElmer).
TaqMan RT and real time qPCR
RNA was extracted from CHOα1A‐adrenoceptor cells and from untransfected CHO‐K1 cells. Total RNA was isolated using TRIzol reagent (Invitrogen Life Technologies, Inc.) according to the manufacturer's protocol. RNA quality was assessed by absorbance at 260 and 280 nm and electrophoresis on 1.3% agarose gels. Degradation of RNA samples was not detected. DNase (DNA‐free™ DNA removal kit, Invitrogen Life Technologies, Inc.) was added to remove DNA contamination. cDNAs were synthesised by RT following the manufacturer's protocol (iScript™ Reverse Transcription Supermix for RT‐qPCR, BioRad). Briefly, reaction mix (10 μL) containing 500 ng of RNA was incubated in a thermal cycler through priming (5 min at 85°C), RT (30 min at 42°C) and RT inactivation (5 min at 85°C) cycles. RT reactions were diluted 1 in 20 and 4 μL of cDNA used in conjunction with TaqMan Gene Expression Assays to measure 5‐HT1B receptor (Chinese hamster Cg04423773_s1) or Actb expression (Cg04424027_gH, Invitrogen Life Technologies, Inc). Samples were amplified in a Bio‐Rad CFX96 instrument according to the following protocol: uracil‐N glycosylase incubation (2 min at 50°C) and AmpliTaq Gold activation (10 min at 95°C), PCR (40 cycles), each cycle consisting of denaturation (15 s at 95°C) followed by annealing and extension (1 min at 60°C). All TaqMan assays were performed in duplicate. Levels of Htr1b mRNA are expressed relative to Actb, calculated as (2‐ΔCt)*1000.
Data analysis
All values are expressed as mean ± SEM. Data were analysed using nonlinear curve fitting (Prism ver. 6.0; GraphPad Software, San Diego, CA) to obtain pEC50 values for Ca2+ mobilization, cAMP accumulation, ECAR and ERK1/2 phosphorylation, or pK i, pK D, and B max values from radioligand binding assays. The statistical significance of differences between groups was analysed by one‐way ANOVA with Bonferroni post test correction or Student's unpaired two‐tailed t‐test (*P < 0.05). Data are presented as the increase expressed as a % of basal levels, if not otherwise stated. Agonist bias was quantified as previously reported (Evans et al., 2011; Kenakin et al., 2012). Briefly, the Log(τ/KA) or LogTR value of a reference agonist, in this case noradrenaline, is subtracted from the LogTR value of the agonists of interest to yield LogTRn in order to avoid the impact of cell‐ and assay‐dependent effects on the observed agonism in each pathway. The relative bias is then calculated for each agonist at the two distinct signalling pathways by subtracting the LogTRn of one pathway from the other to give a ΔLogTRn value, a numerical measure of bias. A lack of biased agonism will result in values of ΔLogTRn not significantly different from 0. The data and statistical analysis comply with the recommendations on experimental design and analysis in pharmacology (Curtis et al., 2015).
Materials
[125I]‐HEAT (2‐[β‐(4‐hydroxy‐3‐[125I]iodophenyl) ethylamino‐methyl]tetralone) was purchased from Pro‐Search, Melbourne, Australia. [3H]prazosin was obtained from PerkinElmer Life and Analytical Sciences, Waltham, MA. (‐)‐Norepinephrine bitartrate (noradrenaline), oxymetazoline hydrochloride, phenylephrine hydrochloride, methoxamine hydrochloride, A61603 hydrate (N‐[5‐(4,5‐dihydro‐1H‐imidazol‐2yl)‐2‐hydroxy‐5,6,7,8‐tetrahydro naphthalen‐1‐yl] methanesulphonamide hydrobromide), serotonin creatinine sulfate monohydrate (5‐HT), prazosin hydrochloride, calcimycin (A23187) and pertussis toxin (PTX) were purchased from Sigma‐Aldrich (St Louis, MO). SB216641 (N‐[3‐[3‐(dimethylamino)ethoxy]‐4‐methoxyphenyl]‐2′‐methyl‐4′‐(5‐methyl‐1,2,4‐oxadiazol‐3‐yl)‐[1,1′‐biphenyl]‐4‐carboxamide hydrochloride) was purchased from Tocris Bioscience (Bristol, UK); UBO‐QIC (name since revised to FR900359) was acquired from the Institute of Pharmaceutical Biology, University of Bonn, Germany.
Nomenclature of targets and ligands
Key protein targets and ligands in this article are hyperlinked to corresponding entries in http://www.guidetopharmacology.org, the common portal for data from the IUPHAR/BPS Guide to PHARMACOLOGY (Southan et al., 2016), and are permanently archived in the Concise Guide to PHARMACOLOGY 2015/16 (Alexander et al., 2015a,b).
Results
Expression of α1A‐adrenoceptors in CHO‐K1 cells
Saturation binding studies with [125I]‐HEAT revealed a Bmax of 204 ± 28 fmol·mg−1 (n = 7) protein and pKD of 9.3 ± 0.06 (n = 7) similar to those reported for α1‐adrenoceptors in rat brain cortex (Bmax 116 fmol·mg−1) (Graziadei et al., 1989), bovine aorta (Bmax 170 fmol·mg−1) (Descombes and Stoclet, 1985) or rabbit prostate (Bmax 210 fmol·mg−1) (Su et al., 2008). Competition studies with noradrenaline, phenylephrine, methoxamine, A61603 and oxymetazoline were also carried out and showed that all agonists competed for [125I]‐HEAT binding with curves fitting a single‐site isotherm. The rank order of binding affinities (pKi values) was: oxymetazoline (7.80 ± 0.09, n = 3) = A61603 (7.53 ± 0.18, n = 3) ≫ noradrenaline (5.57 ± 0.09, n = 3) ≥ phenylephrine (5.30 ± 0.06, n = 3) > methoxamine (4.60 ± 0.12, n = 3).
Signalling responses to adrenergic agonists in CHO cells expressing α1A‐adrenoceptors
Concentration response curves for phenethylamines (noradrenaline, phenylephrine and methoxamine) and imidazolines (A61603 and oxymetazoline) were performed for Ca2+ mobilisation (Figure 1A), cAMP accumulation (Figure 1B) and ERK1/2 phosphorylation (p‐ERK1/2) (Figure 1C) in CHOα1A‐adrenoceptor cells. All phenethylamines and imidazolines increased Ca2+ mobilisation, cAMP accumulation and ERK1/2 phosphorylation (Figure 1). However, oxymetazoline was a weak partial agonist (α = 0.35) for Ca2+ mobilization (Table 1), failed to significantly affect cAMP accumulation, but was a super agonist (α = 2.3) for ERK1/2 phosphorylation (Table 1). The order of potency for Ca2+ mobilization was A61603 = oxymetazoline > noradrenaline = phenylephrine = methoxamine; for cAMP accumulation, A61603 > noradrenaline = phenylephrine > methoxamine > > oxymetazoline; and for p‐ERK1/2, A61603 = oxymetazoline = methoxamine > phenylephrine = noradrenaline (see Table 1 for pEC50 values). Moreover, phenylephrine and methoxamine produced lower Emax values than the reference agonist noradrenaline in all signalling assays (Table 1) and A61603 behaved as a full agonist (compared to noradrenaline) (Figure 1). The unique and markedly biased behaviour of oxymetazoline was further evaluated to determine whether its differential effects on ERK1/2 phosphorylation were due to activation of distinct signalling pathways after occupying α1A‐adrenoceptors (indicating functional selectivity) or to off‐target effects.
Figure 1.
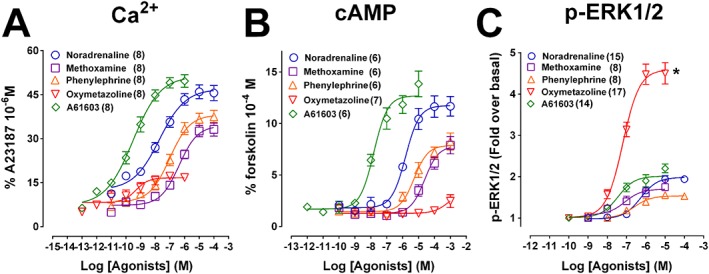
Concentration‐response curves for Ca2+ mobilization, cAMP accumulation and ERK1/2 phosphorylation (p‐ERK1/2) in CHO‐K1 cells expressing human α1A‐adrenoceptors. Concentration‐dependent Ca2+ mobilization (A), cAMP accumulation (B) or ERK1/2 phosphorylation (C) was stimulated by the phenethylamines noradrenaline, phenylephrine and methoxamine, and the imidazolines A61603 and oxymetazoline. Each point represents mean ± SEM of n (in brackets) independent experiments. *P<0.05 in relation to the maximum response of agonists other than oxymetazoline.
Table 1.
Potency (pEC50), maximum response (Emax) and α value (Emax relative to noradrenaline) of agonists at the human α1A‐adrenoceptors across different signalling outcomes. Ca2+ mobilization was measured as % 23187(1 µM), cAMP accumulation as % forskolin (100 µM) and pERK1/2 as fold/basal.
| Agonists | Parameters | Ca2+ | cAMP | p‐ERK1/2 |
|---|---|---|---|---|
| Noradrenaline | Emax | 47 ± 1.8 (8) | 11.7 ± 0.45 (6) | 2.0 ± 0.5 (15) |
| pEC50 | 7.7 ± 0.22 | 5.8 ± 0.13 | 6.3 ± 0.12 | |
| α | 1.00 | 1.00 | 1.00 | |
| Phenylephrine | Emax | 38.1 ± 1.7 (8) | 7.9 ± 0.40 (6) | 1.54 ± 0.4 (8) |
| pEC50 | 7.0 ± 0.18 | 5.3 ± 0.16 | 6.6 ± 0.3 | |
| α | 0.81 | 0.67 | 0.77 | |
| Methoxamine | Emax | 34.4 ± 1.7 (8) | 7.8 ± 0.44 (6) | 1.7 ± 0.09 (8) |
| pEC50 | 6.4 ± 0.16 | 4.6 ± 0.15 | 7.1 ± 0.43 | |
| α | 0.73 | 0.67 | 0.85 | |
| A61603 | Emax | 51.3 ± 2.0 (8) | 12.7 ± 0.49 (6) | 2.0 ± 0.08 (14) |
| pEC50 | 9.5 ± 0.17 | 7.8 ± 0.13 | 7.45 ± 0.22 | |
| α | 1.1 | 1.1 | 1.0 | |
| Oxymetazoline | Emax | 16.6 ± 0.9 (8) | N.D. | 4.6 ± 0.13 (17) |
| pEC50 | 9.3 ± 0.36 | N.D. | 7.2 ± 0.10 | |
| α | 0.35 | N.D | 2.3 |
Values are mean ± SEM of n (in brackets) independent experiments N.D.: not determined
Characterization of ERK1/2 phosphorylation induced by oxymetazoline and other adrenergic agonists
Prazosin (α1‐adrenoceptor antagonist) (300 nM), was used to examine the contribution of α1A‐adrenoceptors to ERK1/2 phosphorylation mediated by oxymetazoline. The same protocol was used for noradrenaline (reference agonist) and A61603 (an imidazoline highly selective for α1A‐adrenoceptors). Prazosin produced a rightward shift (approximately 10‐fold) of the concentration–response curves to noradrenaline (Figure 2A) and A61603 (Figure 2B), indicating involvement of α1A‐adrenoceptors but was much less effective in antagonizing responses to oxymetazoline (Figure 2C). Together, these data suggested that oxymetazoline increases ERK1/2 phosphorylation by activating a receptor other than the α1A‐adrenoceptor or by binding to a site on the α1A‐adrenoceptor distinct from that identified by noradrenaline. The maximum response produced by noradrenaline and A61603 was inhibited by pre‐incubation with UBO‐QIC (100 nM) (Gαq inhibitor), whereas that to oxymetazoline was unaffected (Figure 2D–F). PTX (1 ng·mL−1) (Gαi/o inhibitor) pretreatment did not inhibit ERK1/2 phosphorylation to A61603 (Figure 2G), slightly enhanced the maximum response to noradrenaline (Figure 2H) but abolished the response to oxymetazoline (Figure 2I). Importantly, we found that oxymetazoline produced robust ERK1/2 phosphorylation in untransfected CHO‐K1 cells (Figure 3B).
Figure 2.
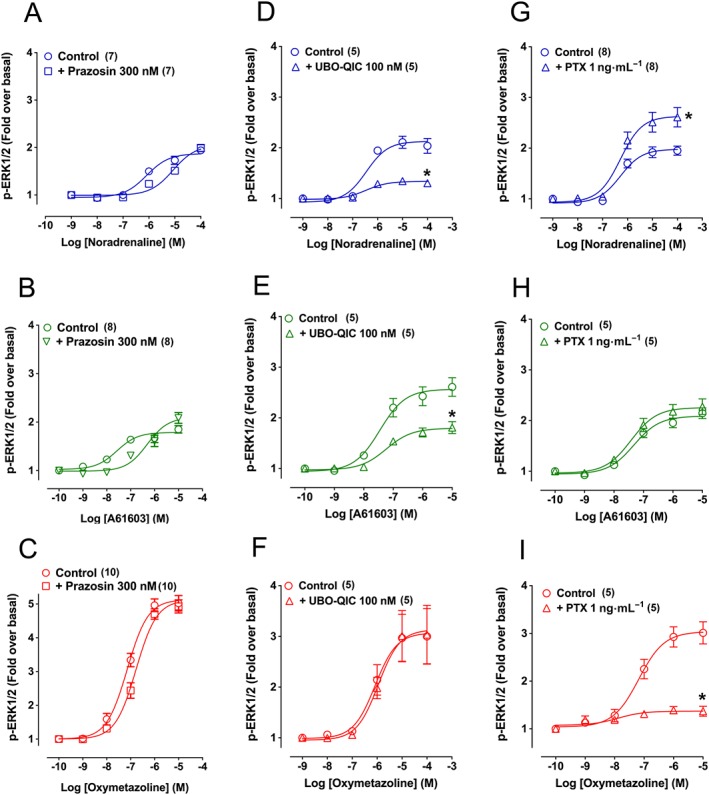
Effect of the α1‐adrenoceptor antagonist prazosin, the Gq inhibitor UBO‐QIC or the Gi/o inhibitor PTX on ERK1/2 phosphorylation (p‐ERK1/2) produced by noradrenaline, A61603 and oxymetazoline in CHO‐K1 cells expressing human α1A‐adrenoceptors. Cells were stimulated for 5 min in the presence of increasing concentrations of noradrenaline, A61603 and oxymetazoline in the absence or presence of prazosin 300 nM (pre‐incubated for 30 min; A–C), UBO‐QIC 100 nM (pre‐incubated for 30 min; D–F) or PTX 1 ng·mL−1 (pre‐incubated for 12–18 h; G–I). Each point represents mean ± SEM from n (in brackets) independent experiments. *P < 0.05 in relation to the control maximum response.
Figure 3.
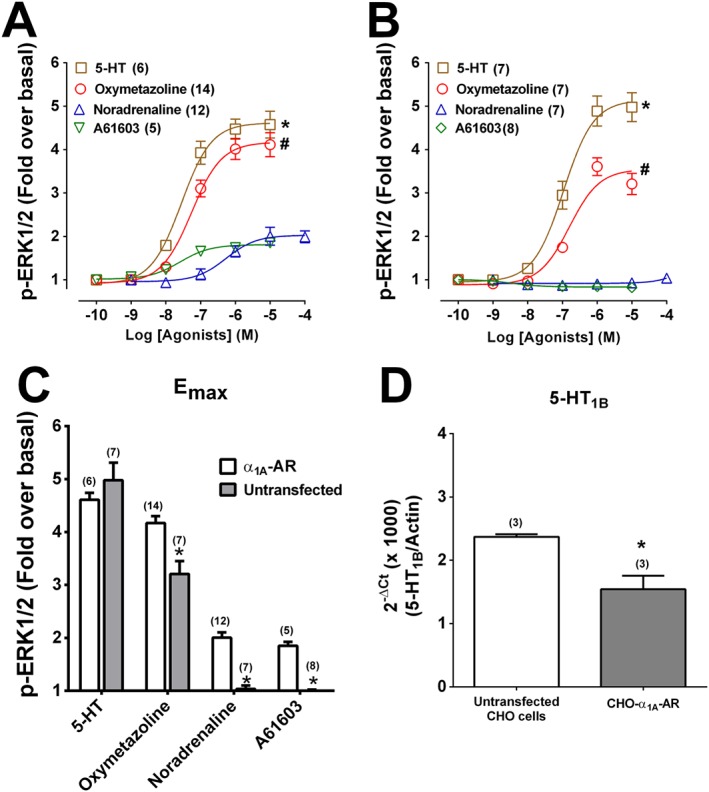
ERK1/2 phosphorylation (p‐ERK1/2) produced by 5‐HT, oxymetazoline, noradrenaline, A61603 in CHO‐K1 cells expressing human α1A‐adrenoceptors (AR) or untransfected CHO‐K1 cells. In (A) CHO‐K1 cells expressing human α1A‐adrenoceptors were stimulated for 5 min in the presence of increasing concentrations of 5‐HT, noradrenaline, A61603 and oxymetazoline. In (B) untransfected CHO‐K1 cells were stimulated for 5 min in the presence of increasing concentrations of 5‐HT, noradrenaline, A61603 and oxymetazoline. (C) Comparison of the maximum response (Emax) of agonists in CHO‐K1 cells expressing human α1A‐adrenoceptors or untransfected CHO‐K1 cells. n values in brackets; P < 0.05 in relation to the maximum response of *noradrenaline or #oxymetazoline in CHO‐K1 cells expressing human α1A‐adrenoceptors. (D) Transcript levels of 5‐HT1B receptors in CHO‐K1 cells expressing human α1A‐adrenoceptors or untransfected CHO‐K1 cells.
The role of 5‐HT1B receptors in ERK1/2 phosphorylation stimulated by oxymetazoline
We identified the 5‐HT1B receptor as an alternative target for oxymetazoline (http://www.guidetopharmacology.org/download.jsp) in conjunction with publically available RNA sequencing data for CHO‐K1 cells (Baycin‐Hizal et al., 2012). The CHO‐K1 transcriptome is available on NCBI Gene Expression Omnibus (Accession number GSE75521). Table S1 provides expression values for all GPCRs common to the CHO‐K1 sequence data.
Oxymetazoline is a high‐affinity agonist at both α1A‐adrenoceptor and α2A‐adrenoceptors (pEC50 values of 8.2 and 8.6 respectively) (Uhlen et al., 1994), but lower affinity for all remaining α‐adrenoceptors (pKi 6.2–6.7). It also has high affinity for 5‐HT1B and 5‐HT1D receptors (pKi 9.5 and 9.4, Law et al., 1998), and acts at Gαi/o‐coupled 5‐HT1B receptors to inhibit forskolin‐stimulated adenylate cyclase activity (Schoeffter and Hoyer, 1991). The CHO‐K1 RNA sequence data indicated that the 5‐HT1B receptor is expressed but not the 5‐HT1D receptor, α2A‐adrenoceptor or other α‐adrenoceptors (Table S1). Since earlier studies show that CHO‐K1 cells endogenously express low densities of 5‐HT1B receptors (Giles et al., 1996), we conducted functional studies to examine their contribution to oxymetazoline responses.
5‐HT increased ERK1/2 phosphorylation with similar potency and efficacy to oxymetazoline in CHOα1A‐adrenoceptor cells (Figure 3A) and also in untransfected CHO‐K1 cells (Figure 3B). In contrast, in untransfected CHO‐K1 cells, noradrenaline, A61603, methoxamine or phenylephrine did not increase ERK1/2 phosphorylation (Figure 3C, Supporting Information Figure S1). We verified using real time qPCR that transcripts for 5‐HT1B receptors are present in both untransfected CHO‐K1 and in CHOα1A‐adrenoceptor cells (Figure 3D). Concentration response curves to 5‐HT were right‐shifted 10‐fold by SB216641 (5‐HT1B antagonist; 300 nM) (Figure 4A) whereas prazosin was ineffective (Figure 4B). ERK1/2 phosphorylation to 5‐HT was unaffected by UBO‐QIC (Figure 4C) but significantly decreased by pretreatment with 1 ng·mL−1 PTX (Figure 4D).
Figure 4.
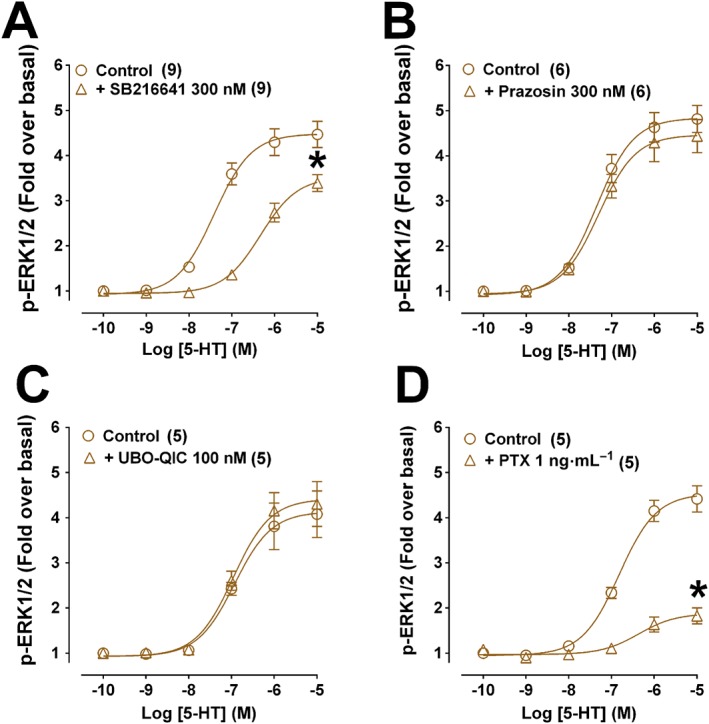
Effect of the 5‐HT1B antagonist SB216641, the α1‐adrenoceptor antagonist prazosin, the Gq‐inhibitor UBO‐QIC, or the Gi/o‐inhibitor PTX on ERK1/2 phosphorylation produced by 5‐HT in CHO‐K1 cells expressing human α1A‐adrenoceptors. Cells were stimulated for 5 min in the presence of increasing concentrations of 5‐HT in the absence or presence of SB216641 (300 nM, pre‐incubated for 30 min; A), prazosin (300 nM, pre‐incubated for 30 min; B), UBO‐QIC (100 nM, pre‐incubated for 30 min; C) or PTX (1 ng.mL‐1, pre‐incubated for 12–18 h; D). Each point represents mean ± SEM of n (in brackets) independent experiments. *P < 0.05 in relation to the maximum response of the control.
SB216641 (300 nM) reduced the potency of oxymetazoline 3.5‐fold and the maximum response by ~30% (Figure 5C). The potency of oxymetazoline was decreased approximately ninefold by prazosin plus SB216641 (Figure 5D). Together with the UBO‐QIC and PTX inhibition, this indicated that oxymetazoline interacts with both α1A‐adrenoceptors and 5‐HT1B receptors, with the net effect on ERK1/2 phosphorylation due primarily to the activation of 5‐HT1B receptors. The response to other α1A‐adrenoceptor agonists may be modulated by the presence of 5‐HT1B receptors in CHO‐K1 cells, as SB216641 decreased maximum ERK1/2 phosphorylation in response to noradrenaline and A61603 (Figure 5A,B), while prazosin had low potency in antagonizing ERK1/2 responses to these two agonists (Figure 2A,B).
Figure 5.
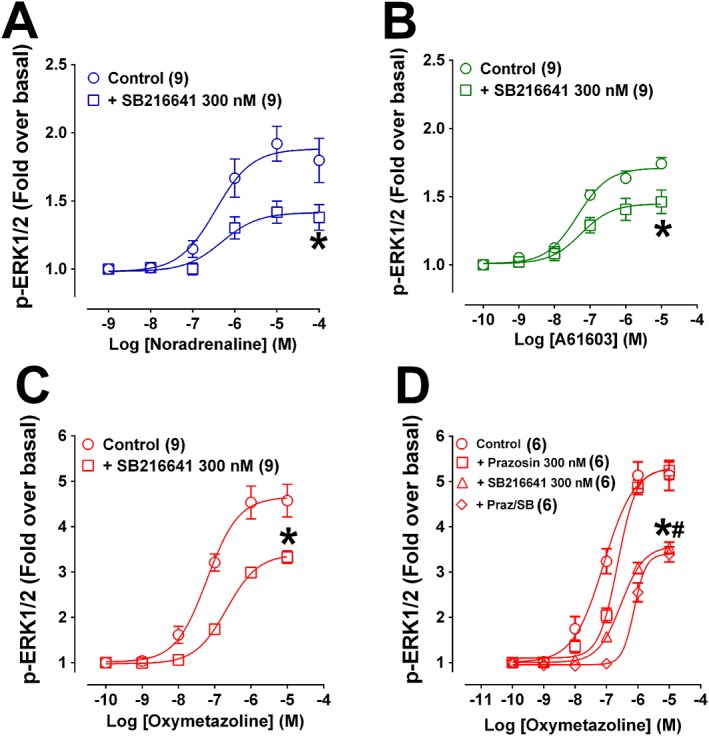
Effect of the 5‐HT1B antagonist SB216641 on ERK1/2 phosphorylation produced by noradrenaline, A61603 or oxymetazoline in CHO‐K1 cells expressing human α1A‐adrenoceptors. Cells were stimulated for 5 min in the presence of increasing concentrations of agonist in the absence or presence of SB216641 (300 nM, pre‐incubated for 30 min; A–C). In (D) the effect of SB216641 (300 nM, pre‐incubated for 30 min), prazosin (300 nM, pre‐incubated for 30 min) or SB216641 plus prazosin on oxymetazoline‐induced p‐ERK1/2. Each point represents mean ± SEM of n (in brackets) independent experiments. *P < 0.05 in relation to the maximum response of the control. # P < 0.05 in relation to the maximum response of oxymetazoline curve in the presence of prazosin.
ERK1/2 phosphorylation in HEK293 cells was also measured in response to the α1‐adrenoceptor agonists and 5‐HT (Supporting Information Figure S3), since these cells do not express 5‐HT1B or α1A‐adrenoceptors (Supporting Information Table S1). HEK293 cells showed no ERK1/2 response to A61603, oxymetazoline, phenylephrine or 5‐HT whereas cells transiently transfected with α1A‐adrenoceptor showed robust ERK1/2 phosphorylation in response to A61603, with smaller responses to methoxamine, phenylephrine and 5‐HT. Oxymetazoline was a weak partial agonist for ERK1/2 phosphorylation in HEK293 cells whereas noradrenaline increased ERK1/2 phosphorylation in both parental and transfected HEK293 cells.
Ca2+ mobilization and cAMP accumulation are not stimulated by adrenergic agonists in untransfected CHO‐K1 cells
Ca2+ mobilization (Supporting Information Figure S2A) or cAMP accumulation (Supporting Information Figure S2B) were not increased by noradrenaline, methoxamine, phenylephrine and A61603, or by 5‐HT (Supporting Information Figure S2E,F) in untransfected CHO‐K1 cells. 5‐HT also failed to affect Ca2+ mobilization or cAMP accumulation in CHOα1A‐adrenoceptor cells (Supporting Information Figure S2C,D).
Oxymetazoline promotes cAMP accumulation in the presence of 1 μM forskolin but not following pretreatment of CHOα1A‐adrenoceptor cells with PTX
We next examined whether the inability of oxymetazoline to increase cAMP accumulation is due to the simultaneous activation of endogenous Gαi/o‐coupled 5‐HT1B receptors and Gαq‐coupled α1A‐adrenoceptors, by examining inhibition of forskolin‐induced cAMP accumulation by oxymetazoline and 5‐HT in untransfected and in CHOα1A‐adrenoceptor cells. 5‐HT inhibited cAMP accumulation to forskolin (1 μM) in both cell types (pEC50 CHOα1A‐adrenoceptor cells: 8.6 ± 0.44; pEC50 untransfected CHO‐K1 cells: 8.9 ± 0.33) (Figure 6A,B). Oxymetazoline inhibited forskolin‐induced cAMP accumulation only in untransfected CHO‐K1 cells (pEC50: 8.9 ± 0.46) whereas in CHOα1A‐adrenoceptor cells, oxymetazoline promoted a robust increase in cAMP accumulation in the presence (pEC50: 8.1 ± 0.40; Figure 6A,B) but not in the absence of forskolin, even following pretreatment with PTX. This suggests that oxymetazoline‐stimulated coupling of endogenously expressed 5HT1B receptors to Gαi/o proteins does not inhibit the cAMP response (Figure 6C).
Figure 6.
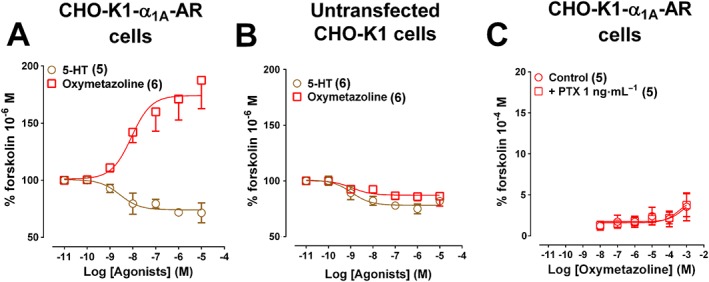
Effects of oxymetazoline and 5‐HT on forskolin‐stimulated cAMP accumulation in CHO‐K1 cells expressing human α1A‐adrenoceptors (AR) or untransfected CHO cells. CHO‐K1‐α1A‐adrenoceptor cells (A) or untransfected CHO cells (B) were stimulated for 15 min in the presence of increasing concentrations of oxymetazoline or 5‐HT and then incubated with forskolin (1 μM) for 30 min. CHO‐K1‐α1A‐adrenoceptor cells (C) were also stimulated with oxymetazoline for 30 min in the absence or presence of PTX (1 ng.mL‐1 pre‐incubated for 12‐18 h). Each point represents mean ± SEM of n (in brackets) independent experiments.
Agonist bias at α1A‐adrenoceptors stably expressed in CHO‐K1 cells
Signalling bias at α1A‐adrenoceptors displayed by noradrenaline, phenylephrine, methoxamine and A61603 was quantified (Figure 7). Oxymetazoline was excluded due to the small cAMP response (Figure 1B) and off‐target effects (Figure 1C). Concentration–response data (Figure 1) was used to determine ligand bias, and the operational model used to derive a transduction coefficient (τ/KA or TR) for each agonist at each pathway (Supporting Information Table S2). LogTR values were then normalized to noradrenaline at each pathway (LogTRn) (Supporting Information Table S2) and compared across different signalling pathways to give a ΔLogTRn (agonist bias) value (Figure 7). Lack of biased agonism compared to the reference agonist (noradrenaline) results in values of ΔLogTRn of 0 between pathways (Student's t‐tests on raw LogTR data rather than data normalized to norepinephrine as shown in Supporting Information Table S3). Phenylephrine and to an even greater extent methoxamine showed bias towards ERK1/2 phosphorylation compared to Ca2+ mobilization (Figure 7B) and cAMP accumulation (Figure 7C), whereas A61603 showed bias towards cAMP accumulation compared to ERK1/2 phosphorylation (Figure 7C).
Figure 7.
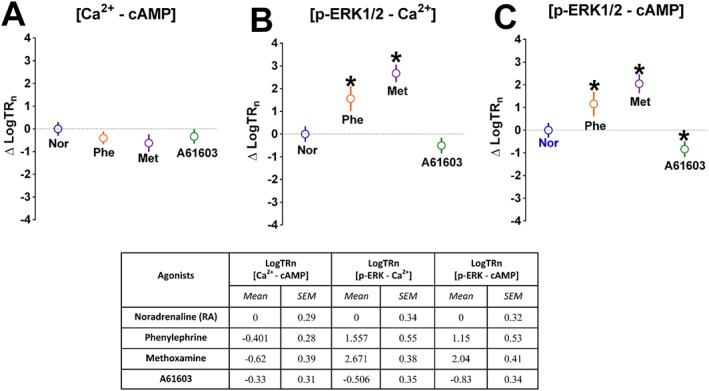
Ligand bias (ΔLogTRn) across different signalling pathways compared to the reference agonist, noradrenaline. The LogTR values were normalized to that of noradrenaline at each pathway (LogTRn) (Supporting Information Table S2) and compared across different signalling pathways to give a ΔLogTRn (ligand bias) value. *P < 0.05 in relation to the reference agonist noradrenaline. Student's t‐tests were performed on the raw LogTR data (Supporting Information Table S3) to avoid propagation of error. Values expressed as mean ± SEM of n independent experiments (Figure 1).
Discussion
The capacity of drugs to display bias towards different signalling pathways has important therapeutic implications, both for development of new therapies and for continuing assessment of existing therapies, particularly those with adverse on‐target effects. In an experimental setting, bias or functional selectivity has been defined strictly in terms of conformational bias, that is, the capacity of two drugs to induce or stabilize distinct receptor conformations displaying measurably different coupling towards effectors for two or more signalling pathways (Kenakin and Miller, 2010). Elegant NMR studies of the β2‐adrenoceptor have provided direct evidence that biased agonists promote different receptor conformations, with Gα‐biased ligands favouring movement of TM6 and β‐arrestin‐biased ligands favouring altered TM7 conformations (Liu et al., 2012). Thus, the concept and the translational potential of biased agonism are well‐founded. On the other hand, it is important to consider all factors that may contribute to the observation of apparent bias. We show here that compared to noradrenaline or A61603, oxymetazoline behaved as a super‐agonist for ERK1/2 phosphorylation, a partial agonist for Ca2+ mobilization, and failed to promote significant cAMP accumulation in CHOα1A‐adrenoceptor cells. However, the profound ERK1/2 phosphorylation response to oxymetazoline is not related to conformational bias, but instead reflects off‐target effects at 5‐HT1B receptors endogenously expressed in CHO‐K1 cells.
This finding highlights one of the difficulties in concluding that agonist behaviour reflects authentic conformational bias. Indeed, there are many issues that can confound experiments designed to test for biased agonism that also compromise the translation of bias in recombinant cells to in vivo therapeutic benefit. We have comprised a checklist of factors that may be important in studies of bias (Table 2). For example, our study demonstrates strategies for detecting off‐target effects, such as the need to check whether all agonists display negligible responses in untransfected cells, across the entire set of signalling outputs under investigation. If this is not the case, two lines of evidence should be sought. RNA sequencing data for commonly used cell lines is now more widely available, and can be used to assess the presence of GPCR mRNAs in host cells (Uhlen et al., 2015). While there is not always a close correlation between steady‐state mRNA and protein levels, the presence of receptor expression is an important pointer for further studies (Supporting Information Table S1). Complementary evidence can be found in the IUPHAR Guide to Pharmacology (http://www.guidetopharmacology.org), the Psychoactive Drug Screening Program Ki database (https://kidbdev.med.unc.edu/databases/ kidb.php) and the literature for off‐target binding or activity by the agonist in question. Information on candidate receptors can be cross‐matched with global RNA sequence data or with focused RT‐qPCR data. Experimentally, the contribution of candidate receptors can be checked by the use of suitable antagonists and/or by confirming a loss of agonist response in cells lacking the receptor.
Table 2.
Checklist for the determination of bias
| Demonstration of ligand bias | |||
|---|---|---|---|
| Finding | Refs | Experimental evidence | |

|
Biased agonism (conformational bias) | a,b | 1. Bias can be quantified using the operational model of agonism. Biased agonists display a ΔΔLog(τ/KA) value significantly different from 0 relative to the reference agonist. |
| 2. In some cases agonists may display a reversal of efficacy or potency across two independent signalling outputs | |||

|
Protean agonism (dual efficacy ligand) | c | A compound acting as an inverse agonist for one signalling pathway acts as an agonist for a second pathway |
| Confounding factors | |||
|---|---|---|---|
| Factor | Refs | Experimental Resolution | |
| 1. System bias | |||

|
Off‐target activity | d | 1. Demonstrate lack of response in non‐transfected cells, including all signalling outputs with all agonists |
| 2. Demonstrate biased agonism in at least 2 unrelated cell lines | |||

|
Choice of reference agonist | e | Choice of endogenous agonist as reference may be problematic if it has broad target specificity that includes related receptor subtypes with endogenous expression in host cells |

|
Partial agonism | c,f | Biased agonism must be distinguished from partial agonism. In the latter case apparent bias may reflect signal strength for each assay and not require distinct receptor conformations |

|
Level of receptor expression | g,h | 1. Agonist efficacy is altered in cells with receptor overexpression |
| 2. Effects on observed bias may be skewed depending on signalling assay, therefore test for bias in cells with at least two substantially different receptor expression levels | |||

|
Efficiency of coupling | d,e | Exercise caution when including signalling outputs with very high coupling efficiency and highly redundant upstream effectors (for example, ERK1/2 phosphorylation) |

|
Relevance to cells of therapeutic interest | i | 1. Use human cell background where possible |
| 2. Follow up observations in therapeutically relevant cells or isolated tissues, and with in vivo experiments | |||
| 2. Observational bias | |||

|
Kinetic effects | j | 1. Determine kinetic profiles of biased agonists relative to reference compound |
| 2. Carefully consider choice of time points for each signalling assay in light of kinetic profiles | |||
References: (a) (Evans et al., 2011), (b) (Thompson et al., 2016), (c) (Kenakin and Miller, 2010), (d) current study, (e) (van der Westhuizen et al., 2014), (f) (Luttrell et al., 2015), (g) (Hutchinson et al., 2005), (h) (Sato et al., 2007), (i) (Broad et al., 2016), (j) (Klein Herenbrink et al., 2016)
The choice of host cells for GPCR expression is clearly an important consideration. Many groups have used HEK293 cells and we chose these as a 5‐HT1B receptor‐deficient host cell line. However, like CHO‐K1, HEK293 cells endogenously express many known and orphan GPCRs (Table S1). In untransfected HEK293 cells, noradrenaline produced a substantial ERK1/2 response, likely associated with endogenous expression of α2C‐adrenoceptors. This was observed previously in HEK293 cells stably expressing β2‐adrenoceptors, and verified by demonstrating ERK1/2 phosphorylation to the α2‐adrenoceptor agonist UK14, 304, and inhibition of the noradrenaline response by the selective antagonist rauwolscine (van der Westhuizen et al., 2014). In some cases, cell choice overcomes problems associated with confounding endogenous GPCRs. For example, HEK293 cells display robust expression of adenosine A2A and A2B receptors (Supporting Information Table S1), but these are not present in CHO‐K1 cells. In contrast the protease‐activated receptor subtypes PAR1 and PAR2 are expressed in both CHO‐K1 and HEK293 cells, indicating the need for an alternative host cell.
Clinical translation of biased agonism is of critical importance, and studies in recombinant cells should be followed up by experiments in target cells or isolated tissues with direct therapeutic relevance. As described above, the μ‐receptor agonist TRV130 (DeWire et al., 2013) and the κ‐receptor agonist triazole 1.1 (Brust et al., 2016) display consistent patterns of bias in HEK293 or CHO‐K1 cells expressing receptors recombinantly compared to native cells or whole animal experiments. In other cases, however, bias or overall pharmacology may differ markedly depending on the experimental system. For example, a comparison of the κ‐receptor agonists ICI204448 and asimadoline provides a cautionary tale of system effects related to receptor species and the difficult transition from recombinant cell studies through to animal models and human samples (Broad et al., 2016). While ICI204448 behaves consistently, studies on asimadoline reveal substantial differences in efficacy and potency between recombinant mouse and human receptors expressed in HEK293 cells and native mouse and human colon samples. The authors suggest that asimadoline is a weak partial agonist, and that this attribute is unmasked only in the human colon system where there may be a lower abundance of κ‐receptors, distinct post‐translational modifications of the C‐terminus that reduce effector coupling, or alternative protein–protein interactions.
Further confounding influences affecting the identification or quantification of biased agonism are summarized in Table 2. In principle, the contribution of cell background (system bias) and the particular signalling output being measured (observational bias) should be controlled by the use of a suitable reference agonist (Evans et al., 2011; van der Westhuizen et al., 2014; Klein Herenbrink et al., 2016). Endogenous agonists are frequently chosen as the reference compound, even though for most receptor families, these agonists display little or no subtype selectivity. This markedly increases the risk of off‐target effects at endogenous receptor subtypes, and suggests that more selective compounds may be more suitable reference agonists (van der Westhuizen et al., 2014). A second important consideration is that optimization of signalling assay measurement time is often done using the reference agonist. This becomes problematic if the kinetics of receptor binding by the reference agonist differs appreciably from that of test compounds (Klein Herenbrink et al., 2016). The bias observed under such circumstances may reflect agonist residence time at the receptor rather than the kinetics of the signalling output being measured, as elegantly demonstrated for partial agonists at the dopamine D2 receptor (Klein Herenbrink et al., 2016).
Oxymetazoline is a weak partial agonist at the α1A‐adrenoceptor, raising a third confounding influence on observations of bias. Partial agonism may be mistakenly attributed to conformational bias; however, distinct receptor states are not necessary to explain findings reflecting that partial agonists display lower efficacy for signalling outputs that are poorly coupled to receptor activation (Kenakin and Miller, 2010). This appears to be the case for oxymetazoline acting at the α1A‐adrenoceptor where cAMP concentration–response curves, even to high efficacy agonists like noradrenaline and A61603, indicate less efficient coupling compared to Ca2+ release, as potency values are close to 2 orders of magnitude lower (Table 1). One explanation for the failure of oxymetazoline to stimulate cAMP accumulation could be the simultaneous activation of the 5‐HT1B receptor to couple to inhibitory Gαi/o proteins. This was not the case, however, as PTX pretreatment failed to unmask an increase in cAMP accumulation to oxymetazoline in CHOα1A‐adrenoceptor cells (Figure 6C), even though oxymetazoline caused a weak inhibition of the cAMP response in untransfected cells (Figure 6B). However, in the presence of 1 μM forskolin, oxymetazoline produced robust cAMP accumulation in CHOα1A‐adrenoceptor cells. Although the mechanism is not clear, forskolin is known to enhance the activation of adenylyl cyclase by hormones or neurotransmitters in other cell systems (Mokhtari et al., 1988; Paoletta et al., 2014).
Comparison of our cAMP and ERK1/2 data illustrates the point about differences in coupling efficiency between signalling pathways (Table 2). In CHOα1A‐adrenoceptor cells, oxymetazoline couples to the 5‐HT1B receptor such that it promotes a substantially greater ERK1/2 response than noradrenaline or A61603, yet at the same time coupling of oxymetazoline to the α1A‐adrenoceptor overshadows the capacity of the 5‐HT1B receptor to inhibit cAMP accumulation in these cells. While 5‐HT1B receptor‐mediated ERK1/2 phosphorylation requires Gαi/o coupling and is largely blocked by PTX (Figures 2I and 4D), there are addtional downstream effectors including Gβγ and β‐arrestins that may amplify this response (Wurch and Pauwels, 2000; Wacker et al., 2013). More generally, ERK1/2 phosphorylation can be stimulated by receptor coupling to Gαs, Gαq/11, Gαi/o and β‐arrestins via a complex network of signalling pathways, and it has been observed that agonist bias is most likely to favour this output (van der Westhuizen et al., 2014). We also saw preferential bias towards ERK1/2 phosphorylation over Ca2+ mobilization and cAMP accumulation for phenylephrine and methoxamine in CHOα1A‐adrenoceptor cells.
Signalling redundancy could in principle mask authentic conformational bias, as two agonists may have similar efficacy or potency for ERK1/2 phosphorylation despite utilizing distinct upstream effectors. This means that a basic definition of effectors and signalling pathways linked to a particular response will facilitate the interpretation of biased agonism. In addition, the cellular location of ERK1/2 phosphorylation, in particular cytosolic versus nuclear ERK1/2, depends on individual agonist‐GPCR‐effector interactions (Halls et al., 2016), and has implications for cellular events governed by cytosolic phosphorylation cascades, cytoskeletal changes, or regulation of gene transcription by nuclear signalling. Interestingly, compartmentalized Ca2+ release is also regulated by distinct signalling pathways. In cardiomyocytes, Golgi Ca2+ release in response to β1‐adrenoceptor stimulation occurs through a cAMP‐Epac/PKA‐PLC pathway, distinct from global sarcoplasmic reticulum Ca2+ release that governs contractile function (Yang et al., 2015). Likewise, in HEK293 cells expressing the β2‐adrenoceptor, adrenaline‐stimulated Ca2+ release is dependent on a Gαs‐EPAC‐Rap2B‐PLCε pathway (Schmidt et al., 2001). It is important to note that the effect of conformational bias on signalling must reflect the interaction between GPCRs and the primary effector protein. Thus if cAMP accumulation and Ca2+ release both result predominantly from coupling of a receptor to Gαs, there can be no authentic bias though there may be differences in agonist efficacy or potency due to signal strength effects.
The level of GPCR expression is also a major concern in studies of biased agonism. For example, in CHO‐K1 cells with relatively high α1A‐adrenoceptor expression, A61603 displays a significant 8.6‐fold bias towards cAMP accumulation compared to Ca2+ release (Evans et al., 2011), whereas in the present study using low‐expressing cells, A61603 does not show significant bias between these two pathways. It could be argued that changes in receptor density should alter the ability of all agonists to activate a particular signalling pathway, but would not change the bias of ligands relative to each another or to a reference agonist, since Log(τ/KA) values change linearly with receptor density (Kenakin et al., 2012; Luttrell et al., 2015). This should hold true in systems where the change in receptor density does not alter the ability of the receptor to interact with one or more signalling proteins. However, the potential of GPCRs to couple to multiple signalling pathways and the prevalence of an individual pathway may be dependent on the abundance of receptors. For instance, the ability of Gαs‐coupled receptors to stimulate PLC decreases in cells expressing low levels of β1‐ or β2‐adrenoceptors (Zhu et al., 1994). In CHO‐K1 cells expressing the β3‐adrenoceptor, p38 MAPK responses are influenced by receptor abundance due to an interaction between cAMP and p38 MAPK signalling (Sato et al., 2007). In cells with higher receptor abundance, increased cAMP accumulation leads to a reduction in p38 MAPK phosphorylation, resulting in accentuated bias between full and partial agonists compared to low‐expressing cells. Therefore, receptor expression levels are an important factor in determining ligand bias by altering the relative ability of GPCRs to interact with effector proteins, leading to different signalling patterns. This phenomenon may complicate the in vivo manifestation of ligand bias as different tissues will display distinct levels of expression of signalling proteins and receptors (Kenakin and Christopoulos, 2013).
In conclusion, a valid description of bias requires that the reference and test agonists all act exclusively at the same receptor subtype, that the measured signalling outputs arise due to direct interaction of the receptor with distinct effector proteins, and that there is no negative interference (or positive crosstalk) between the pathways. Thus, in order to properly control for system bias, it is critical that the reference and test agonists act in a parallel manner. Similarly, observational bias between signalling assays may be engendered by distinct kinetic profiles of reference and test agonists, requiring appropriate control experiments and careful choice of assay times. We have shown that phenylephrine, methoxamine and A61603 display authentic ligand bias at human α1A‐adrenoceptors expressed at relatively low levels in CHO‐K1 cells. In contrast, the high efficacy of oxymetazoline for ERK1/2 phosphorylation was attributable to off‐target effects at 5‐HT1B receptors that are endogenously expressed in these host cells. Therefore, this study highlights the importance of evaluating ligand bias at a variety of different receptor expression levels and assessing the response selectivity (on‐target effects) in order to predict the ligand bias in different systems (cells or tissues). Finally, the off‐target effects of oxymetazoline may also have physiological and therapeutic significance since 5‐HT1B receptors and α1A‐adrenoceptors are found in the human prostate (Lepor et al., 1993; Dizeyi et al., 2004; Siddiqui et al., 2006) and the activation of ERK1/2 phosphorylation in this tissue is known to be related to cell growth and proliferation in prostate cancer or benign prostate hyperplasia (Papatsoris and Papavassiliou, 2001; Bauer et al., 2011; Rodriguez‐Berriguete et al., 2012).
Author contributions
B.A.E., M.S., D.S.H., S.V.and R.J.S. participated in research design. E.D.S.J., N.B., S.M., J.M., M.S. and D.S.H. conducted experiments. E.D.S.J., N.B., M.S. and J.M. performed data analysis. E.D.S.J., M.S., D.S.H., S.V., B.A.E. and R.J.S. wrote or contributed to the writing of the manuscript.
Conflict of interest
The authors declare no conflicts of interest.
Declaration of transparency and scientific rigour
This Declaration acknowledges that this paper adheres to the principles for transparent reporting and scientific rigour of preclinical research recommended by funding agencies, publishers and other organisations engaged with supporting research.
Supporting information
Figure S1 ERK1/2 phosphorylation induced by noradrenaline, phenylephrine, methoxamine, A61603, oxymetazoline and 5‐HT in untransfected CHO‐K1 cells. ERK1/2 phosphorylation stimulated by each agonist for 5 min. Concentration of each agonist was based on the concentration that induces the maximum response in CHO‐K1 cells expressing α1A–adrenoceptors. Each Bar Graph represents the mean ± S.E.M of 3–4 independent experiments. *P < 0.05 in relation to vehicle (ANOVA one‐way followed by Dunnett's multiple comparisons test).
Figure S2 Concentration‐response curves for Ca2+ mobilisation and cAMP accumulation. In (A), Ca2+ mobilisation (n = 6) and in (B) cAMP accumulation (n = 5) following addition of noradrenaline, phenylephrine, methoxamine, A61603 or oxymetazoline in untransfected CHO cells. In (C) Ca2+ mobilisation (n = 5) and (D) cAMP accumulation (n = 7) following addition of 5‐HT in CHO‐K1 cells expressing α1A–adrenoceptors or corresponding responses (E) and (F) in untransfected CHO‐K1 cells. Each point represents mean ± S.E.M of independent experiments.
Figure S3 ERK1/2 phosphorylation induced by noradrenaline (A), phenylephrine (B), methoxamine (C), A61603 (D), oxymetazoline (E) and 5‐HT (F) in HEK293A cells transiently expressing α1A–adrenoceptors and in untransfected HEK293A cells. Panels show the concentration‐dependent ERK1/2 phosphorylation after stimulation by agonists for 5 min. Each point represents mean ± S.E.M of 5 independent experiments.
Table S1 Expression of G protein‐coupled receptors in Chinese hamster ovary CHO‐K1 cells and human embryonic kidney HEK293 cells. RNA sequencing data from Gene Expression Omnibus Accession number GSE75521 (CHO‐K1 cells) and from Uhlen et al. (2015)(HEK293 cells) was filtered for GPCRs listed in the IUPHAR resource file “targets_and_families.csv”. FPKM represents Fragments Per Kilobase of transcript per Million mapped reads, a value that is normalized for both the size of each transcript and the depth of sequencing. GPCRs with FPKM values greater than 1.0 are sorted for CHO‐K1 expression followed by additional GPCRs expressed in HEK293 cells.
Table S2 Log of the transduction ratio τ/KA (LogTR) for each signalling output evaluated. Below LogTR values normalised to noradrenaline (LogTRn) for each signalling output evaluated. Values expressed as mean ± SEM.
Table S3 Statistical analyses between LogTR[pathway 1‐ pathway 2]. Values expressed as mean ± SEM.
Acknowledgements
We thank Dr. Thomas Chang (Roche Bioscience, Palo Alto, CA) for the gift of plasmid containing the human α1A‐4‐adrenoceptor cDNA.
EDdaS Jr was supported by National Council for Scientific and Technological Development (CNPq, Portuguese: Conselho Nacional de Desenvolvimento Científico e Tecnológico) of Brazil, Science without Borders Scholarship program (Portuguese: Programa Ciências sem fronteiras), process 203518/2014‐4. This work was supported by an Australian National Health and Medical Research Council (NHMRC) program grant (1055134; RJS). DSH was supported by a NHMRC Career Development Fellowship (545952) and MS by a NHMRC CJ Martin Fellowship (606763).
da Silva Junior, E. D. , Sato, M. , Merlin, J. , Broxton, N. , Hutchinson, D. S. , Ventura, S. , Evans, B. A. , and Summers, R. J. (2017) Factors influencing biased agonism in recombinant cells expressing the human α1A‐adrenoceptor. British Journal of Pharmacology, 174: 2318–2333. doi: 10.1111/bph.13837.
Contributor Information
Bronwyn A Evans, Email: bronwyn.evans@monash.edu.
Roger J Summers, Email: roger.summers@monash.edu.
References
- Alexander SPH, Davenport AP, Kelly E, Marrion N, Peters JA, Benson HE et al. (2015a). The concise guide to PHARMACOLOGY 2015/16: G protein‐coupled receptors. Br J Pharmacol 172: 5744–5869. [DOI] [PMC free article] [PubMed] [Google Scholar]
- Alexander SPH, Fabbro D, Kelly E, Marrion N, Peters JA, Benson HE et al. (2015b). The concise guide to PHARMACOLOGY 2015/16: Enzymes. Br J Pharmacol 172: 6024–6109. [DOI] [PMC free article] [PubMed] [Google Scholar]
- Bauer RM, Strittmatter F, Gratzke C, Gottinger J, Schlenker B, Reich O et al. (2011). Coupling of alpha1‐adrenoceptors to ERK1/2 in the human prostate. Urol Int 86: 427–433. [DOI] [PubMed] [Google Scholar]
- Baycin‐Hizal D, Tabb DL, Chaerkady R, Chen L, Lewis NE, Nagarajan H et al. (2012). Proteomic analysis of Chinese hamster ovary cells. J Proteome Res 11: 5265–5276. [DOI] [PMC free article] [PubMed] [Google Scholar]
- Broad J, Maurel D, Kung VW, Hicks GA, Schemann M, Barnes MR et al. (2016). Human native kappa opioid receptor functions not predicted by recombinant receptors: implications for drug design. Sci Rep 6: 30797. [DOI] [PMC free article] [PubMed] [Google Scholar]
- Brust A, Croker DE, Colless B, Ragnarsson L, Andersson A, Jain K et al. (2016). Conopeptide‐derived kappa‐opioid agonists (conorphins): potent, selective, and metabolic stable dynorphin A mimetics with antinociceptive properties. j Med Chem 59: 2381–2395. [DOI] [PubMed] [Google Scholar]
- Campos M, Morais PL, Pupo AS (2003). Effect of cyproterone acetate on alpha1‐adrenoceptor subtypes in rat vas deferens. Braz J Med Biol Res 36: 1571–1581. [DOI] [PubMed] [Google Scholar]
- Chen ZJ, Minneman KP (2005). Recent progress in alpha1‐adrenergic receptor research. Acta Pharmacol Sin 26: 1281–1287. [DOI] [PubMed] [Google Scholar]
- Civantos Calzada B, Aleixandre de Artinano A (2001). Alpha‐adrenoceptor subtypes. Pharmacol Res 44: 195–208. [DOI] [PubMed] [Google Scholar]
- Curtis MJ, Bond RA, Spina D, Ahluwalia A, Alexander SP, Giembycz MA et al. (2015). Experimental design and analysis and their reporting: new guidance for publication in BJP. Br J Pharmacol 172: 3461–3471. [DOI] [PMC free article] [PubMed] [Google Scholar]
- Descombes JJ, Stoclet JC (1985). Characterization of two distinct alpha‐adrenoceptor binding sites in smooth muscle cell membranes from rat and bovine aorta. Naunyn Schmiedebergs Arch Pharmacol 329: 282–288. [DOI] [PubMed] [Google Scholar]
- DeWire SM, Yamashita DS, Rominger DH, Liu G, Cowan CL, Graczyk TM et al. (2013). A G protein‐biased ligand at the mu‐opioid receptor is potently analgesic with reduced gastrointestinal and respiratory dysfunction compared with morphine. J Pharmacol Exp Ther 344: 708–717. [DOI] [PubMed] [Google Scholar]
- Dizeyi N, Bjartell A, Nilsson E, Hansson J, Gadaleanu V, Cross N et al. (2004). Expression of serotonin receptors and role of serotonin in human prostate cancer tissue and cell lines. Prostate 59: 328–336. [DOI] [PubMed] [Google Scholar]
- Evans BA, Broxton N, Merlin J, Sato M, Hutchinson DS, Christopoulos A et al. (2011). Quantification of functional selectivity at the human alpha(1A)‐adrenoceptor. Mol Pharmacol 79: 298–307. [DOI] [PubMed] [Google Scholar]
- Evans BA, Sato M, Sarwar M, Hutchinson DS, Summers RJ (2010). Ligand‐directed signalling at beta‐adrenoceptors. Br J Pharmacol 159: 1022–1038. [DOI] [PMC free article] [PubMed] [Google Scholar]
- Giles H, Lansdell SJ, Bolofo ML, Wilson HL, Martin GR (1996). Characterization of a 5‐HT1B receptor on CHO cells: functional responses in the absence of radioligand binding. Br J Pharmacol 117: 1119–1126. [DOI] [PMC free article] [PubMed] [Google Scholar]
- Gray K, Short J, Ventura S (2008). The alpha1A‐adrenoceptor gene is required for the alpha1L‐adrenoceptor‐mediated response in isolated preparations of the mouse prostate. Br J Pharmacol 155: 103–109. [DOI] [PMC free article] [PubMed] [Google Scholar]
- Graziadei I, Zernig G, Boer R, Glossman H (1989). Stereoselective binding of niguldipine enantiomers to alpha 1A‐adrenoceptors labeled with [3H]5‐methyl‐urapidil. Eur J Pharmacol 172: 329–337. [DOI] [PubMed] [Google Scholar]
- Halls ML, Yeatman HR, Nowell CJ, Thompson GL, Gondin AB, Civciristov S et al. (2016). Plasma membrane localization of the mu‐opioid receptor controls spatiotemporal signaling. Sci Signal 9: ra16. [DOI] [PubMed] [Google Scholar]
- Hu ZW, Shi XY, Lin RZ, Hoffman BB (1999). Contrasting signaling pathways of alpha1A‐ and alpha1B‐adrenergic receptor subtype activation of phosphatidylinositol 3‐kinase and Ras in transfected NIH3T3 cells. Mol Endocrinol 13: 3–14. [DOI] [PubMed] [Google Scholar]
- Hutchinson DS, Bengtsson T (2005). alpha1A‐adrenoceptors activate glucose uptake in L6 muscle cells through a phospholipase C‐, phosphatidylinositol‐3 kinase‐, and atypical protein kinase C‐dependent pathway. Endocrinology 146: 901–912. [DOI] [PubMed] [Google Scholar]
- Hutchinson DS, Bengtsson T (2006). AMP‐activated protein kinase activation by adrenoceptors in L6 skeletal muscle cells: mediation by alpha1‐adrenoceptors causing glucose uptake. Diabetes 55: 682–690. [DOI] [PubMed] [Google Scholar]
- Hutchinson DS, Sato M, Evans BA, Christopoulos A, Summers RJ (2005). Evidence for pleiotropic signaling at the mouse beta3‐adrenoceptor revealed by SR59230A [3‐(2‐Ethylphenoxy)‐1‐[(1,S)‐1,2,3,4‐tetrahydronapth‐1‐ylamino]‐2S‐2‐propanol oxalate]. J Pharmacol Exp Ther 312: 1064–1074. [DOI] [PubMed] [Google Scholar]
- Jiao X, Gonzalez‐Cabrera PJ, Xiao L, Bradley ME, Abel PW, Jeffries WB (2002). Tonic inhibitory role for cAMP in alpha(1a)‐adrenergic receptor coupling to extracellular signal‐regulated kinases 1/2. J Pharmacol Exp Ther 303: 247–256. [DOI] [PubMed] [Google Scholar]
- Keiser MJ, Setola V, Irwin JJ, Laggner C, Abbas AI, Hufeisen SJ et al. (2009). Predicting new molecular targets for known drugs. Nature 462: 175–181. [DOI] [PMC free article] [PubMed] [Google Scholar]
- Kenakin T, Christopoulos A (2013). Signalling bias in new drug discovery: detection, quantification and therapeutic impact. Nat Rev Drug Discov 12: 205–216. [DOI] [PubMed] [Google Scholar]
- Kenakin T, Miller LJ (2010). Seven transmembrane receptors as shapeshifting proteins: the impact of allosteric modulation and functional selectivity on new drug discovery. Pharmacol Rev 62: 265–304. [DOI] [PMC free article] [PubMed] [Google Scholar]
- Kenakin T, Watson C, Muniz‐Medina V, Christopoulos A, Novick S (2012). A simple method for quantifying functional selectivity and agonist bias. ACS Chem Nerosci 3: 193–203. [DOI] [PMC free article] [PubMed] [Google Scholar]
- Klein Herenbrink C, Sykes DA, Donthamsetti P, Canals M, Coudrat T, Shonberg J et al. (2016). The role of kinetic context in apparent biased agonism at GPCRs. Nat Commun 7: 10842. [DOI] [PMC free article] [PubMed] [Google Scholar]
- Kukkonen JP, Nasman J, Akerman KE (2001). Modelling of promiscuous receptor‐Gi/Gs‐protein coupling and effector response. Trends Pharmacol Sci 22: 616–622. [DOI] [PubMed] [Google Scholar]
- Lepor H, Tang R, Meretyk S, Shapiro E (1993). Alpha 1 adrenoceptor subtypes in the human prostate. J Urol 149: 640–642. [DOI] [PubMed] [Google Scholar]
- Lin H, Sassano MF, Roth BL, Shoichet BK (2013). A pharmacological organization of G protein‐coupled receptors. Nat Methods 10: 140–146. [DOI] [PMC free article] [PubMed] [Google Scholar]
- Liu JJ, Horst R, Katritch V, Stevens RC, Wuthrich K (2012). Biased signaling pathways in beta2‐adrenergic receptor characterized by 19F‐NMR. Science 335: 1106–1110. [DOI] [PMC free article] [PubMed] [Google Scholar]
- Lowry OH, Rosebrough NJ, Farr AL, Randall RJ (1951). Protein measurement with the Folin phenol reagent. J Biol Chem 193: 265–275. [PubMed] [Google Scholar]
- Luttrell LM, Maudsley S, Bohn LM (2015). Fulfilling the promise of “biased” G protein‐coupled receptor agonism. Mol Pharmacol 88: 579–588. [DOI] [PMC free article] [PubMed] [Google Scholar]
- Mokhtari A, Do Khac L, Harbon S (1988). Forskolin alters sensitivity of the cAMP‐generating system to stimulatory as well as to inhibitory agonists. A study with intact human platelets and guinea pig myometrium. Eur J Biochem 176: 131–137. [DOI] [PubMed] [Google Scholar]
- O'Connell TD, Jensen BC, Baker AJ, Simpson PC (2014). Cardiac alpha1‐adrenergic receptors: novel aspects of expression, signaling mechanisms, physiologic function, and clinical importance. Pharmacol Rev 66: 308–333. [DOI] [PMC free article] [PubMed] [Google Scholar]
- Paoletta S, Tosh DK, Salvemini D, Jacobson KA (2014). Structural probing of off‐target G protein‐coupled receptor activities within a series of adenosine/adenine congeners. PLoS One 9: e97858. [DOI] [PMC free article] [PubMed] [Google Scholar]
- Papatsoris AG, Papavassiliou AG (2001). Molecular ‘palpation’ of BPH: a tale of MAPK signalling? Trends Mol Med 7: 288–292. [DOI] [PubMed] [Google Scholar]
- Perez DM, Karnik SS (2005). Multiple signaling states of G‐protein‐coupled receptors. Pharmacol Rev 57: 147–161. [DOI] [PubMed] [Google Scholar]
- Perez‐Aso M, Segura V, Monto F, Barettino D, Noguera MA, Milligan G et al. (2013). The three alpha1‐adrenoceptor subtypes show different spatio‐temporal mechanisms of internalization and ERK1/2 phosphorylation. Biochim Biophys Acta 1833: 2322–2333. [DOI] [PubMed] [Google Scholar]
- Queiroz DB, Mendes FR, Porto CS, Avellar MC (2002). Alpha1‐adrenoceptor subtypes in rat epididymis and the effects of sexual maturation. Biol Reprod 66: 508–515. [DOI] [PubMed] [Google Scholar]
- Rodriguez‐Berriguete G, Fraile B, Martinez‐Onsurbe P, Olmedilla G, Paniagua R, Royuela M (2012). MAP kinases and prostate cancer. J Signal Transduct 2012: 169170. [DOI] [PMC free article] [PubMed] [Google Scholar]
- Ruan Y, Kan H, Parmentier JH, Fatima S, Allen LF, Malik KU (1998). Alpha‐1A adrenergic receptor stimulation with phenylephrine promotes arachidonic acid release by activation of phospholipase D in rat‐1 fibroblasts: inhibition by protein kinase A. J Pharmacol Exp Ther 284: 576–585. [PubMed] [Google Scholar]
- Sato M, Horinouchi T, Hutchinson DS, Evans BA, Summers RJ (2007). Ligand‐directed signaling at the beta3‐adrenoceptor produced by 3‐(2‐Ethylphenoxy)‐1‐[(1,S)‐1,2,3,4‐tetrahydronapth‐1‐ylamino]‐2S‐2‐propanol oxalate (SR59230A) relative to receptor agonists. Mol Pharmacol 72: 1359–1368. [DOI] [PubMed] [Google Scholar]
- Schmidt M, Evellin S, Weernink PA, Von Dorp F, Rehmann H, Lomasney JW et al. (2001). A new phospholipase‐C‐calcium signalling pathway mediated by cyclic AMP and a Rap GTPase. Nat Cell Biol 3: 1020–1024. [DOI] [PubMed] [Google Scholar]
- Schoeffter P, Hoyer D (1991). Interaction of the alpha‐adrenoceptor agonist oxymetazoline with serotonin 5‐HT1A, 5‐HT1B, 5‐HT1C and 5‐HT1D receptors. Eur J Pharmacol 196: 213–216. [DOI] [PubMed] [Google Scholar]
- Sharpe IA, Thomas L, Loughnan M, Motin L, Palant E, Croker DE et al. (2003). Allosteric alpha 1‐adrenoreceptor antagonism by the conopeptide rho‐TIA. J Biol Chem 278: 34451–34457. [DOI] [PubMed] [Google Scholar]
- Siddiqui EJ, Shabbir M, Mikhailidis DP, Thompson CS, Mumtaz FH (2006). The role of serotonin (5‐hydroxytryptamine1A and 1B) receptors in prostate cancer cell proliferation. J Urol 176: 1648–1653. [DOI] [PubMed] [Google Scholar]
- Silva MA, Megale A, Avellar MC, Porto CS (1999). Expression and pharmacological characterization of alpha1‐adrenoceptors in rat seminal vesicle. Eur J Pharmacol 381: 141–149. [DOI] [PubMed] [Google Scholar]
- Southan C, Sharman JL, Benson HE, Faccenda E, Pawson AJ, Alexander SP et al. (2016). The IUPHAR/BPS Guide to PHARMACOLOGY in 2016: towards curated quantitative interactions between 1300 protein targets and 6000 ligands. Nucleic Acids Res 44: D1054–D1068. [DOI] [PMC free article] [PubMed] [Google Scholar]
- Su TH, Morishima S, Suzuki F, Yoshiki H, Anisuzzaman AS, Tanaka T et al. (2008). Native profiles of alpha(1A)‐adrenoceptor phenotypes in rabbit prostate. Br J Pharmacol 155: 906–912. [DOI] [PMC free article] [PubMed] [Google Scholar]
- Thompson GL, Lane JR, Coudrat T, Sexton PM, Christopoulos A, Canals M (2016). Systematic analysis of factors influencing observations of biased agonism at the mu‐opioid receptor. Biochem Pharmacol 113: 70–87. [DOI] [PubMed] [Google Scholar]
- Uhlen M, Fagerberg L, Hallstrom BM, Lindskog C, Oksvold P, Mardinoglu A et al. (2015). Proteomics. Tissue‐based map of the human proteome. Science 347: 1260419. [DOI] [PubMed] [Google Scholar]
- Uhlen S, Porter AC, Neubig RR (1994). The novel alpha‐2 adrenergic radioligand [3H]‐MK912 is alpha‐2C selective among human alpha‐2A, alpha‐2B and alpha‐2C adrenoceptors. J Pharmacol Exp Ther 271: 1558–1565. [PubMed] [Google Scholar]
- van der Westhuizen ET, Breton B, Christopoulos A, Bouvier M (2014). Quantification of ligand bias for clinically relevant beta2‐adrenergic receptor ligands: implications for drug taxonomy. Mol Pharmacol 85: 492–509. [DOI] [PubMed] [Google Scholar]
- Ventura S, Oliver V, White CW, Xie JH, Haynes JM, Exintaris B (2011). Novel drug targets for the pharmacotherapy of benign prostatic hyperplasia (BPH). Br J Pharmacol 163: 891–907. [DOI] [PMC free article] [PubMed] [Google Scholar]
- Wacker D, Wang C, Katritch V, Han GW, Huang XP, Vardy E et al. (2013). Structural features for functional selectivity at serotonin receptors. Science 340: 615–619. [DOI] [PMC free article] [PubMed] [Google Scholar]
- White CW, Choong YT, Short JL, Exintaris B, Malone DT, Allen AM et al. (2013). Male contraception via simultaneous knockout of alpha1A‐adrenoceptors and P2X1‐purinoceptors in mice. Proc Natl Acad Sci U S A 110: 20825–20830. [DOI] [PMC free article] [PubMed] [Google Scholar]
- Wurch T, Pauwels PJ (2000). Coupling of canine serotonin 5‐HT(1B) and 5‐HT(1D) receptor subtypes to the formation of inositol phosphates by dual interactions with endogenous G(i/o) and recombinant G(alpha15) proteins. J Neurochem 75: 1180–1189. [DOI] [PubMed] [Google Scholar]
- Yang Z, Kirton HM, Macdougall DA, Boyle JP, Deuchars J, Frater B et al. (2015). The Golgi apparatus is a functionally distinct Ca2+ store regulated by the PKA and Epac branches of the beta1‐adrenergic signaling pathway. Sci Signal 8: ra101. [DOI] [PMC free article] [PubMed] [Google Scholar]
- Zhou L, Lovell KM, Frankowski KJ, Slauson SR, Phillips AM, Streicher JM et al. (2013). Development of functionally selective, small molecule agonists at kappa opioid receptors. J Biol Chem 288: 36703–36716. [DOI] [PMC free article] [PubMed] [Google Scholar]
- Zhu X, Gilbert S, Birnbaumer M, Birnbaumer L (1994). Dual signaling potential is common among Gs‐coupled receptors and dependent on receptor density. Mol Pharmacol 46: 460–469. [PubMed] [Google Scholar]
Associated Data
This section collects any data citations, data availability statements, or supplementary materials included in this article.
Supplementary Materials
Figure S1 ERK1/2 phosphorylation induced by noradrenaline, phenylephrine, methoxamine, A61603, oxymetazoline and 5‐HT in untransfected CHO‐K1 cells. ERK1/2 phosphorylation stimulated by each agonist for 5 min. Concentration of each agonist was based on the concentration that induces the maximum response in CHO‐K1 cells expressing α1A–adrenoceptors. Each Bar Graph represents the mean ± S.E.M of 3–4 independent experiments. *P < 0.05 in relation to vehicle (ANOVA one‐way followed by Dunnett's multiple comparisons test).
Figure S2 Concentration‐response curves for Ca2+ mobilisation and cAMP accumulation. In (A), Ca2+ mobilisation (n = 6) and in (B) cAMP accumulation (n = 5) following addition of noradrenaline, phenylephrine, methoxamine, A61603 or oxymetazoline in untransfected CHO cells. In (C) Ca2+ mobilisation (n = 5) and (D) cAMP accumulation (n = 7) following addition of 5‐HT in CHO‐K1 cells expressing α1A–adrenoceptors or corresponding responses (E) and (F) in untransfected CHO‐K1 cells. Each point represents mean ± S.E.M of independent experiments.
Figure S3 ERK1/2 phosphorylation induced by noradrenaline (A), phenylephrine (B), methoxamine (C), A61603 (D), oxymetazoline (E) and 5‐HT (F) in HEK293A cells transiently expressing α1A–adrenoceptors and in untransfected HEK293A cells. Panels show the concentration‐dependent ERK1/2 phosphorylation after stimulation by agonists for 5 min. Each point represents mean ± S.E.M of 5 independent experiments.
Table S1 Expression of G protein‐coupled receptors in Chinese hamster ovary CHO‐K1 cells and human embryonic kidney HEK293 cells. RNA sequencing data from Gene Expression Omnibus Accession number GSE75521 (CHO‐K1 cells) and from Uhlen et al. (2015)(HEK293 cells) was filtered for GPCRs listed in the IUPHAR resource file “targets_and_families.csv”. FPKM represents Fragments Per Kilobase of transcript per Million mapped reads, a value that is normalized for both the size of each transcript and the depth of sequencing. GPCRs with FPKM values greater than 1.0 are sorted for CHO‐K1 expression followed by additional GPCRs expressed in HEK293 cells.
Table S2 Log of the transduction ratio τ/KA (LogTR) for each signalling output evaluated. Below LogTR values normalised to noradrenaline (LogTRn) for each signalling output evaluated. Values expressed as mean ± SEM.
Table S3 Statistical analyses between LogTR[pathway 1‐ pathway 2]. Values expressed as mean ± SEM.