

Abstract
Background
In Ayurveda, pulse examination (nadipariksha) is an important tool to assess the status of three doshas: vata, pitta, and kapha. Long historical use has been seen as a documentation of its efficacy; however, there is a lack of a quantitative measure of the reliability of the pulse examination method. The objective of this study was to test the intrarater and interrater reliability of pulse examination in Ayurveda.
Methods
Fifteen registered Ayurvedic doctors with 3–15 years of experience examined the pulse of 20 healthy volunteers twice, for a total of 600 examinations. The examinations were performed blind and in a random order. Only the current status of dosha-specific methods of pulse examination were considered. Cohen's weighted κ statistic was used as a measure of intrarater and interrater reliability, and a hypothesis of homogeneous diagnosis (random rating) was tested. Following this, we tested whether proportions of ratings were equal between doctors.
Results
According to the Landis and Koch scale, the level of reliability ranged from poor to moderate. It was observed that the doctors more frequently diagnosed a combination of two doshas than a single dosha. The κ values were generally larger for experienced doctors (p = 0.04).
Conclusion
Experience and proper training have important roles in pulse examination.
Keywords: Ayurveda, Dosha, interrater reliability, intrarater reliability, pulse examination
1. Introduction
Diagnostic decision-making in Ayurveda is a complex process. During diagnosis, the physical examination is still a mainstay of the clinical assessment in Ayurveda. Ayurvedic pulse examination i.e., nadipariksha/vidnyanam is the first and most important of the eight diagnostic techniques.1, 2 The original textbooks on Ayurvedic pulse examination describe different types of dosha pulse: vata (V), pitta (P), and kapha (K; Appendix 1). The pulse patterns depend on the different levels and combinations of these three doshas. The sensation of these patterns is expressed in terms of qualitative descriptions3, 4 (Appendix 2). The sensation felt depends greatly on where the doctor places their fingers on the patient's radial pulse, how much pressure they use, and on which level (deep or superficial) they feel the pulse. Consequently, it is important to assess the consistency of these methods.
The traditional method of diagnosis is completely different from Western medicine. In Ayurveda, V, P, and K are the main diagnostic variables. If they are in balance, the patient is healthy. Different combinations or degrees of imbalance indicate a disease or disorder. Diagnosis and prognosis comprise the identification of an imbalance of one or more dosha, and then allows the doctor to establish regimens that reestablish a balance. Pulse examination is a tool used in addition to other diagnostic techniques such as interviewing the patient. Pulse examination can direct the doctor's subsequent investigation, which may comprise methods such as observation or questioning the patient. Specifically, pulse examination allows doctors to refine their classification and, therefore, select and prioritize an appropriate regimen. With more experience and practice of pulse examination, doctors are expected to be able to yield a complete picture of a person's psychophysical status.
Thus, pulse-based diagnosis is an inexpensive, noninvasive, and painless method. However, validity and reliability of the diagnostic method is essential in research. The validity of a diagnostic method can only be assessed by establishing a true diagnosis. In Ayurveda there is a lack of gold standard to which we can compare the pulse examination. The diagnosis can only be obtained from a doctor's judgment. However, because different doctors may obtain different diagnoses, it is difficult to identify which one is the true diagnosis. However, it is possible to quantify the different types of reliability estimates. Intrarater reliability testing is the process by which a method can be shown to give similar results when used by the same raters at different times for the same group of individuals. Further, interrater reliability can be assessed by allowing two or more independent doctors to carry out independent assessments of the same individual. In the present study, we assess both the intrarater and interrater reliability of Ayurvedic pulse examination by including different doctors who are specifically involved in the clinical practice, educational programs, and some who are specifically trained in pulse examination.
2. Methods
2.1. Pulse examination method
In this study, the doctors examined the most commonly observed nadi, the jivanadi (radial artery). The doctors placed their index finger below the radial styloid on the radial artery of the individual as shown in Fig. 1. The middle and ring fingers were placed next to the index finger. The pulse was taken from the left side for the female participants and from the right side for the male participants.
Fig. 1.

Pulse examination.
2.2. Pulse examination outcome variables
In this study, the basic qualities of a V, P, and K pulse and their combinations were assessed. During palpation of the radial pulse, if the throb is felt more strongly under the index, middle, and ring finger, it indicates a V, P, and K pulse, respectively. The sensation of the V pulse pattern is said to be like a snake's curved crawling, the sensation of P is described as a frog's jumping, and in the case of K dominance is described, the doctor senses a pigeon's or swan's smooth and slow movement (Appendix 2).
2.3. Study participants
We included 20 healthy individuals (10 males; age 19 ± 1 years) in the study. The volunteers were students of Sri Sri College of Ayurvedic Science and Research Hospital, Bangalore. Detailed information concerning the study was given to all participants prior to the trial. Written consent was obtained from all participants. An inclusion criterion was that the individuals were aged ≥ 18 years. All participants were in good health and none was on medication. Exclusion criteria included: participants who were hungry or thirsty; participants who had recently been anointed with oil; those who had recently awakened; and those who had recently bathed (Appendix 2). Other exclusion criteria included having diabetes or hypertension, and the use of vasoactive medications including hormone replacement therapy.
2.4. Ayurvedic practitioners/doctors
The study was conducted by 15 registered Ayurvedic doctors affiliated to Sri Sri College of Ayurvedic Science and Research Hospital. Detailed oral and written information was given to numerous doctors. Participation was optional. All participating doctors had completed a bachelor course (Ayurvedacharya) for 5.5 years including a 1-year internship in Ayurveda from India. Twelve of these doctors had completed a 3-year advance course MD (VaidyakNishnant) in Ayurveda. Doctors 3,5,7,10, and 11 are more experienced in the pulse examination. The remaining doctors (13, 14, and 15) did a pulse examination course in Sri Sri Ayurveda Trust for 1 month and are referred to as course-takers. The pulse examination course was taken 3 years, 2 years, and 6 months prior to the study, respectively. All of them have good knowledge of pulse qualities and use this method combined with other diagnostic methods on a regular basis. Detailed information of the level of experience and education is given in Fig. 2.
Fig. 2.

Ayurvedic doctor's clinical experience and educational level.
2.5. Study procedure
The study was conducted at Sri Sri College of Ayurvedic Science and Research Hospital in the morning, between 10.00 am and 11.30 am. All participants had fasted for 2 hours prior to the pulse examination. The doctor examined each participant twice blindly. To avoid a change in pulse patterns by the time difference, the trial was conducted on the same day and within 2 hours.
2.6. Randomization and blinding
Ten male and ten female participants were selected by conducting a randomized selection of second year students from Sri Sri College. As the objective of the study was also to investigate the intrarater reliability of pulse examination, randomization and blinded testing were used to avoid a possible carry-over effect of the first diagnosis. The participants were assigned computerized (SPSS software, Version 19; SPSS Inc, Chicago, IL, USA) random numbers for both the rounds. Blinded testing and randomization were implemented as follows: participants placed their arms (only hand and wrist) through a hole in a curtain separating the doctor from the participant. Prior to showing their hands to the doctors, participants were asked to remove rings, wrist watches, and hand ornaments, and participants wore hand gloves so that doctors could not recognize a participant's hand. The doctors did not speak to any of the participants until the completion of the session. The participants were examined in a random order unknown to the doctors.
2.7. Analysis of experimental results
Cohen's weighted κ statistic is a standard measure of intrarater and interrater reliability.5
In weighted (κw) κ, disagreements of varying gravity (or agreements of varying degree) are weighted accordingly. For example, in an assessment of the reliability of pulse examination, the doctors would probably consider a diagnostic disagreement between V and K pulse to be more serious than between V and V-K pulse. If we use Cohen's κ, it makes no distinction, implicitly treating all agreement (disagreement) equally. Thus, it is necessary to use the proportion of weighted agreement, when different kinds of agreements are to be differentially weighted. Thus, in the present study, we used a distance measure on pulse examinations based on weight vectors proposed by Kurande et al.6
2.7.1. A distance measure for pulse examination
Pulse examination variables arenominal, categorical, and interrelated and can be classified into 10 classes, corresponding to various mixtures of V, P, and K (Fig. 3). Regarding types of combinations, V-P for example, means that V is dominant but P is also present. For V-P-K, all types are equally represented. We thus introduce weight vectors, which for each class indicate the composition in terms of V, P, and K. The weights are given in Table 1. For class V-P, the weight vector is, for example, (2/3, 1/3, 0), indicating the dominance of V over P and the absence of K. For V-P-K the weight vector is (1/3, 1/3, and 1/3) showing that this class is an equal mixture of V, P, and K. In order to compare pulse examination, we have developed a distance measure on pulse diagnoses, which is based on the weight vectors.6 The distance between two classes c1 and c2 with weight vectors w1 = (w11, w12, w13) and w2 = (w21, w22, w23) is defined by the formula:
Fig. 3.

Distances between two classes.
Table 1.
Pulse examination classes, weights, and distance between two pairs.
| Pulse examination classes | Weights for each class | Classes | Distance matrix between classes |
|||||||||
|---|---|---|---|---|---|---|---|---|---|---|---|---|
| C1 | C2 | C3 | C4 | C5 | C6 | C7 | C8 | C9 | C10 | |||
| V | (1, 0, 0) | C1 | 0.00 | 0.47 | 0.47 | 1.41 | 0.94 | 1.25 | 1.41 | 0.94 | 1.25 | 0.82 |
| V-P | (2/3, 1/3, 0) | C2 | 0.47 | 0.00 | 0.47 | 0.94 | 0.47 | 0.82 | 1.25 | 0.82 | 0.94 | 0.47 |
| V-K | (2/3, 0, 1/3) | C3 | 0.47 | 0.47 | 0.00 | 1.25 | 0.82 | 0.94 | 0.94 | 0.47 | 0.82 | 0.47 |
| P | (0,1,0) | C4 | 1.41 | 0.94 | 1.25 | 0.00 | 0.47 | 0.47 | 1.41 | 1.25 | 0.94 | 0.82 |
| P-V | (1/3, 2/3, 0) | C5 | 0.94 | 0.47 | 0.82 | 0.47 | 0.00 | 0.47 | 1.25 | 0.94 | 0.82 | 0.47 |
| P-K | (0, 2/3, 1/3) | C6 | 1.25 | 0.82 | 0.94 | 0.47 | 0.47 | 0.00 | 0.94 | 0.82 | 0.47 | 0.47 |
| K | (0, 0, 1) | C7 | 1.41 | 1.25 | 0.94 | 1.41 | 1.25 | 0.94 | 0.00 | 0.47 | 0.47 | 0.82 |
| K-V | (1/3, 0, 2/3) | C8 | 0.94 | 0.82 | 0.47 | 1.25 | 0.94 | 0.82 | 0.47 | 0.00 | 0.47 | 0.47 |
| K-P | (0, 1/3, 2/3) | C9 | 1.25 | 0.94 | 0.82 | 0.94 | 0.82 | 0.47 | 0.47 | 0.47 | 0.00 | 0.47 |
| V-P-K | (1/3, 1/3, 1/3) | C10 | 0.82 | 0.47 | 0.47 | 0.82 | 0.47 | 0.47 | 0.82 | 0.47 | 0.47 | 0.00 |
K, kapha; P, pitta; V, vata.
This distance measure makes intuitive sense as explained below. The minimal distance (0) occurs when the doctor diagnoses the same dosha the first and second time. The maximal distance (1.41) is obtained when two classes have none of the basic types (V, P, or K) in common. For example, if the doctor diagnoses V both the first and second time D(V, V) = 0. If the doctor diagnoses V the first time and V-P the second time, this means he is able to diagnose at least the dominant dosha and the two diagnoses overlap considerably. In this case, D(V, VP) = 0.47 (Fig. 3). When treating the patient, the doctor looks for a V-alleviating regimen based on both diagnoses. If the doctor first diagnosed V and the second time P, then D(V, P) = 1.41, which demonstrates a total disagreement because these dosha have different qualities. Also, the treatment plans for these doshas are different. In Cohen's weighted κ statistic, squared distance D(c1, c2)2 between classes is used as a measure of agreement. This is in analogy with conventional analysis of variance (ANOVA).7
2.7.2. Hypothesis of homogeneous classification
When a doctor examines an individual several times, it may happen by chance that different diagnoses can be obtained. Suppose n individuals j = 1,...,n are considered and let pdjc be the probability that the doctor (d) chooses a classification (c) for individual (j). Due to the blinding we assume that for each doctor the diagnoses are independent. However the probability of choosing a particular class may differ from individual to individual. The hypothesis of homogeneous classification is by contrast H0 : pdjc = pdc. That is, the probability that the doctor assigns a classification (c) to an individual (j) does not depend on the individual. In other words, under H0, the doctor is essentially performing random diagnoses according to some common probabilities of the various classes. The hypothesis of homogeneous classification is tested using a permutation test.
2.7.3. Quantification of reliability and permutation test
One way to qualify the magnitude of the weighted κ statistic is to use Landis and Koch's (LK) scale as shown in Table 2.8 However, Bakeman et al9 point out that it may be misleading to use one common scale for interpreting κ because the magnitude of κ not only depends on observer accuracy (and hence repeatability), but also on, for example, the number of classes and the population probabilities of each classification. Another approach to quantify the magnitude of the weighted κ is to compare the observed weighted κ with its distribution under the hypothesis H0 of homogeneous classification. One can then compute a p value, i.e., the probability of getting at least as favorable a weighted κ as the observed one, assuming that H0 is true. As a measure of evidence against H0, p values are comparable across different studies. For each doctor, we compute p values by randomly permuting the doctor's diagnoses, which, under H0, do not depend on the individual. A more detailed description of this is given by Kurande et al.6
Table 2.
Interpretation of κ values by Landis and Koch Scale.8
| k values | Strength of agreement |
|---|---|
| < 0.0 | Poor |
| 0.01–0.20 | Slight |
| 0.21–0.40 | Fair |
| 0.41–0.60 | Moderate |
| 0.61–0.80 | Substantial |
| 0.81–1.00 | Almost perfect |
3. Results
3.1. Intrarater reliability (repeatability)
Each doctor diagnosed the pulse twice for each of 20 participants making a total of 600 (15 × 2 × 20) diagnoses. The average distance (i.e., the average of the distances for the 20 pairs of diagnoses made by the doctor), the weighted κ statistic, and a p value for the hypothesis of homogeneous classification (random rating) for each doctor are shown in Table 3. According to the LK scale, these values of the weighted κ indicate a low to moderate level of agreement and two are shown to be negative.
Table 3.
Result of intrarater reliability.
| Doctor's number | Mean distance | Weighted κ value | Landis and Koch scale | p |
|---|---|---|---|---|
| 1 | 0.62 | –0.18 | Poor | 0.99 |
| 4 | 0.55 | –0.02 | Poor | 0.98 |
| 12 | 0.65 | 0.03 | Slight | 0.88 |
| 6 | 0.21 | 0.10 | Slight | 0.82 |
| 2 | 0.57 | 0.12 | Slight | 0.83 |
| 10 | 0.27 | 0.15 | Slight | 0.61 |
| 8 | 0.38 | 0.20 | Slight | 0.58 |
| 14 | 0.55 | 0.21 | Slight | 0.67 |
| 7 | 0.32 | 0.26 | Fair | 0.45 |
| 3 | 0.35 | 0.31 | Fair | 0.47 |
| 9 | 0.44 | 0.34 | Fair | 0.31 |
| 13 | 0.64 | 0.36 | Fair | 0.17 |
| 15 | 0.36 | 0.40 | Fair | 0.11 |
| 5 | 0.32 | 0.48 | Moderate | 0.05 |
| 11 | 0.28 | 0.56 | Moderate | 0.04 |
We assessed the relationship between κ and experience (in number of years; Fig. 4). The highest κ was obtained by the doctor with the most experience. Moreover, the κ values are, in general, higher for the group of experienced doctors and course takers than for the less experienced doctors (p = 0.04 based on one-sided ANOVA; Fig. 5).
Fig. 4.

Kappa values versus experience (in years).
Fig. 5.

Kappa values for all groups.
3.2. Interrater reliability (reproducibility)
The percentages of pairwise κ values within each LK categories poor, slight, fair, and moderate were 53%, 31%,15%, and 1% in the first round, respectively. In the second round, the percentages of pairwise κ values within each LK categories poor, slight, and fair were 42%, 45%, and 13%, respectively (Table 4). The distribution of all the pairwise κ values under the null hypothesis (using permutation) for first round and second round is shown in Fig. 6. The null hypothesis was that all doctors were doing random rating with the same probabilities. No significant evidence against the null hypothesis was found. For the two experienced doctors (5 and 11), with the highest intra-κ values, the inter-κ is only 0.11. Next, for each doctor we computed the average of the 56 times (4 × 14) interdoctor κ values to which the doctor contributed and obtained 15 average interdoctor κ values. The average interdoctor κ values ranged from 0.004 to 0.10, indicating very little agreement between doctors.
Table 4.
Percentage of pairwise κ values within each Landis and Koch category of interrater reliability for pulse examination and number of significant pairwise κ values.
| Landis and Koch scale | Kappa range | Round 1 | Round 2 |
|---|---|---|---|
| Poor | –1.0–0.0 | 53 | 42 |
| Slight | 0.01–0.20 | 31 | 45 |
| Fair | 0.21–0.40 | 15 | 13 |
| Moderate | 0.41–0.60 | 1 | 0 |
| Substantial | 0.61–0.80 | 0 | 0 |
| Almost perfect/perfect | 0.81–1.00 | 0 | 0 |
| No. of significant | – | 0 | 0 |
Fig. 6.

The distribution of all the pairwise κ values under the null hypothesis (using permutation).
3.3. Frequencies of classes
We also tested the frequencies of the classes 1–10 for each doctor. Out of 15 doctors, eight mainly used classes 1–6 and seven used classes 1–6 as well as class 9. The frequencies accumulated by all doctors are shown in Fig. 7. Again this shows that all classes except class 10 were used, and that classes 2, 5, and 6 were the most frequently used, and classes 3, 7, and 8 were the least frequently used.
Fig. 7.

The frequencies accumulated over all doctors.
4. Discussion
Each doctor had low κ values and some even had negative κ values. Accordingly, the p values for the hypothesis of homogeneous diagnosis were large (the smallest was 0.04, followed by 0.05, 0.11, and 0.17). This showed a low level of consistency between the two pulse examinations for the majority of doctors. Moreover, it was observed that the κ was especially small for Doctor 6, even though was small. This was because this doctor only used two classes (2 and 5) for classification. Thus, he could more easily obtain a good level of agreement in terms of the distance measure D just by chance when we compare with the other doctors.
Moreover, pairwise κ and the average interrater κ values showed very little agreement between doctors. Furthermore, these doctors seem to favor different diagnoses because the proportions of ratings vary among doctors. This variability may be due to the complex qualitative pulse terminologies and the application of different pulse-taking procedures in the practice. In the same way, variability in the agreement is due to the reliance on different types of traditional evidence, variation in expertise, and the diversity of educational background and expertise of the doctors.
It was observed that the doctors more frequently diagnosed a combination of two doshasc2 (V-P), c5 (P-V), c6 (P-K) than a single dosha (Fig. 7). P dominates in two of these classes (c5 and c6) and is also present in the third (c2), which indicates that the P dosha was dominant among the individuals. According to Ayurveda, K, P, and V are dominant in children, young, and old people, respectively. In the present study, volunteers were young and revealed P dominance. Moreover, seven different types of dosha pulses (V, P, K, V-P, V-K, P-K and V-P-K) are described in Ayurveda, but doctors also diagnosed other dosha combinations such as P-V, K-V, and K-P.
If we compare the results of the reliability studies in other traditional medicine forms in Asia, the majority of studies report a low level of reliability as observed in the present study. A review of the reliability of traditional East Asian Medicine diagnosis by O’Brien and Birch has reported that in a nonblinded study (conducted by Birch), five meridian therapy practitioners diagnosed the pulse of nine individuals. The range for pulse depth was r (Spearman rank correlation coefficient) = –0.04 (no correlation) to 0.75 (substantial correlation; (average 0.43), pulse rate r = 0.04 (poor correlation) to r = 0.69 (substantial correlation; average 0.38), and pulse strength r = –0.004 (no correlation) to r = 0.93 (almost perfect correlation; average 0.45). In the extension of the same study, two meridian therapy practitioners diagnosed the pulse of 43 individuals. Interrater reliability was significant for pulse rate (κ = 0.29, p < 0.01), but nonsignificant for pulse depth (κ = 0.02, p = 0.82).10 A study conducted by Dang and Zaslawski11 reported low levels of reliability for pulse diagnosis. This study included four experienced traditional Chinese medicine (TCM) practitioners and two recent graduates and one patient with cystic fibrosis. Another interrater study on pulse diagnosis included 35, 29, and 20 TCM students and six individuals in three substudies. The frequencies of significant levels of pulse discrimination in the three substudies were: 25%, 31%, and 17%, respectively.12 In another interrater reliability study, the κ values for pulse location (κ = 0.15) and pulse force(κ = 0.29)were reported for three TCM practitioners and 45 healthy individuals with hypercholesterolemia. In this study, the practitioners could see the patient and had other diagnostic information available.13 Furthermore, interrater reliability of pulse diagnosis in 658 stroke patients using Traditional Korean Medicine also reported κ values ranging from 0.17 to 0.49 between two raters.14 None of the interrater reliability studies were performed blind. However, a few blinded studies have been published in the review of pulse diagnosis. For example, Debata conducted an intrarater assessment of pattern diagnosis based on pulse diagnosis alone. In this study, eight, 12, and 10 volunteers were diagnosed by six, six, and five blindfolded practitioners in three sections, with intrarater reliability of 45.8%, 40.3%, and 64%, respectively.15 Furthermore, a study conducted by Birch10 with one blindfolded meridian practitioner also reported low levels of reliability (0.0018: Kendall coefficient of concordance) on 35 individuals. Kurosu conducted a four blinded intrarater substudy with 17 meridian therapy practitioners and 40 individuals, half of which were healthy and half of which had a medical condition. The mean percentage of agreement between the first and second rating reported for the healthy individuals was a mean of 53% whereas it was 60% for the individuals with a medical condition.16 In Eight-Constitutional Medicine, two blindfolded Korean medicine doctors diagnosed constitutional types based on pulse diagnosis of 31 healthy college students. Mean intrarater agreement for repeated diagnosis was 89% and 66.83% for the two doctors and interrater reliability was poor (κ= 0.232). It was concluded that the doctor's degree of confidence in their own diagnosis) is related to interrater agreement.17 In another Eight-Constitutional Medicine study, three blindfolded practitioners diagnosed participant's constitution by pulse diagnosis. The reliability ranged from good (κ=0.83) to moderate (κ = 0.54) level.18 A comparison between the findings of the reliability studies is difficult because different methods of pulse examination and pulse characteristics were used. Moreover, many studies have not used formal statistical methods to assess reliability. In this paper, we have demonstrated results by using weighted κ statistics and tested the hypothesis using homogeneous classification.
In another study in Ayurveda, a pulse examination expert diagnosed the dosha pulse type twice in 17 healthy individuals in a blind study where the participants were evaluated in a random order.6 The hypothesis of a homogeneous classification was rejected at the 5% significance level (p = 0.02), and the weighted κ for pulse examination was 0.42, which corresponded to moderate agreement using the LK Scale.8 This doctor was an expert in pulse examination and had more than 10 years’ experience in pulse examination. In the present study, the highest intrarater reliability (κ = 0.55) was obtained by the doctor with the most experience. These findings suggest that experience may influence repeatability. It would be of interest to assess the intrarater and interrater reliability among the doctors who have the same number years of experience. Moreover, the largest κ values for intrarater reliability were obtained by the groups of doctors who had experience in pulse diagnosis or had taken a course. This indicates that practice and proper training can improve repeatability.
4.1. Limitations
We note that different results might have been obtained if we had conducted a study on a group of individuals with medical conditions with well-characterized symptoms as defined in Ayurveda. Moreover, different schools of thought associated with how to take and interpret pulse in Ayurveda may have influenced the results.
4.2. Ways forward and implications of understanding reliability
Many studies show that the training of professionals, improving diagnostic instruments or methodologies, and a combination of both training and methodology play significant roles in greater reliability.19 Also, in TCM, two studies in patients with irritable bowel syndrome and rheumatoid arthritis demonstrated an improvement in the level of reliability with incorporation of a training phase in the study.20, 21 Furthermore, a study in TCM observed that the development of a standardized pulse-taking procedure and development of concrete operational definitions for each of the characteristics yielded an average agreement between two raters.22 Likewise, it would be useful to describe the physical sensations of the pulse characteristics. Recently, many studied with a technology-focused approach have tried to develop systems that can objectively measure and display the changes in the radial pulse are significant and successful in Ayurveda,23, 24, 25, 26 TCM,27, 28, 29, 30 and Oriental Medicine.31, 32 New technology may be introduced in the future to refine the diagnosis.
5. Conclusions
This is the first study on pulse examination to investigate both the intrarater and interrater reliability in Ayurveda. This study reveals that the interobserver reliability in making a pulse examination is not particularly high when objectively quantified. These findings are not unlike those associated with other assessments of reliability conducted on other traditional medicine methodologies such as Chinese and Sasang medicine, where reliability has also been found to be low. However, the moderate level of agreement observed among the doctors who are more experienced and trained indicates that training and experience may lead to better reliability. The variability in the diagnosis indicates the need for a standardization of the pulse examination method. Furthermore, new technology could potentially be used to display the pulse pattern in combination with the doctor's diagnosis for more accuracy and objectivity.
Conflicts of Interest
The authors have no conflict of interests to disclose.
Acknowledgments
This study was supported by the Erasmus Mundus Mobility for Life project CTIF section, at Aalborg University. We wish to thank Dr Aparna Desai, Dr Ratnaprabha Mishra, Dr Umesh C, Dr Gopal Krishna, Dr Nikhila Hiremath, Dr S.J. Varuni, Dr C.D. Mahesh, Dr Naveen V, Dr Sangeeta Rao, Dr Shilpa Dhote, Dr J. Vivek, Dr Ranjeet Shetty, Dr Kirti Mehendale, Dr Kshipra Srivastava, and Dr Pritesh Patel, for their participation in the study. We would like to thank to Dr Murlidharan, Principal Dr Sarveshwar Kar, and Head of Department Roganidan Dr Aparna Desai and Research Head Ghanashyam Shrivastav from Sri Sri Ayurveda Science and Research Hospital. Dr Kirti Mehendale is thanked for her valuable help and support in making facilities and experimental set-up available.
Appendix A. Appendix
A.1. Interpretation of sanskrit words
Dosha - fundamental energies or entities or principles, which govern the function of body on the physical and psychological level. The Ayurvedic concepts of physiology, pathology, diagnosis, medicine, and therapeutics are based on the doctrine of tridoshas.
Vata - combination of air and ether elements representative of kinetic energy and movement, physical, or mental functions, and degeneration.
Pitta - combination of fire and water elements representing thermal energy and metabolism conversion, vision, and emotions.
Kapha - combination of earth and water elements representing potential energy and structure in the body. It is associated with processes of generation, reunion, and synthesis.
A.2. Pulse examination - original references.
Means of diagnosis (yogaratnakara “rogipariksha”)

Eight part of the diseased person should be examined; namely pulse, urine, feces, tongue, sound, touch, vision, and body structure.
Anatomical position of the pulse (Sharangadhar Samhita, first part)

The artery found at the root of the thumb is evidence of life, and scholars ascertain the healthy state or diseased condition of the body by feeling the movement of it.
Method of the pulse examination (Bhavprakash first part “rogipariksha”)
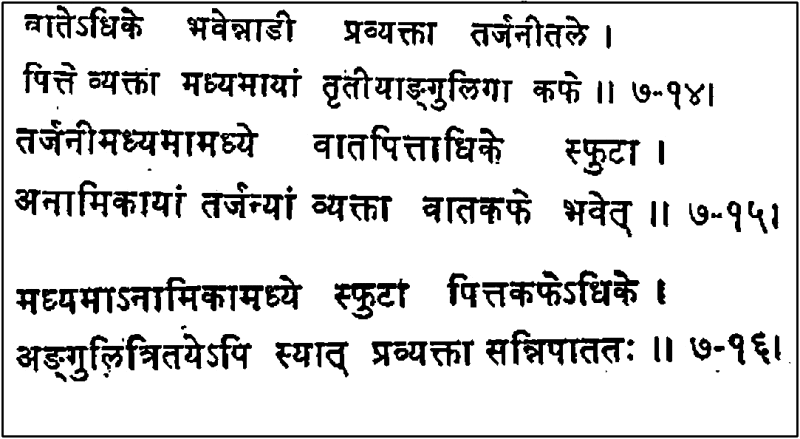
When V is dominant, the pulse can be felt under index finger, P under the middle and K under the ring finger. When V and P doshas are both dominant the pulse is felt in-between index and middle finger. When V and K are deranged, pulse is felt in between middle and ring finger. When all the three doshas are equally involved, the pulse is felt under all the three fingers.

Physicians should examine the pulse at the root of the thumb in the right hand of the male patient. In a female patient, he should examine pulse of the left hand.

The pulse should not be examined just after bathing or eating, when the patient is anointed (massaged) with oil, is hungry or thirsty, or during sleep and just after awakening.
Characteristics of the pulse(sharangdharsamhit, first part)
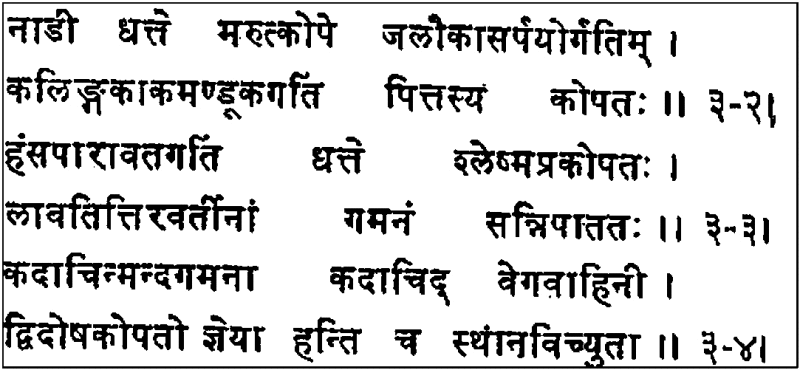
When there is excitement of the V dosha, the pulse resembles the movements of serpent i.e., snake and the leech. In the case of P excitement, its movement resembles those of the sparrow, crow, and frog. When K is excited the movement of the pulse resembles those of the swan and the pigeon. When all the three doshas are equally involved, the movement of the pulse resembles those of the lark, quail, and partridge. In case of two doshas involved the movement of the pulse is alternately slow and fast.
References
- 1.Mishra L., Singh B.B., Dagenais S. Healthcare and disease management in Ayurveda. Altern Ther Health Med. 2001;7:44–50. [PubMed] [Google Scholar]
- 2.Zafari A.M., Ghasemzadeh N. A brief journey into the history of the arterial pulse. Cardiol Res Pract. 2011;2011:164832. doi: 10.4061/2011/164832. [DOI] [PMC free article] [PubMed] [Google Scholar]
- 3.Joshi R.R. Diagnostics using computational nadi patterns. Math Comput Model. 2005;41:33–47. [Google Scholar]
- 4.Lad V. Motilal Banarasidass Publishers; Delhi: 2007. Secrets of the Pulse: The ancient art of Ayurvedic pulse examination. [Google Scholar]
- 5.Cohen J. Weighted kappa: nominal scale agreement provision for scaled disagreement or partial credit. Psychol Bull. 1968;70:213–220. doi: 10.1037/h0026256. [DOI] [PubMed] [Google Scholar]
- 6.Kurande V.H., Waagepetersen R., Toft E., Prasad R., Raturi L. Repeatability of pulse diagnosis and body constitution diagnosis in traditional Indian Ayurveda medicine. Glob Adv Health Med. 2012;1:36–42. doi: 10.7453/gahmj.2012.1.5.011. [DOI] [PMC free article] [PubMed] [Google Scholar]
- 7.Fleiss J.L., Cohen J. The equivalence of weighted kappa and the intraclass correlation coefficient as measures of reliability. Educ Psychol Meas. 1973;33:613–619. [Google Scholar]
- 8.Landis J.R., Koch G.G. The measurement of observer agreement for categorical data. Biometrics. 1977;33:159–174. [PubMed] [Google Scholar]
- 9.Bakeman R., McArthur D., Quera V., Robinson B.F. Detecting sequential patterns and determining their reliability with fallible observers. Psychol Methods. 1997;2:357–370. [Google Scholar]
- 10.O’Brien K.A., Birch S. A review of the reliability of traditional East Asian medicine diagnoses. J Altern Comp Med. 2009;15:353–366. doi: 10.1089/acm.2008.0455. [DOI] [PubMed] [Google Scholar]
- 11.Dang T, Zaslawski C J. A pilot study of the diagnostic reasoning processes used by practitioners of traditional Chinese medicine. In The Fourth Australasian Acupuncture and Chinese Medicine Conference, Victoria University of Technology, Melbourne, Australia. 1998.
- 12.Walsh S., Cobbin D., Bateman K., Zaslawski C. Feeling the pulse: trial to assess agreement level among TCM students when identifying basic pulse characteristics. Eur J Oriental Med. 2001;3:25–31. [Google Scholar]
- 13.O’Brien K.A., Abbas E., Movsessian P., Hook M., Komesaroff P.A., Birch S. Investigating the reliability of Japanese toyohari meridian therapy diagnosis. J Altern Complement Med. 2009;15:1099–1105. doi: 10.1089/acm.2009.0020. [DOI] [PubMed] [Google Scholar]
- 14.Ko M.M., Park T.Y., Lee J.A., Choi T.Y., Kang B.K., Lee M.S. Interobserver reliability of pulse diagnosis using traditional Korean medicine for stroke patients. J Altern Complement Med. 2013;19:29–34. doi: 10.1089/acm.2011.0612. [DOI] [PMC free article] [PubMed] [Google Scholar]
- 15.Debata A. Experimental study on pulse diagnosis of rokubujoi. Jpn Acup Mox J. 1968;17:9–12. [Google Scholar]
- 16.Kurosu Y. Experimental study on the pulse diagnosis of rokubujoi 11. Jpn Acup Moxib J. 1969;18(3):26–30. [Google Scholar]
- 17.Lee H.S., Lee Y.B., Shin Y.S., Kim H.J., Seo J.C., Lee J.M. A pilot study on reliability of pulse diagnosis in Eight-Constitution Medicine. Korean J Meridian Acupoin. 2005;22:1–8. [Google Scholar]
- 18.Shin Y.-S., Park Y.-J., Park Y.-B., Oh H.-S. A study on method that estimate expertness of pulse diagnosis in 8 Constitution Medicine. J Korea Inst Orient Med Diagn. 2006;10:78–97. [In Korean, English abstract] [Google Scholar]
- 19.Tuijn S., Janssens F., Robben P., Van Den Bergh H. Reducing interrater variability and improving health care: A meta-analytical review. J Eval Clin Pract. 2012;18:887–895. doi: 10.1111/j.1365-2753.2011.01705.x. [DOI] [PubMed] [Google Scholar]
- 20.Sung J.J.Y., Leung W.K., Ching J.Y.L., Lao L., Zhang G., Wu J.C. Agreements among traditional Chinese medicine practitioners in the diagnosis and treatment of irritable bowel syndrome. Aliment Pharmacol Ther. 2004;20:1205–1210. doi: 10.1111/j.1365-2036.2004.02242.x. [DOI] [PubMed] [Google Scholar]
- 21.Zhang G.G., Singh B., Lee W.L., Handwerger B., Lao L., Berman B. Improvement of agreement in TCM diagnosis among TCM practitioners for persons with the conventional diagnosis of rheumatoid arthritis: effect of training. J Altern Complement Med. 2008;14:381–386. doi: 10.1089/acm.2007.0712. [DOI] [PubMed] [Google Scholar]
- 22.King E., Cobbin D., Walsh S., Ryan D. The reliable measurement of radial pulse characteristics. Acupunct Med. 2002;20:150–159. doi: 10.1136/aim.20.4.150. [DOI] [PubMed] [Google Scholar]
- 23.Jog A., Joshi A., Chandran S., Madabhushi A. BIOSIGNALS 2009 - Proceedings of the 2nd International Conference on Bio-Inspired Systems and Signal Processing. 2009. Classifying ayurvedic pulse signals via consensus locally linear embedding; pp. 388–395. [Google Scholar]
- 24.Arunkumar N., Jayalalitha S., Dinesh S., Venugopal A., Sekar D. IEEE-International Conference on Advances in Engineering, Science and Management, ICAESM-2012. 2012. Sample entropy based ayurvedic pulse diagnosis for diabetics; pp. 61–62. [Google Scholar]
- 25.Begum MS, Poonguzhali R. Noi Kanippaan: Nadi diagnosing system. In: International Conference on Recent Trends in Information Technology, ICRTIT 2011; 2011. p. 1049-54.
- 26.Joshi A.B., Kalange A.E., Bodas D., Gangal S.A. Simulations of piezoelectric pressure sensor for radial artery pulse measurement. Mater Sci Engin B. 2010;168:250–253. [Google Scholar]
- 27.Xu L., Wang K., Zhang D., Li Y., Wan Z., Wang J. Objectifying researches on traditional Chinese pulse diagnosis. Inform Med Slovenica. 2003;2:56–63. [Google Scholar]
- 28.Chen Y., Zhang L., Zhang D., Zhang D. Computerized wrist pulse signal diagnosis using modified auto-regressive models. J Med Syst. 2011;35:321–328. doi: 10.1007/s10916-009-9368-4. [DOI] [PubMed] [Google Scholar]
- 29.Zhang D.Y., Zuo W.M., Zhang D., Zhang H.Z., Li N.M. Wrist blood flow signal-based computerized pulse diagnosis using spatial and spectrum features. J Biomed Sci Engin. 2010;3:361–366. [Google Scholar]
- 30.Xu L., Wang K., Zhang D. Modern researches on pulse waveform of TCPD. In Communications, Circuits and Systems and West Sino Expositions. IEEE 2002 International Conference on IEEE. 2002;2:1073–1077. [Google Scholar]
- 31.Jeon Y., Kim J., Lee H., Lee J., Ryu H.H., Lee Y.J. A clinical study of the pulse wave characteristics at the three pulse diagnosis positions of chon, gwan and cheok. Evid Based Comp Altern Med. 2011;2011:904056. doi: 10.1093/ecam/nep150. [DOI] [PMC free article] [PubMed] [Google Scholar]
- 32.Kim J., Jeon J., Lee Y., Kim K., Kim J. Novel diagnostic algorithm for the floating and sunken pulse qualities and its clinical test. Evid Based Comp Altern Med. 2011;2011:813427. doi: 10.1155/2011/813427. [DOI] [PMC free article] [PubMed] [Google Scholar]