

There has been controversy whether the metabolic syndrome (MetS) provides additional risk prediction beyond that conferred by levels of the individual MetS components of waist circumference, blood pressure, fasting triglycerides, low HDL and fasting glucose (1). We previously formulated a continuous MetS-severity score (2) that addresses statistical and racial/ethnic limitations of traditional binary MetS criteria such as the Adult-Treatment-Panel-III (ATP-III). This score was derived from participants of the National Health and Nutrition Examination survey using confirmatory factor analysis of the five MetS components on a sex- and race/ethnicity-specific basis (2). This approach provided differential weights (the largest being for waist circumference and the smallest being for systolic blood pressure) that are multiplied by a given individual’s absolute values for each MetS component toward a continuous Z-score, estimating the degree of MetS-severity by sex- and racial/ethnic subgroup, with a mean of 0 and increasing values indicating higher MetS-severity (http://mets.health-outcomes-policy.ufl.edu/calculator/). This MetS-severity score enables following MetS-severity over time and has been shown in a small sample to correlate with future cardiovascular-disease and diabetes (3,4).
In the current study, we utilized adjudicated coronary heart disease (CHD) outcomes from Atherosclerosis-Risk-in-Communities study (ARIC; 11,004 white and black participants recruited 1987–1989 at mean age 53.8y with ≤24y follow-up) and Jackson-Heart-Study (JHS; 2137 black participants recruited 2000–2004 at mean age 48.5y with ≤11y follow-up) (1,5). We assessed abilities of baseline MetS (both ATP-III-MetS (1) and MetS-severity Z-scores(2)) on a sex- and race-specific basis to predict future CHD in Cox proportional-hazards models (adjusted for age and stratified by site) both without and with the five MetS components. This cause-specific analysis (with non-CHD death censored) was compared to a formal competing risk analysis using the Fine-Gray model. The ability of MetS-severity to discriminate future CHD was calculated by the area-under-the-curve (AUC) of a time-dependent ROC curve, and compared with ATP-III-MetS. The ability of MetS-severity to improve classification of future disease beyond that of ATP-III-MetS was calculated by the continuous net reclassification improvement (NRI) and integrated discrimination improvement (IDI) after fitting both MetS metrics in a Cox model. In addition to the continuous NRI, we also calculated the event NRI (which can be interpreted as the net percentage of participants with a CHD event who were correctly assigned a higher predicted risk when adding MetS-severity) as well as the non-event NRI (the net percentage of participants without CHD correctly assigned a lower risk)(6).
From the competing-risks analysis, ATP-III-MetS was significantly associated with future CHD (hazard ratio [HR] 1.64, 95% confidence interval [CI]=(1.49, 1.80), p<0.01). Notably, we observed a significant interaction between ATP-III-MetS and sex (male HR=1.37, female HR=2.09), and following adjustment for the individual MetS components, ATP-III-MetS was no longer associated with future CHD (HR=0.87, CI=(0.73,1.05), p=0.10). The MetS-severity Z-score was associated with future CHD in models both without and with the individual MetS components (both p<0.01; adjusted HR’s shown in Figure 1). Figure 1 displays model-estimated cumulative incidence functions for the four categories of MetS severity. Participants in the 4th quartile of MetS severity had a 25-year CHD rate of 24.9% compared to a 6.5% rate for those in the first quartile of MetS severity. There were no significant sex- or race-interactions, nor was there excessive collinearity of the score with the individual components (variance inflation factors<10). Cause-specific Cox models provided similar hazard ratios, and were used as the basis for model-prediction reclassification assessment. The time-dependent AUC was 0.56 for ATP-III-MetS and 0.63 for the MetS-Z-score, supporting improved predictive ability. Both the NRI and the IDI, measures of risk reclassification and discrimination improvement, respectively, were significantly greater than 0 when adding MetS-Z-score to a survival model of CHD that originally included ATP-III-MetS (again without excess collinearity). The continuous NRI=0.30 (CI=(0.24,0.36); p<0.001), with the event NRI=13% (CI=(7%,19%) and the non-event NRI=17% (CI=15%,19%), and the IDI=0.017 (CI=(0.016,0.018); p<0.001).
Figure 1. Coronary Heart Disease Risk by Metabolic Syndrome Severity Quartile.
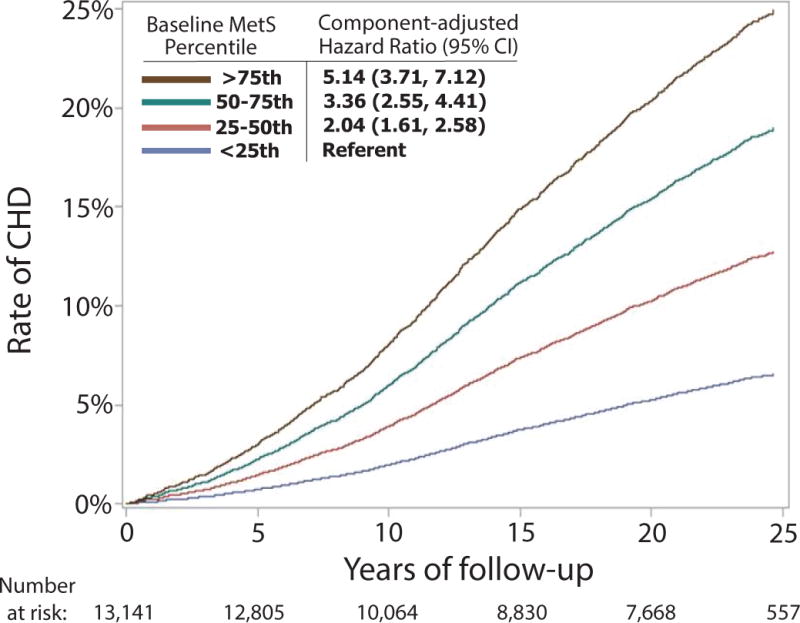
Hazard ratios (with 95% confidence intervals) adjusted for the individual MetS components for CHD risk by MetS-severity quartile. Kaplan-Meier Curve displays time to CHD by MetS-severity quartile.
While MetS has been criticized as not being worth more than the sum of its individual parts, these data demonstrate that a continuous estimate of MetS-severity provided additional predictive ability for future CHD beyond the individual MetS components. This score may thus contribute additional risk related to the underlying pathophysiological processes of cellular dysfunction, oxidative stress and systemic inflammation that appear to produce abnormalities in the individual MetS components. Moreover, this sex- and race-specific score, unlike ATP-III-MetS, did not exhibit differences in CHD prediction by sex or race and thus may provide similar risk information across sub-populations. Overall, the MetS-severity Z-score performed better than and appeared to offer multiple advantages over ATP-III-MetS in CHD risk prediction. Cut-off values indicating particular increase in MetS-severity-related risk are still needed.
Acknowledgments
This work was supported by grants from the National Institutes of Health (Bethesda, MD). 1R01HL120960 (MJG and MDD). The Jackson Heart Study is supported by contracts HHSN268201300046C, HHSN268201300047C, HHSN268201300048C, HHSN268201300049C, HHSN268201300050C from the National Heart, Lung, and Blood Institute and the National Institute on Minority Health and Health Disparities. The Atherosclerosis Risk in Communities Study is carried out as a collaborative study supported by National Heart, Lung, and Blood Institute contracts (HHSN268201100005C, HHSN268201100006C, HHSN268201100007C, HHSN268201100008C, HHSN268201100009C, HHSN268201100010C, HHSN268201100011C, and HHSN268201100012C).
Abbreviations
- ARIC
Atherosclerosis Risk in Communities
- ATP-III
Adult Treatment Panel-III
- CHD
coronary heart disease
- HDL
high density lipoprotein
- JHS
Jackson Heart Study
- MetS
metabolic syndrome
Footnotes
Disclosures: none; no relationships with industry.
References
- 1.McNeill AM, Schmidt MI, Rosamond WD, East HE, et al. The metabolic syndrome and 11-year risk of incident cardiovascular disease in the atherosclerosis risk in communities study. Diabetes Care. 2005;28(2):385–390. doi: 10.2337/diacare.28.2.385. [DOI] [PubMed] [Google Scholar]
- 2.Gurka MJ, Lilly CL, Norman OM, DeBoer MD. An Examination of Sex and Racial/Ethnic Differences in the Metabolic Syndrome among Adults: A Confirmatory Factor Analysis and a Resulting Continuous Severity Score. Metabolism. 2014;63(2):218–225. doi: 10.1016/j.metabol.2013.10.006. [DOI] [PMC free article] [PubMed] [Google Scholar]
- 3.DeBoer MD, Gurka MJ, Woo JG, Morrison JA. Severity of Metabolic Syndrome as a Predictor of Cardiovascular Disease Between Childhood and Adulthood: The Princeton Lipid Research Cohort Study. JACC. 2015;66(6):755–757. doi: 10.1016/j.jacc.2015.05.061. [DOI] [PMC free article] [PubMed] [Google Scholar]
- 4.DeBoer MD, Gurka MJ, Woo JG, Morrison JA. Severity of MetS as a predictor of T2DM between childhood and adulthood: the Princeton Lipid Research Cohort Study. Diabetologia. 2015;58(12):2745–2752. doi: 10.1007/s00125-015-3759-5. [DOI] [PMC free article] [PubMed] [Google Scholar]
- 5.Xanthakis V, Sung JH, Samdarshi TE, Hill AN, et al. Relations between subclinical disease markers and type 2 diabetes, metabolic syndrome, and incident cardiovascular disease: the Jackson Heart Study. Diabetes Care. 2015;38(6):1082–1088. doi: 10.2337/dc14-2460. [DOI] [PMC free article] [PubMed] [Google Scholar]
- 6.Leening MJ, Vedder MM, Witteman JC, Pencina MJ, Steyerberg EW. Net reclassification improvement: computation, interpretation, and controversies: a literature review and clinician’s guide. Ann Intern Med. 2014;160(2):122–131. doi: 10.7326/M13-1522. [DOI] [PubMed] [Google Scholar]