

Abstract
Background
Recently, people have begun showing heightened interest in skin whitening. Melanin is an important factor that determines skin color. The purpose of this study is to investigate the inhibitory effect of Taraxacum mongolicum (TAM) with phreatic water (PW) from Dogo Hot Springs on melanin synthesis.
Methods
We assessed the inhibitory effects of TAM on melanin synthesis in B16F10 mouse melanoma cells. The mRNA levels of tyrosinase related protein (TRP)-1, TRP-2, tyrosinase, MITF, ERK, and PKA protein were analyzed with reverse transcription polymerase chain reaction and Western blot analysis. We also assessed the inhibitory effects of TAM with PW on melanin synthesis in HRM-2 melanin-possessing hairless mice. After UVB irradiation, differences in melanin were analyzed with an image analysis software between the left dorsal skin (untreated part) and the right dorsal skin (treated part). The mRNA levels of TRP-1, TRP-2, and matrix metalloproteinase (MMP)-9 were analyzed with real-time quantitative polymerase chain reaction. The dorsal skins were analyzed with histological test by hematoxylin and eosin staining.
Results
TAM inhibited the TRP-1, TRP-2, tyrosinase, MITF mRNA gene expression, and PKA protein expression on the concentration-dependent B16F10 cell. Moreover, TAM increased the ERK mRNA gene expression in the B16F10 cell. After UVB irradiation, TAM with PW increased the differences in melanin between the left dorsal skin (untreated part) and the right dorsal skin (treated part) in HRM-2 mice. TAM with PW inhibited the TRP-1, TRP-2, and MMP-9 mRNA gene expression in HRM-2 mice. TAM with PW decreased the epidermal thickness, around the cell deformation, keratinization, and infiltration in HRM-2 mice.
Conclusion
These results indicate that TAM with PW has the inhibitory effect of decreasing the melanin synthesis.
Keywords: melanin synthesis, phreatic water, Taraxacum mongolicum, whitening
1. Introduction
As people are increasingly exposing their skin to UV radiation, skin damage and photoaging by UV rays have also been increasing because of environmental pollution, and consequently people are taking a heightened interested in skin whitening.1
The major elements determining human skin color are blood volume and hemoglobin distributed in the blood vessels, melanin, and carotene. Moreover, keratin layer thickness, personal difference, seasonal status, and health status also affect skin color.2 Among these factors, melanin, which is synthesized by the melanosome of the melanocyte residing in the basal skin layer, moves to the skin keratinocyte through the dendrite and exhibits skin color as well as demonstrates positive functions in skin protection from the damaging effects of UV exposure. However, excessively generated melanin creates abnormal hyperpigmentation such as melasma, freckles, and skin spots.3, 4 Therefore, to verify the whitening effect, it is important to figure out the inhibitory degree of melanin pigment generation in the melanin synthesizing cell.2
Recent studies on whitening effect include the study on tyrosinase activation inhibition, the study on action control of the messenger ordering melanin synthesis to the melanocyte, the study on the material promoting keratin layer removal and blocking UV rays, and the study on the active oxygen removing material.2, 5 However, materials (such as hydroquinone, kojic acid, arbutin, vitamin C, gluthatione, salicylic acid, and resorcin) known to be effective through these studies exhibit limitations such as cytotoxicity, safety problems, and skin penetration. Consequently, studies are widely conducted on using more effective and stable medicinal herbs to prove their whitening effect and to use them as whitening cosmetics and medical substances.5, 6, 7
For whitening studies of medicinal herbs, there are studies on Radix glycyrrhizae Water Extract ( ),8 Schizandrae Fructus (
 ),9 and Belamcandae Rhizoma (
 ).10 Among herbal medicine prescriptions, the whitening effects of Kakamseosiokyong-san (
 ),11 Kamigwibi-tang (
 ),12 and Dokhwalkisaeng-tang (
 )13 have been studied.
Taraxacum mongolicum ( , TAM) is the turning of dandelion, a perennial herb that belongs to the Compositae family. Its nature is cool, and its taste is bitter and sweet. It is used for the hepatogastric pill. It also detoxifies rashes caused by heat and removes carbuncles, making it a useful medicine commonly used on all kinds of surgical rashes, carbuncles, and rash symptoms.14
Studies on TAM have been continuously conducted to determine its anti-inflammatory efficacy,15 antiallergenic efficacy,16 and antioxidant efficacy.17 However, to date only a few studies have focused on the whitening effect of TAM.18, 19
Accordingly, to verify the whitening effect of TAM, this study identified its whitening content using high-performance liquid chromatography (HPLC) analysis, and using B16F10 mouse melanoma cells, we identified the inhibitory effect of TAM on melanin generation by verifying the gene expression inhibition of the principal enzymes involved in melanin generation and the signal transfer mechanism associated with melanin generation. Although the whitening effect of phreatic water (PW)20, 21—which is widely used for the treatment of skin disorders such as psoriasis, atopic dermatitis, pimples, and xeroderma—has not been studied yet, this study tried to verify if PW, together with TAM, enhances the inhibitory effect on melanin generation. For PW, we used the water from Dogo Hot Springs, whose sulfuric content is known to effectively control allergic inflammatory responses (see the recent study of Jang et al22). UVB was irradiated on HRM-2 melanin-possessing hairless mice. Here, we report that significant results were obtained from the study using the image analysis software on pigmentation, the analysis on gene expression of principle enzymes associated with melanin generation, and the histological skin analysis.
2. Methods
2.1. Cell strain and cell culture
B16F10 mouse melanoma cells (ATCC, Manassas, VA, USA) were used as experimental cell strains. These were floated in Dulbecco's modified Eagle medium, to which 10% fetal bovine serum and 1% penicillin/streptomycin (100 U/ml) were added, and adapted in the 37 °C, 5% CO2 incubator for subculture.
2.2. Herb
The TAM used in this experiment was purchased from Omniherb (www.omniherb.com), Daegu, Korea and carefully selected. Its origin is Gyeongsangbuk-do in Korea.
2.3. TAM extract separation
First, 200 g of TAM powder used in this experiment was immersed in 30% ethanol (1.5 l) in the ASE300 Accelerated Solvent Extractor (Dionex Co., Sunnyvale, CA, USA) for 3 days, and the extract liquid was extracted for 20 minutes at 50 °C. The extract filtrate liquid obtained from the extract liquid through filtration and decompressed drying was frozen and dried for 24 hours at − 70 °C for cold trap and at 40 °C of the chamber temperature in the freezing dryer (Biotron Co., Bucheon, Gyeonggi, Korea) to obtain 18 g of extract.
2.4. Animal
The animals used in this experiment consisted of 20–22 g HRM-2 melanin-possessing hairless male mice parceled from Hoshino Laboratory Animals Co. Ltd. (Saitama, Japan). They were fully fed with antibiotic-free pellet feed (Samyang Feed, Seoul, Korea) and water, and adapted for a week at the temperature 22 ± 2 °C and relative humidity of 55 ± 15% in the animal breeding room where the 12-hour light–dark cycle was maintained prior to use.
For ethical and scientific feasibility study and efficient control of animal experiments, this experiment was approved by the Institutional Animal Care and Use Committee of Daejeon University, Cheonan, South Korea (approval no. DJUARB2012-019).
2.5. PW
The natural PW was collected from Paradise Spa Dogo, Korea. Component analysis on the PW of Dogo Hot Springs had been conducted in the study of Jang et al.22
2.6. Experimental drugs and instruments
Experimental drugs used for the whitening effect measurement were tyrosinase mushroom, dimethyl sulfoxide and l-3,4-dihydroxy-phenyl-alanine (l-DOPA) purchased from Sigma Chemical Co. (St. Louis, MO, USA). Those used for polymerase chain reaction (PCR) were extracellular regulated kinase (ERK), cAMP responsive element binding protein (CREB), microphthalmia-associated transcription factor (MITF), tyrosinase, tyrosinase related protein-1 (TRP-1), tyrosinase related protein-2 (TRP-2), glyceraldehyde-3-phosphate dehydrogenase (GAPDH), primary antibody, and secondary antibodies such as mouse-antigoat and rabbbit-antimouse purchased from Santa Cruz Biotechnology (Santa Cruz, CA, USA).
For cell culture, Dulbecco's modified Eagle medium, fetal bovine serum, phosphate buffered saline, penicillin/streptomycin, and trypsin were purchased from Thermo Scientific Hyclone (Logan, UT, USA) and Gibco BRL Co. (Grand Island, NY, USA). For cytotoxicity measurement, a Haemacytometer (Marienfeld-Superior, Lauda-Königshofen, Germany) and 3-[4,5-dimethylthiazol]-2-yl]-2,5-diphenyl-tetrazoliumbromide (MTT) were purchased from Sigma Chemical Co.. In addition, diethyl pyrocarbonate (DEPC), chloroform, trichloroacetic acid, isopropanol, Tris–HCl, KCl, and MgCl2 were purchased from Sigma Chemical Co.. For the HPLC reference sample, the Luteolin product was purchased from Sigma Chemical Co.. For other experimental drugs, first-class experimental drugs were used.
The TAM analysis HPLC (Waters 2695 system; Waters Co., Milford, MA, USA) was the Agilent 1200 series and used the autosampler, the column oven, the binary pump, the DAD detector (Agilent Technologies, Santa Clara, CA, USA), and the degasser (Agilent Technologies, Santa Clara, CA, USA). The software used was Chemstation software (Agilent Technologies, Santa Clara, CA, USA).
Instruments used in this experiment included the hot water extractor (DWT-1800T; Daewoong, Seoul, Korea), the reduced pressure distiller [EYELA (Tokyo, Japan)/BUCHI B-480 (Flawil, Switzerland)], the centrifuge (Hanil Science Industrial, Incheon, Korea), the freeze dryer [ilShinBioBase, (Dongduchun, Gyeonggi, Korea)/EYELA FDU-540], the microscope (Olympus, Tokyo, Japan), the CO2 incubator (Vision Scientific, Daejeon, Korea), the vortex (Scientific Industries, Inc., Bohemia, NY, USA), the pH meter (Mettler-Toledo AG, Greifensee, Switzerland), the BOD incubator (Daihan Scientific, Wonju, Gangwon, Korea), the autoclave (JS Research Inc., Gongju, Chungnam, Korea), the ELISA Reader (Tecan, Männedorf, Switzerland), the PCR (C-100, Bio-Rad Laboratories, Hercules, CA, USA), the plate shaker (Lab-Line, San Diego, CA, USA), the spectrophotometer (Shimadzu, Kyoto, Japan), the biofreezer (Sanyo Electric Co., Osaka, Japan), the Applied Biosystems® real-time quantitative (RQ) PCR (Life Technologies, Grand Island, NY, USA), and the HPLC (Waters Co., Milford, MA, USA).
2.7. TAM cream formation
The TAM cream form was made by blending 2% TAM + distilled water (DW), 2% TAM + PW and 0.5% SPF 47/PA++ additives over water phase and oil phase stabilizers (Table 1).
Table 1.
TAM cream formulation
| 2% TAM + DW cream | 2% TAM + PW cream | 0.5% SPF 47/PA++ cream | |
|---|---|---|---|
| Water phase (%) | |||
| Glycerine | 10.00 | 10.00 | 10.00 |
| Silicon derivatives | 0.20 | 0.20 | 0.20 |
| Microcide-C | 0.20 | 0.20 | 0.20 |
| EDTA-2Na | 0.01 | 0.01 | 0.01 |
| Keltrol F (1%) | 5.00 | 5.00 | 5.00 |
| Sepiplus 400 | 0.30 | 0.30 | 0.30 |
| Oil phase (%) | |||
| Lanette O | 2.00 | 2.00 | 2.00 |
| Olive M 1000 | 1.00 | 1.00 | 1.00 |
| Tego care 450 | 2.00 | 2.00 | 2.00 |
| Puresyn 4 | 2.00 | 2.00 | 2.00 |
| TCG-M | 3.00 | 8.00 | 8.00 |
| DC 200/6cs | 2.50 | 2.50 | 2.50 |
| Lipex Shea | 1.00 | 1.00 | 1.00 |
| Vitamin E | 0.50 | 0.50 | 0.50 |
| D-P | 0.10 | 0.10 | 0.10 |
| BHT | 0.02 | 0.02 | 0.02 |
| Stabilizer (%) | |||
| DW | 2.00 | – | – |
| PW | – | 2.00 | – |
| Additives (%) | |||
| 2% TAM + DW | 2.00 | – | – |
| 2% TAM + PW | – | 2.00 | – |
| 0.5% SPF 47/PA++ | – | – | 0.5 |
DW, distilled water; PW, phreatic water; TAM, Taraxacum mongolicum.
2.8. Effective HPLC component analysis on TAM
HPLC conditions applied were 25 °C for the column oven temperature, 348 nm for the analysis wavelength, and 1.0 mL/minute for the flow rate. The column used was the Luna C18 column (250 mm × 4.6 mm, particle size 5 μm; Phenomenex, Torrance, CA, USA). For Solvent A and Solvent B, 0.1% formic acid was added to 100% of the third DW and 100% acetonitrile, respectively. Solvent gradient eluents for solvents are as shown in Table 2. Luteolin was used as the index component, and components of the reference sample and TAM were analyzed.
Table 2.
Solvent gradient condition for HPLC-DAD
| Final time (min) | Flow rate (mL/min) | A | B |
|---|---|---|---|
| 0 | 0.3 | 85 | 15 |
| 10 | 0.3 | 80 | 20 |
| 30 | 0.3 | 65 | 35 |
| 35 | 0.3 | 65 | 35 |
| 40 | 0.3 | 85 | 15 |
A, water with 0.1% formic acid; B, acetonitrile with 0.1% formic acid; HPLC-DAD, high-performance liquid chromatography with diode array detection.
2.9. Effect of TAM on melanin generation in B16F10 mouse melanoma cell
2.9.1. Cytotoxicity measurement by MTT assay
The cytotoxicity was measured in accordance with various methods including the Carmichael et al23 method. A total of 0.18 mL of B16F10 cells was separately seeded on the 96-well plate by 5 × 10⁴ cells/well. Samples were prepared by concentrations, and 0.02 mL of each sample was added into each well and the plate was placed and cultured in the 5% CO2 incubator for 24 hours. The same amount of DW as that used in the sample group was added to the control group, and it was cultured under identical conditions. The MTT solution prepared in the 5 mg/mL concentration was added (at 0.02 mL each), and then both groups were cultured for 4 hours. Next, 0.15 mL of dimethyl sulfoxide was added to each for reaction for 30 minutes. The optical absorbance was measured at 540 nm using the ELISA reader. The cytotoxicity was indicated by the optical absorbance reduction ratio of the indication solution added group and the nonadded group.
2.9.2. Tyrosinase inhibitory activity measurement of TAM
The tyrosinase inhibitory activity was measured in accordance with various methods including the Yagi et al24 method. In the reactor, 200 U/mL mushroom tyrosinase (40 μL) was added to the mixture of the deposited solution (40 μL), in which 10 mM l-DOPA was dissolved over 67 mM sodium phosphate buffer (pH 6.8; 80 μL), and the sample solution (40 μL). It was reacted for 10 minutes at 37 °C. The DOPA chrome generated in the reaction solution was measured at 492 nm. The tyrosinase inhibitory activity was indicated by the optical absorbance reduction ratio of the indication solution added group and the nonadded group.
2.9.3. B16F10 cell experimental group classification
To identify the effect of TAM when inducing melanin generation on B16F10 cells, the experimental groups were classified as shown in Table 3.
Table 3.
Classification of experimental groups (in B16F10 cell)
| Group | Treatment |
|---|---|
| Normal | Nontreatment |
| Negative control | a-MSH (100nM) treatment |
| Positive control | a-MSH (100nM) + kojic acid (50 ppm) treatment |
| Experimental | a-MSH (100nM) + TAM (5 μg/mL, 25 μg/mL, 50 μg/mL) treatment |
a-MSH, a-melanocyte stimulating hormone.
2.9.4. mRNA expression measurement by PCR
-
(1)
Total RNA extraction and cDNA synthesis. B16F10 cells were seeded on the 100-mm culture dish and cultured for 24 hours. These were treated with a-melanocyte stimulating hormone (a-MSH; 100 nM), TAM (5 μg/mL, 25 μg/mL, and 50 μg/mL), and kojic acid (50 ppm) and cultured for 24 hours. Then, the culture medium was removed. The trizol lysis buffer was planted in each well by 1 mL for cell lysis, chloroform (200 mL) was added to each, and the dish was shaken up and down for 20 seconds. It was centrifuged for 20 minutes at 16,100 rpm × g. The supernatant was collected and mixed in the tube that contained isopropanol (500 mL). Then, it was centrifuged for 20 minutes at 16,100 rpm × g again. The supernatant was removed. Next, 75% EtOH-diethylpyrocarbonate water was added in each tube by 1 mL. It was centrifuged for 5 minutes at 13,200 rpm. The supernatant was removed then dried at room temperature. The DEPC was seeded in the 96-well plate by 50 μL/well and melted. RNA (5 μL) and sterile water (195 μL) were added in each well. Total RNA quantities were measured by measuring the optical absorbance at 260 nm and 280 nm, respectively. Overall, 10 μL was made with Oligo (dT) 15 primer (500 μg/mL) 1 μL, extracted RNA (2 μg), and nuclease-free water. It was reacted for 5 minutes at 75 °C. Then, 5 × reaction buffer, MgCl2, PCR necleotide mix, rnasin inhibitor, reverse transcriptase, and nuclease-free water were added. It was reacted for 5 minutes at 25 °C, for 60 minutes at 42 °C, and for 15 minutes at 70 °C to synthesize cDNA.
-
(2)
Reverse transcription (RT) PCR. Go Flexi DNA polymerase, primer, and synthesized cDNA was added in the PCR tube and fully blended, and PCR was conducted. The primer sequence used in the experiment is listed in Table 4. The GAPDH was kept for 30 seconds at 94 °C, for 45 seconds at 55 °C, and for 45 seconds at 72 °C for 35 times. The TRP-1, TRP-2, and MITF were kept for 30 seconds at 94 °C, for 45 seconds at 58 °C, and for 45 seconds at 72 °C for 40 times. The MMP-1 was kept for 30 seconds at 94 °C, for 60 seconds at 56 °C, and for 60 seconds at 72 °C for 35 times. After synthesis by PCR, it was treated with electrophoresis for 40 minutes at 100 V in 0.002% ethidium bromide added with 1.5% agarose gel. The LAS 4000 instrument (GE Healthcare Bio-Sciences AB, Uppsala, Sweden) was used to measure the band for quantitative analysis.
Table 4.
Primer sequence (in B16F10 cell)
| Gene | Primer | Sequence (5′→3′) |
|---|---|---|
| MITF | Forward Reverse |
AGC GTG TAT TTT CCC CAC AG TAG CTC CTT AAT GCG GTC GT |
| TRP-1 | Forward Reverse |
ACT TCA CTC AAG CCA ACT GC AGC TTC CCA TCA GAT GTC GT |
| TRP-2 | Forward Reverse |
GCT CCA AGT GGC TGT AGA CC AAT GCA GTG GCT TGG AAA TC |
| Tyrosinase | Forward Reverse |
GAC GGT CAC TGC ACA CTT TG GCC ATG ACC AGG ATG AC |
| GAPDH | Sense Anti-sense |
TGA AGG TCG GTG TGA ACG GAT TTG GC CAT GTA GGC CAT GAG GTC CAC CAC |
| MMP-1 | Forward Reverse |
AGC GTG TGA CAG TAA GCT AA GTT TTC CTC AGA AAG AGC AGC AT |
| ß-Actin | Forward Reverse |
ATT GTT GCC ATC AAT GAC CC AGT AGA GGC AGG GAT GAT |
2.9.5. Protein expression measurement by Western blot
B16F10 cells were seeded on a 100-mm culture dish and cultured for 24 hours. These were treated with a-MSH (100 nM), TAM (5 μg/mL, 25 μg/mL, and 50 μg/mL), and kojic acid (50 ppm) and cultured for 24–48 hours. Then the culture medium was removed. After washing twice with phosphate buffered saline, RIPA buffer (100 mL) added to the complete mini 1 tab was dissolved in 100 μL. Next, it was centrifuged for 20 minutes at 4 °C, 12,000 rpm. The centrifuged supernatant was quantified by the Bradford assay, and 30 μL protein was separated by electrophoresis (sodium dodecyl sulfate-polyacrylamide gel electrophoresis) using 10% gel. The semidry transfer cell instrument (Hoefer, Inc., San Francisco, CA, USA) was used to move the separated protein on the polyvinyl difluoride membrane. Then, it was cultured in the blocking buffer (5% skim milk in Tris-buffered saline with Tween) for 1 hour at room temperature. The primary antibody [protein kinase A (PKA), ß-actin] was diluted and kept overnight at 4 °C. It was washed using Tris-buffered saline with Tween for three times in at 10-minute intervals. The secondary antibody (anti rabbit, anti goat) was diluted by 1:1000, and cultured for 2 hours at room temperature. Then, it was washed for three times. The LAS 4000 instrument (GE Healthcare Bio-Sciences AB, Uppsala, Sweden) was used to measure the band for quantitative analysis.
2.9.6. Statistical analysis
Every experiment was repeated three times to obtain the average and standard deviation values. SPSS version 10.0 (Chicago, IL, USA) was used to process the statistical results. For significant difference verification, significance was analyzed using Tukey's honest significant difference test at a = 0.05 level after analysis of variance (*p < 0.05, **p < 0.01, ***p < 0.001).
2.10. Effect of TAM with PW on melanin generation in HRM-2 melanin-possessing hairless mice
2.10.1. HRM-2 mice experimental group classification
To identify the effect of 2% TAM + DW and 2% TAM + PW when inducing melanin generation on HRM-2 mice, the experimental groups were classified as shown in Table 5.
Table 5.
Classification of experimental groups (in HRM-2 mice)
| Group | Treatment | Treatment part |
|---|---|---|
| Normal | Base ointment application | Right |
| Negative control | UVB irradiation + Base ointment application | Right |
| Positive control | UVB irradiation + 0.5% Sunblock cream application | Right |
| Experimental 1 | UVB irradiation + 2% TAM + DW cream application | Right Upper |
| Experimental 2 | UVB irradiation + 2% TAM + PW cream application | Right Lower |
DW, distilled water; PW, phreatic water; TAM, Taraxacum mongolicum.
2.10.2. UVB irradiation and hyperpigmentation induction
The UVB lamp (15 W type, UV maximum wavelength 312 nm; UV intensity 100 μW cm–2; Ieda Boeki Co., Tokyo, Japan) was used to irradiate UVB on the dorsal skins of 7-week-old HRM-2 mice to identify the effect of 2% TAM + DW and 2% TAM + PW on changes in skin thickness, elasticity, and pigmentation. The base ointment and each sample was made in the cream form (0.5% Sunblock cream, 2% TAM + DW cream, 2% TAM + PW cream). It was applied on the right dorsal skin of each HRM-2 mouse, and no treatment was made on the left dorsal skin. Each mouse was anesthetized and irradiated with UVB from a 30-cm distance for 5 minutes at a time. UVB was irradiated three times a week for 4 weeks. Based on studies on UVB using animal whitening experiments,25, 26, 27 the experimental duration was configured for a total of 5 weeks.
2.10.3. Visual pigmentation observation
To visually observe the dorsal skin in which pigmentation was induced by UVB irradiation, applied parts of the solvent control group and the sample group were observed for three times on the 1st week, 3rd week, and 5th week after the experiment was launched to compare the colored skin states of experimental animals for whitening effect. Mice were etherized, and a digital camera (D 70 model; Nikon, Tokyo, Japan) was used to take pictures of skin surface states.
2.10.4. Software analysis on pigmented images
To analyze the images taken by the digital camera during the 1st week, 3rd week, and 5th week after the experiment start, the image analysis software (Bio-Rad) was used. To compare melanin deposition from the entire dorsal part, the untreated left dorsal part and the treated right dorsal part were separated. The melanin deposition level was derived from the difference between the pigmented areas of the left dorsal skin and the right dorsal skin.
2.10.5. mRNA expression measurement by PCR
-
(1)
Total RNA extraction and cDNA synthesis. The dorsal skin tissue was extracted from each HRM-2 mouse, added with RNAzolB (500 μL), and crushed with a homogenizer. Then 50 μL chloroform (CHCl3) was added, and the mixture was blended for 15 seconds. It was left for 15 minutes on ice and centrifuged at 13,000 rpm. A supernatant of approximately 200 μL was collected and mixed with 2-propanol (200 μL), then shaken slowly and left for 15 minutes. It was centrifuged at 13,000 rpm again. Next, it was washed with 80% EtOH and dried by vacuum pump for 3 minutes; then, RNA was extracted. The extracted RNA was dissolved in the DEPC-treated DW (20 μL). It was deactivated in the heating block at 75 °C and used in the first-strand cDNA synthesis.
-
(2)
RT. The total RNA (3 μg) extracted from the dorsal skin tissue of the HRM-2 mouse was denaturized for 10 minutes at 75 °C. Then, 2.5 μL 10 mM dNTPs mix, 1 μL random sequence hexanucleotides (25 pmol/25 μL), 1 μL RNase inhibitor (20 U/μL) as the RNA inhibitor, 1 μL 100 mM DTT, and 4.5 μL 5 × RT buffer (250 mM Tris–HCl, pH 8.3, 375 mM KCl, 15 mM MgCl2) were added to it; again, 1 μL M-MLV RT (200 U/μL) was added to the mixture. A 20-μL volume was made with the DEPC-treated DW. This 20-μL reaction mixture solution was fully stirred and was centrifuged for 5 seconds at 2000 rpm. It was reacted for 60 minutes in the heating block at 37 °C to synthesize the first-strand cDNA. It was left at 95 °C for 5 minutes to deactivate the M-MLV RT. Finally, the synthesized cDNA was used for PCR.
-
(3)
RQ PCR. The Applied Biosystems 7500 Real-Time PCR system was used for RQ PCR, and the primer sequence used in the experiment is given in Table 6. The SYBR Green primer for MMP-9, TRP-1, TRP-2 mRNA gene expression was analyzed with SYBR Green PCR MasterMix (ABI), and taqman probe for GAPDH (pn,4352339E, VIC dye-labelled, ABI) were selected using Assays-on-Demand Gene Expression Products (ABI). Glyceraldehyde-3-phosphate dehydrogenase (GAPDH) (ABI) gene expression was used as an endogenous control.
For RQ PCR conditions, predenaturation was conducted for 2 minutes at 50 °C and for 10 minutes at 94 °C, and 40 cycles of denaturation were conducted for 15 seconds at 95 °C and for 1 minute at 60 °C. GAPDH was used as the internal standard for the experimental group and the control group. The relative quantitative value of the target group was calculated for RQ PCR using the following equation: y = x(1 + e)n, where y is the yield, x is the starting quantity, n is the number of cycles, and e denotes efficiency.
Table 6.
Primed Sequences (in HRM-2 mice)*
| Target gene | Primer | Sequences |
|---|---|---|
| MMP-9 | Forward | 5′-AATCTCTTCTAGAGACTGGGAAGGAG-3′ |
| MMP-9 | Reverse | 5′-AGCTGATTGACTAAAGTAGCTGGA-3′ |
| TRP-1 | Forward | 5′-GCTGCAGGAGCCTTCTTTCTC-3′ |
| TRP-1 | Reverse | 5′-AAGACGCTGCACTGCTGGTCT-3′ |
| TRP-2 | Forward | 5′-GGATGACCGTGAGCAATGGCC-3′ |
| TRP-2 | Reverse | 5′-CGGTTGTGACCAATGGGTGCC-3′ |
| GAPDH-VIC | Probe | 5′-CATGTTCCAGTATGACTCCACTCACG-3′ |
MMP, matrix metalloproteinase; TRP, tyrosinase related protein; GAPDH, glyceraldehyde-3-phosphate dehydrogenase.
2.10.6. Histological observation on skin
To observe the optical microscopic change in the skin tissue, the extracted tissue was fixed in a 100% neutral formalin solution for 12 hours and washed with running water. It was hydrated with 70%, 80%, 95%, and 100% ethanol, and made transparent with xylene. After the penetration process, it was embedded with paraffin. The microtome was used to make the 4-μm-thick microsection from the produced paraffin block. Xylene was used to deparaffinize the microsection, which was then washed with salty water and tap water to dye it suitably for our purpose. To observe the overall change of the skin tissue, it was placed in the Harris hematoxylin solution for 5 minutes to dye its nucleus. Then, it was washed with running water. It was deposited for three times with 1% HCl–alcohol solution and was fully washed. A 1% ammonium solution was used to color it blue, and it was moved to 80% alcohol. Next, 95% alcohol and 100% alcohol were used to dehydrate it. After it cleared, it was enclosed with Canada balsam and then placed under the microscope for inspection.
2.10.7. Statistical analysis
The unpaired Student t test statistics was used to process each experimental group result, and significance was determined at levels not greater than p < 0.05 (* p < 0.05, ** p < 0.01, *** p < 0.001).
3. Results
3.1. Effective HPLC component analysis on TAM
For behaviors of standard materials contained in TAM contents, patterns of the standard material luteolin (Fig. 1A) and TAM (Fig. 1B) were identified by matching the retention times through HPLC with diode array detection. The luteolin content of TAM was 0.69 mg/g (Fig. 1).
Fig. 1.

HPLC chromatogram of standard luteolin and TAM. Chromatograms of standard (A) luteolin and (B) TAM are recorded at 348 nm. Peaks of luteolin are shown.
HPLC, high-performance liquid chromatography; TAM, Taraxacum mongolicum.
3.2. Effect of TAM on melanin generation in B16F10 mouse melanoma cell
3.2.1. Cytotoxicity
By the result of cytotoxicity of TAM on the B16F10 cell, little cytotoxicity was exhibited from every concentration from 5 μg/mL to 1000 μg/mL (Fig. 2). Therefore, for the whitening related signal transfer factor measurement in B16F10 cell, concentrations of 5 μg/mL, 25 μg/mL, and 50 μg/mL were tested.
Fig. 2.
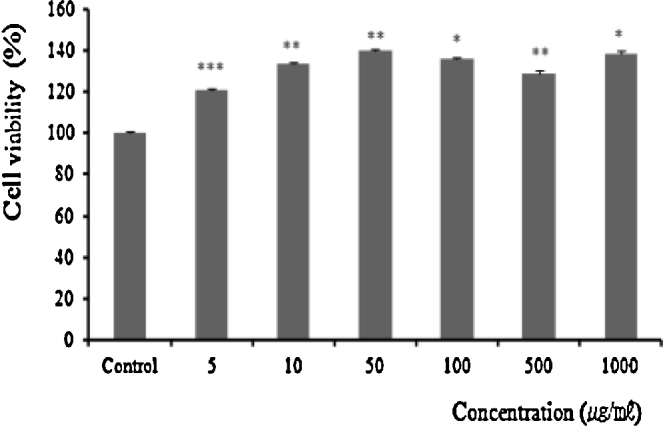
Cytotoxicity effects of TAM in B16F10 cell. B16F10 cells were treated with various concentrations of TAM (5 μg/mL, 10 μg/mL, 50 μg/mL, 100 μg/mL, 500 μg/mL, and 1000 μg/mL). Cell viabilities were measured by MTT assay. The results represent the mean ± SD of three individual experiments. Statistically significant value was calculated by comparing with negative control group using Turkey's HSD test (* p < 0.05, ** p < 0.01, *** p < 0.001).
HSD, honest significant difference; MTT, 3-[4,5-dimethylthiazol]-2-yl]-2,5-diphenyl-tetrazoliumbromide; SD, standard deviation; TAM, Taraxacum mongolicum.
3.2.2. Tyrosinase activation inhibition
By the result of tyrosinase activation inhibition effect of TAM, 50 μg/mL significantly exhibited 7.3% activation inhibition (p < 0.05), 100 μg/mL showed 7.7% activation inhibition (p < 0.01), 500 μg/mL showed 29.9% activation inhibition (p < 0.01), and 1000 μg/mL showed 46.5% activation inhibition (p < 0.001; Fig. 3).
Fig. 3.

Effect of TAM on tyrosinase activation inhibition in B16F10 cell. B16F10 cells were treated with various concentrations of TAM (5 μg/mL, 10 μg/mL, 50 μg/mL, 100 μg/mL, 500 μg/mL, and 1000 μg/mL). Then the cells were tested for tyrosinase activation inhibition. The results represent the mean ± SD of three individual experiments. Statistically significant value was calculated using Turkey's HSD test (* p < 0.05, ** p < 0.01, *** p < 0.001).
HSD, honest significant difference; SD, standard deviation; TAM, Taraxacum mongolicum.
3.2.3. TRP-1 mRNA gene expression
Whereas TRP-1 mRNA gene expression was increased in every concentration compared to the only a-MSH treated negative control group, it was decreased depending on the TAM concentration (Fig. 4).
Fig. 4.

Effect of TAM on TRP-1 mRNA gene expression in B16F10 cell. B16F10 cells were seeded on 100-mm culture dish. After 24 hours, cells were treated with a-MSH, TAM (5 μg/mL, 25 μg/mL, and 50 μg/mL) or kojic acid (50 ppm) for 24 hours. TRP-1 mRNA gene expression was analyzed with RT PCR. The results represent the mean ± SD of three individual experiments. Statistically significant value was calculated by comparing with negative control group using Turkey's HSD test (* p < 0.05, ** p < 0.01, *** p < 0.001).
a-MSH, a-melanocyte stimulating hormone; HSD, honest significant difference; Negative control, a-MSH (100 nM) treatment; Normal, nontreatment; Positive control, a-MSH (100 nM) + kojic acid (50 ppm) treatment; RT PCR, reverse transcription polymerase chain reaction; SD, standard deviation; TAM, Taraxacum mongolicum; TAM (5, 25, 50), a-MSH (100 nM) + TAM (5 μg/mL, 25 μg/mL, and 50 μg/mL) treatment.
3.2.4. TRP-2 mRNA gene expression
Whereas TRP-2 mRNA gene expression was increased in 5 μg/mL and 25 μg/mL concentrations compared to the only a-MSH treated negative control group, it was significantly decreased in 50 μg/mL concentration by 1.3% (p < 0.001). In addition, it was decreased depending on the TAM concentration (Fig. 5).
Fig. 5.

Effect of TAM on TRP-2 mRNA gene expression in B16F10 cell. B16F10 cells were seeded on 100-mm culture dish. After 24 hours, cells were treated with a-MSH, TAM (5 μg/mL, 25 μg/mL, and 50 μg/mL) or kojic acid (50 ppm) for 24 hours. TRP-2 mRNA gene expression was analyzed with RT PCR. The results represent the mean ± SD of three individual experiments. Statistically significant value was calculated by comparing with negative control group using Turkey's HSD test (* p < 0.05, ** p < 0.01, *** p < 0.001).
a-MSH, a-melanocyte stimulating hormone; HSD, honest significant difference; Negative control, a-MSH (100 nM) treatment; Normal, nontreatment, Positive control, a-MSH (100 nM) + kojic acid (50 ppm) treatment; RT PCR, reverse transcription polymerase chain reaction; SD, standard deviation; TAM, Taraxacum mongolicum; TAM (5, 25, 50), a-MSH (100 nM) + TAM (5 μg/mL, 25 μg/mL, and 50 μg/mL) treatment.
3.2.5. Tyrosinase mRNA gene expression
Whereas tyrosinase mRNA gene expression was increased in 5 μg/mL concentration compared to the only a-MSH treated negative control group, it was significantly decreased in 25 μg/mL concentration by 0.4% (p < 0.05) and in 50 μg/mL concentration by 1.3% (p < 0.05). It was decreased in 5 μg/mL, 25 μg/mL, and 50 μg/mL concentrations compared to kojic acid, the positive control group. In addition, it was decreased depending on the TAM concentration (Fig. 6).
Fig. 6.

Effect of TAM on tyrosinase mRNA gene expression in B16F10 cell. B16F10 cells were seeded on 100-mm culture dish. After 24 hours, cells were treated with a-MSH, TAM (5 μg/mL, 25 μg/mL, and 50 μg/mL), or kojic acid (50 ppm) for 24 hours. Tyrosinase mRNA gene expression was analyzed with RT PCR. The results represent the mean ± SD of three individual experiments. Statistically significant value was calculated by comparing with negative control group using Turkey's HSD test (* p < 0.05, ** p < 0.01, *** p < 0.001).
a-MSH, a-melanocyte stimulating hormone; HSD, honest significant difference; Negative control, a-MSH (100 nM) treatment; Normal, nontreatment; Positive control, a-MSH (100 nM) + kojic acid (50 ppm) treatment; RT PCR, reverse transcription polymerase chain reaction; SD, standard deviation; TAM, Taraxacum mongolicum; TAM (5, 25, 50), a-MSH (100 nM) + TAM (5 μg/mL, 25 μg/mL, and 50 μg/mL) treatment.
3.2.6. MITF mRNA gene expression
MITF mRNA gene expression was significantly decreased in 5 μg/mL concentration by 12.8% (p < 0.05) compared to the only a-MSH treated negative control group, in 25 μg/mL concentration by 18.2% (p < 0.05), and in 50 μg/mL concentration by 25.6% (p < 0.01). In addition, it was decreased depending on the TAM concentration (Fig. 7).
Fig. 7.

Effect of TAM on MITF mRNA gene expression in B16F10 cell. B16F10 cells were seeded on 100-mm culture dish. After 24 hours, cells were treated with a-MSH, TAM (5 μg/mL, 25 μg/mL, and 50 μg/mL) or kojic acid (50 ppm) for 24 hours. MITF mRNA gene expression was analyzed with RT PCR. The results represent the mean ± SD of three individual experiments. Statistically significant value was calculated by comparing with negative control group using Turkey's HSD test (* p < 0.05, ** p < 0.01, *** p < 0.001).
a-MSH, a-melanocyte stimulating hormone; HSD, honest significant difference; MITF, microphthalmia-associated transcription factor; Negative control, a-MSH (100 nM) treatment; Normal, nontreatment; Positive control, a-MSH (100 nM) + kojic acid (50 ppm) treatment; RT PCR, reverse transcription polymerase chain reaction; SD, standard deviation; TAM, Taraxacum mongolicum; TAM (5, 25, 50), a-MSH (100 nM) + TAM (5 μg/mL, 25 μg/mL, and 50 μg/mL) treatment.
3.2.7. PKA protein expression
Whereas PKA protein expression was increased in 5 μg/mL and 25 μg/mL concentrations compared to the only a-MSH treated negative control group, it was significantly decreased in 50 μg/mL concentration by 3.9% (p < 0.001). In addition, it was decreased depending on the TAM concentration (Fig. 8).
Fig. 8.

Effect of TAM on PKA protein expression in B16F10 cell. B16F10 cells were seeded on 100-mm culture dish. After 24 hours, cells were treated with a-MSH, TAM (5 μg/mL, 25 μg/mL, and 50 μg/mL), or kojic acid (50 ppm) for 24 hours. PKA protein expression was analyzed with Western blot. The results represent the mean ± SD of three individual experiments. Statistically significant value was calculated by comparing with negative control group using Turkey's HSD test (* p < 0.05, ** p < 0.01, *** p < 0.001).
a-MSH, a-melanocyte stimulating hormone; HSD, honest significant difference; Negative control, a-MSH (100 nM) treatment; Normal, nontreatment; PKA, protein kinase A; Positive control, a-MSH (100 nM) + kojic acid (50 ppm) treatment; SD, standard deviation; TAM, Taraxacum mongolicum; TAM (5, 25, 50), a-MSH (100 nM) + TAM (5 μg/mL, 25 μg/mL, and 50 μg/mL) treatment.
3.2.8. ERK mRNA gene expression
ERK mRNA gene expression was increased in every concentration compared to the only a-MSH treated negative control group. It was increased in every concentration (5 μg/mL, 25 μg/mL, and 50 μg/mL) compared to kojic acid, the positive control group. There was no significant difference between TAM concentrations (Fig. 9).
Fig. 9.

Effect of TAM on ERK mRNA gene expression in B16F10 cell. B16F10 cells were seeded on 100-mm culture dish. After 24 hours, cells were treated with a-MSH, TAM (5 μg/mL, 25 μg/mL, and 50 μg/mL) or kojic acid (50 ppm) for 24 hours. ERK mRNA gene expression was analyzed with RT PCR. The results represent the mean ± SD of three individual experiments. Statistically significant value was calculated by comparing with negative control group using Turkey's HSD test (* p < 0.05, ** p < 0.01, *** p < 0.001).
a-MSH, a-melanocyte stimulating hormone; HSD, honest significant difference; Negative control, a-MSH (100 nM) treatment; Normal, nontreatment; PKA, protein kinase A; Positive control, a-MSH (100 nM) + kojic acid (50 ppm) treatment; SD, standard deviation; TAM, Taraxacum mongolicum; TAM (5, 25, 50), a-MSH (100 nM) + TAM (5 μg/mL, 25 μg/mL, and 50 μg/mL) treatment.
3.3. Effect of TAM with PW on melanin generation in HRM-2 melanin-possessing hairless mice
3.3.1. Image analysis software
Melanin differences between the untreated left dorsal skin and the sample applied right dorsal skin for the 1st week, the 3rd week, and the 5th week of UVB irradiation are shown in Table 7.
Table 7.
Melanin difference between untreated part (left) and treated part (right)
| Group | 1st wk | 3rd wk | 5th wk |
|---|---|---|---|
| Normal | 1.51 ± 0.16 | 0.63 ± 0.07 | 2.26 ± 1.40 |
| Negative control | 1.87 ± 1.09 | 1.27 ± 0.98 | 2.64 ± 2.29 |
| Positive control | 3.39 ± 1.00 (Fig. 12A) | 27.35 ± 1.28 (Fig. 13A) | 39.45 ± 1.61 (Fig. 14A) |
| Experimental 1 | 2.20 ± 1.07 (Fig. 12B) | 6.19 ± 0.80 (Fig. 13B) | 6.62 ± 2.59 (Fig. 14B) |
| Experimental 2 | 4.03 ± 1.67 (Fig. 12B) | 11.81 ± 2.93 (Fig. 13B) | 12.36 ± 3.66 (Fig. 14B) |
DW, distilled water; Experimental 1, UVB irradiation + 2% TAM + DW cream application; Experimental 2, UVB irradiation + 2% TAM + PW cream application; Negative control, UVB irradiation + Base ointment application; Normal, base ointment application; Positive control, UVB irradiation + 0.5% Sunblock cream application; PW, phreatic water; TAM, Taraxacum mongolicum.
For the 1st week of UVB irradiation, the positive control group, experimental Group 1, and experimental Group 2 were not significantly different from the negative control group (Fig. 10, Fig. 11).
Fig. 10.

Effect of TAM with PW on pigmentation in dorsal skin of HRM-2 mice exposed to UVB. Five weeks after the initiation of UVB irradiation (the stage of hyperpigmentation); dorsal skin left part and right part photograph image analysis. The dorsal skin whitening values showing brightness of skin color were measured using image analysis software (each system ships with one full version of Quantity One and unlimited copies of Quantity One Basic Mode). The results represent the mean ± SE (n = 6). Statistically significant value was calculated by comparing with negative control group using Student t test (* p < 0.05, ** p < 0.01, *** p < 0.001).
DW, distilled water; Experimental 1, UVB irradiation + 2% TAM + DW cream application; Experimental 2, UVB irradiation + 2% TAM + PW cream application; Negative control, UVB irradiation + Base ointment application; Normal, base ointment application; Positive control, UVB irradiation + 0.5% Sunblock cream application; PW, phreatic water; SE, standard error; TAM, Taraxacum mongolicum.
Fig. 11.

Image analysis after 1 week of treatment. (A) Image analysis of treated part (right, 0.5% Sunblock Cream) after 1 week UVB irradiation compared to untreated part (left). Mean means peak area of a half dorsal skin calculated by image analysis software (n = 6). (B) Image analysis of treated part (upper right: 2% TAM + DW; lower right: 2% TAM + PW) after 1 week UVB irradiation compared to untreated part (left). Mean means peak area of a quarter dorsal skin calculated using image analysis software (n = 6).
DW, distilled water; PW, phreatic water; TAM, Taraxacum mongolicum.
For the 3rd week of UVB irradiation, melanin difference between the untreated left dorsal skin and the sunblock cream applied right dorsal skin of the positive control group was significantly increased by 21.6 times compared to the control group (p < 0.001), that of the untreated left upper dorsal skin and the TAM + DW cream applied right upper dorsal skin of the experimental Group 1 by 4.9 times (p < 0.01), and that of the untreated left lower dorsal skin and the TAM + PW cream applied right lower dorsal skin of the experimental Group 2 by 9.4 times (p < 0.01; Fig. 10, Fig. 12).
Fig. 12.

Image analysis after 3 weeks of treatment. (A) Image analysis of treated part (right: 0.5% Sunblock Cream) after 3 weeks UVB irradiation compared to untreated part (left). Mean means peak area of a half dorsal skin calculated by image analysis software (n = 6). (B) Image analysis of treated part (upper right: 2% TAM + DW; lower right: 2% TAM + PW) after 3 weeks UVB irradiation compared to untreated part (left). Mean means peak area of a quarter dorsal skin calculated using image analysis software (n = 6).
DW, distilled water; PW, phreatic water; TAM, Taraxacum mongolicum.
For the 5th week of UVB irradiation, melanin difference between the untreated left dorsal skin and the sunblock cream applied right dorsal skin of the positive control group was significantly increased by 15.0 times compared to the control group (p < 0.001), that of the untreated left upper dorsal skin and the TAM + DW cream applied right upper dorsal skin of the experimental Group 1 by 2.5 times, and that of the untreated left lower dorsal skin and the TAM + PW cream applied right lower dorsal skin of the experimental Group 2 by 4.7 times (p < 0.05; Fig. 10, Fig. 13).
Fig. 13.

Image analysis after 5 weeks of treatment. (A) Image analysis of treated part (right: 0.5% Sunblock Cream) after 5 weeks UVB irradiation compared to untreated part (left). Mean means peak area of a half dorsal skin calculated by image analysis software (n = 6). (B) Image analysis of treated part (upper right: 2% TAM + DW; lower right: 2% TAM + PW) after 5 weeks UVB irradiation compared to untreated part (left). Mean means peak area of a quarter dorsal skin calculated by image analysis software (n = 6).
DW, distilled water; PW, phreatic water; TAM, Taraxacum mongolicum.
3.3.2. RQ PCR analysis
-
(1)
TRP-1 mRNA gene expression. The positive control group significantly inhibited TRP-1 mRNA gene expression by 42.9% (p < 0.01) compared to the negative control group, the experimental Group 1 by 19.2%, and the experimental Group 2 by 33.2% (p < 0.05; Fig. 14).
-
(2)
TRP-2 mRNA gene expression. The positive control group significantly inhibited TRP-2 mRNA gene expression by 28.4% (p < 0.01) compared to the negative control group, the experimental Group 1 by 1.5%, and the experimental Group 2 by 13.1% (p < 0.05; Fig. 15).
-
(3)
MMP-9 mRNA gene expression. The positive control group significantly inhibited MMP-9 mRNA gene expression by 65.4% (p < 0.01) compared to the negative control group, the experimental group 1 by 19.8%, and the experimental group 2 by 36.8% (p < 0.05) (Fig. 16).
Fig. 14.

Effect of TAM with PW on TRP-1 mRNA gene expression in dorsal skin of HRM-2 mice. HRM-2 mice were sacrificed, and TRP-1 mRNA gene expressions were checked in dorsal skin. TRP-1 mRNA gene expressions were analyzed with RQ PCR. The results represent the mean ± SE (n = 6). Statistically significant value was calculated by comparing with negative control group using Student t test (* p < 0.05, ** p < 0.01).
DW, distilled water; Experimental 1, UVB irradiation + 2% TAM + DW cream application; Experimental 2, UVB irradiation + 2% TAM + PW cream application; Negative control, UVB irradiation + Base ointment application; Normal, base ointment application; Positive control, UVB irradiation + 0.5% Sunblock cream application; PW, phreatic water; RQ PCR, real-time quantitative polymerase chain reaction; SE, standard error; TAM, Taraxacum mongolicum.
Fig. 15.

Effect of TAM with PW on TRP-2 mRNA gene expression in dorsal skin of HRM-2 mice. HRM-2 mice were sacrificed, and TRP-2 mRNA gene expressions were checked in dorsal skin. TRP-2 mRNA gene expressions were analyzed with RQ PCR. The results represent the mean ± SE (n = 6). Statistically significant value was calculated by comparing with negative control group using Student t test (** p < 0.01).
DW, distilled water; Experimental 1, UVB irradiation + 2% TAM + DW cream application; Experimental 2, UVB irradiation + 2% TAM + PW cream application; Negative control, UVB irradiation + Base ointment application; Normal, base ointment application; Positive control, UVB irradiation + 0.5% Sunblock cream application; PW, phreatic water; RQ PCR, real-time quantitative polymerase chain reaction; SE, standard error; TAM, Taraxacum mongolicum.
Fig. 16.

Effect of TAM with PW on MMP-9 mRNA gene expression in dorsal skin of HRM-2 mice. HRM-2 mice were sacrificed, and MMP-9 mRNA gene expressions were checked in dorsal skin. MMP-9 mRNA gene expressions were analyzed with RQ PCR. The results represent the mean ± SE (n = 6). Statistically significant value was calculated by comparing with negative control group using Student t test (* p < 0.05, ** p < 0.01).
DW, distilled water; Experimental 1, UVB irradiation + 2% TAM + DW cream application; Experimental 2, UVB irradiation + 2% TAM + PW cream application; Negative Control, UVB irradiation + Base ointment application; Normal, Base ointment application; Positive Control, UVB irradiation + 0.5% Sunblock cream application; PW, phreatic water; RQ PCR, real-time quantitative polymerase chain reaction; SE, standard error; TAM, Taraxacum mongolicum.
3.3.3. Histological analysis
After the experiment, the dorsal skin of the HRM-2 mouse was extracted and dyed with hematoxylin and eosin. Based on the analysis result, compared to the normal group, the epidermis of the negative control group was excessively formed in thickness and expanded, and around it, hyperkeratinization, pigmentation, granum, and infiltration were significantly increased—indicating that the skin texture was damaged by UVB irradiation.
It was observed that, compared to the negative control group, the epidermis of the positive control group, experimental Group 1, and experimental Group 2 was narrowed, and around it, cell deformation, keratinization, and infiltration were decreased, closely resembling what was observed in the normal group. In particular, it was observed that the epidermis of experimental Group 2 is narrowed, resembling more closely that of the normal group than that of experimental Group 1 (Fig. 17).
Fig. 17.

Histological test in dorsal skin of HRM-2 mice. HRM-2 mice were sacrificed, and dorsal skin were processed for histology and stained with hematoxylin and eosin. It shows the thickening of the epidermis by bright microscope.
DW, distilled water; Experimental 1, UVB irradiation + 2% TAM + DW cream application; Experimental 2, UVB irradiation + 2% TAM + PW cream application; Negative control, UVB irradiation + Base ointment application; Normal, base ointment application; Positive control, UVB irradiation + 0.5% Sunblock cream application; PW, phreatic water; TAM, Taraxacum mongolicum.
4. Discussion
Skin color is mainly determined by melanin distributed in the epidermal layer, hemoglobin in the dermal layer, and carotene in the subcutaneous tissue. Among these factors, melanin plays the most important role in determining skin color.2 The term melanin, which originates from the Greek word melas, means black.28 It is a brownish black pigment and is largely distributed in the deep layer and the basal layer under the visible epidermal layer. The melanocyte distributed on the epidermis synthesizes melanin and plays an important role in skin pigmentation, and it is known that the generated melanin moves to the keratinocyte and performs a light-protection action that absorbs and blocks excessive UV rays.2, 3, 4
Melanin synthesis is started by the reaction in which tyrosine, one of the amino acids, is converted to DOPA quinone by tyrosinase. Whereas DOPA quinone acts as an important precursor that biosynthesizes pheomelanin and eumelanin by two different paths, eumelanin—which is brownish black—is generally known as melanin.29 Looking at the eumelanin formation process, DOPA quinone is converted to DOPA chrome, to 5- and 6-dihydroxyindole-2-carboxylic acids by TRP-2, and to indole-5 and 6-quinone-2-carboxylic acids by TRP-1. Through a series of these reactions, melanin is formed.30, 31, 32
The main intracell signal transfer path of melanin is the cyclic monophosphate (cAMP)/PKA path and cAMP promotes MITF expression via the PKA and CREB1. MITF is an important transcription control factor in the melanin synthesis process, and it is known to promote transcription of tyrosinase, TRP-1 and TRP-2.33, 34 In addition, if the expression of ERK, which is the intracell signal transfer protein and is known as the gene expression controlling factor, is inhibited, it is implied that melanin pigment generation is increased.35
In oriental medicine, <Jijinyodaeron ( ) > of “Hwangjenegyeng·Somun (
 )”36 first mentioned skin hyperpigmentation as “If yangmyeong is in springwater, overflowing dryness win…seem to face in the dirt, it is no body shine and it has fever on foot outside. (
 ,
,  ,
,  ,
,  ,
,  ).” < Myunganheukjeunghu (
 ) > of “Jebyungwonhuron (
 )”37 specifically describes its pathologic mechanism and types, stating that “Oma (
 )” appears on the face if the pathogenic wind penetrates the skin and phlegm retention is accumulated in organs. Since then, it has been variously expressed as Ganjeung (
 ), Ganjeom (
 ), Jakran (
 ), and Banganjeung (
 ), depending on appearance and color by many medicine practitioners.38
In oriental medicine, Lew39 and others viewed skin hyperpigmentation to be caused by short of Yangmyeong's energy according to the Myunjin ( ) theory of “Hwangjenegyeng·Somun (
 ).”36 Cho40 and others viewed it as an imbalance between vital energy and blood owing to pathogenic wind and phlegm retention. Lee41 and others viewed it as damage of the stomach due to overthoughtfulness or malnutrition. Chin42 and others viewed it as consumptive fever generated due to shortness of kidney energy. Chu43 and others considered fever as the main cause. < Oehyungpyun Myunsangzabbyung (
 ) > of “Donguibogam (
 )”38 states “If you have Pungja (
 ), Bunja (
 ), Jakranban (
 ), Ganjeung (
 ), Yeomja (
 ) on face, you can use okyong-san (
 ), yeongyo-san (
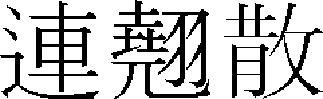 ), hongok-san (
 ), okyongseossi-san (
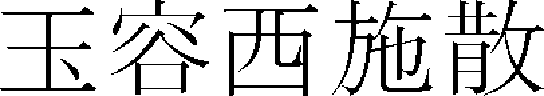 ), hwangjedoyongkimmyeonbang (
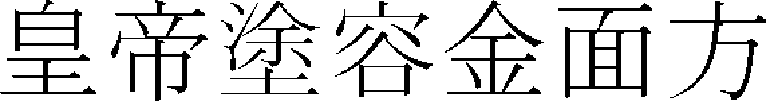 ), okyong-go (
 ). (
). ( ,
,  ,
,  ,
,  ,
,  ,
,  ,
,  ,
,  ,
,  ,
,  ,
,  ),” and various treatments have been applied to various facial skin disorders.
To date, various whitening studies have been conducted using medicinal herbs8, 9, 10 or herbal medicine prescriptions.11, 12, 13 Most of studies verified the whitening effect by inhibition of tyrosinase activation, gene expression of tyrosinase, TRP-1 and TRP-2 involved in melanin generation, and expression of PKA, the signal transfer factor.
Among the current whitening effect studies using TAM, the study of Paek18 measured the inhibition rate of TAM on the activation of tyrosinase in the tube, separated luteolin-7-O-ß-d-glucopyranside, one of the effective components, and identified that this compound inhibits melanin generation in the B16 melanoma cell and has an inhibitory effect on melanin hypergeneration caused by a-MSH and forskolin induction. The study of Kang19 identified one of the effective components of TAM called esculetin to exhibit the whitening activation effect not only on cells but also to hairless mice.
However, few studies have identified the whitening effect by RT PCR and Western blot analysis, specifically if TAM inhibits enzymes and signal transfer factors involved in melanin generation.
To identify the whitening effect of TAM, first the effective HPLC component of TAM was analyzed and the luteolin content was identified. Currently, it is known that luteolin is effective in terms of antioxidant activation, whitening effect,44 and repercussive and analgesic actions.45 In the recent study by Hur,46 luteolin did not inhibit tyrosinase activation directly, but it concentration-dependently inhibited tyrosinase activation and melanin generation increase by a-MSH in the B16 melanoma cell as well as cAMP generation by MSH and forskolin, which identified the action mechanism of its whitening action generation.
Next, using B16F10 mouse melanoma cell, it was experimentally identified that TAM exerts a whitening effect via inhibition of gene expression and signal transfer mechanism of enzymes involved in melanin generation.a-MSH used for melanin generation in this experiment is the factor generated in various organs including hypophysis and skin, and in the skin, it is generated from keratinocyte, melanocyte, langerhans cell, fibroblast, and endotheliocyte. It is known as a drug that induces tyrosinase expression and activation and promotes melanin generation by increasing cAMP in the cell.47, 48 Kojin acid used for the positive control group of TAM is a kind of powder. It is the mycete component of the fermented soybean fungus or the aspergillus, which was developed after it was observed that the hands of employees of miso or sake factories turned white, and it is the material with a whitening function that has recently provoked carcinogenesis controversy.49, 50, 51
The option of using hot spring water for this study was prompted by the phenomenon that it is a special natural water physically and chemically different from common water that flows out to the surface of the earth from underground.52 Article 2 of Hot Spring Act enacted as Law No. 3377 on March 2, 1981 defines it as “The term ‘hot spring’ means hot water at 25 °C or above, that gushes forth from underground, and the ingredients of which meet the standards prescribed by Presidential Decree.”53
It is known that PW promotes cellular metabolism and has efficacy on rheumatoid arthritis, neuralgia, osteomyelitis, nephritis, cystitis, and metabolic diseases.54 Crenotherapy using such PW has been used for the purpose of dietary treatment, recuperation, and local inflammation and pain treatment for thousands of years. Historical records show that hot springs in Korea have been used for disease treatment since the Koryo Dynasty.54 The PW used in crenotherapy is largely used for the treatment of skin disorders such as psoriasis and atopic dermatitis. Although the mechanism for improving such skin disorders has not been completely discovered yet, it is known that the spa water effect multiplies the bathing effect and provides treatment effects on skin disorders.20
Looking at the efficacy of hot springs in more detail, it can be largely explained in terms of their chemical, physical, thermal, and immunological aspects. Its chemical effect is directly associated with its components—sulfur exerts an anti-inflammatory action; dekeratinization has antipruriginous action, antibacterial action, and antifungal action55; magnesium has psoriasis treatment action, as well as carcinostatic and vasodilation action56, 57, 58; and although selenium is toxic if used in excessive amounts, in small, manageable doses, it promotes DNA synthesis and cell growth and it has antioxidant and anti-inflammatory properties as well as UVA and UVB protection action.59 Aside from this, iron, lithium, zinc, manganese, and strontium also have chemical actions. The thermal effect includes vasodilation, blood circulation promotion, blood pressure reduction, pain reduction, immune-inhibitory effect, and anti-inflammatory effect.60, 61 The physical effect includes muscle tone reduction, joint mobility increase, and pain intensity reduction.62 For the immunological effect, the sulfur water generates various cytokines and inhibits loss of cytokines.63
In oriental medicine, the principles of crenotherapy can be found in such statements as “Water is the source of all change (
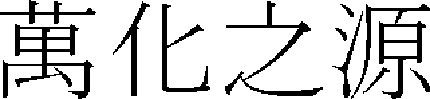 ),” “The form is pure yin (
 ) and the using is pure yang (
 ) (
) ( ,
,  ),” and “If there is no water, nutrients are removed (
 ).” By nature PW is hot and a bit toxic, and spa bathing can remove scabies and skin disease.64 In addition, < Supumron (
 )> of “Donguibogam (
 )”38 divides water into 33 types and describes the nature and use of each type of water. Naturally, the nature and use of PW are also included.
In regard to recent studies on PW, there was a study that used PW from Suanbo Hot Springs, which is known as a simple spring of hot alkaline sodium-type silicon oxide, and found that it normalizes keratinocyte differentiation, restores the damaged skin barrier function, and reduces inflammatory cells from the skin by using atopic dermatitis induction NC/Nga mouse.65 Another study used PW from Dogo Hot Springs and found that it effectively controls allergic inflammatory response and that it can be used for atopic skin disorder by using atopic dermatitis induction NC/Nga mouse.22
As such, PW can be used for various skin disorders, and many researchers have studied the variety of use and efficacy of PW. However, to date there have only been few studies on its whitening effect. Accordingly, this study was intended to figure out if using TAM together with PW from Dogo Hot Springs increases the inhibitory effect on melanin generation, as previous studies proved that TAM inhibits melanin generation and another previous study on organs analyzed the components of PW from Dogo Hot Springs.22
Paradise Spa Dogo, where this study was conducted, is located across Gigok-ri, Dogo-myeon, and Sinseong-ri, Seonjang-myeon in Asan-si, Chungcheongnam-do, Korea. It is a sulfurous spa classified as a light alkali spring and a light salty spring. Its water temperature is 25–32.5 °C.66
It was found that TAM with PW had a more excellent inhibitory effect on melanin generation in HRM-2 melanin-possessing hairless mice. It also showed an aging inhibitory effect as it identified that increased activation inhibited matrix metalloproteinase-9 (MMP-9),67 which is the wrinkling material that destroys proteins in the skin (such as collagen) and progresses aging.
These results indicate that TAM with PW exert an inhibitory effect on melanin synthesis. Therefore, it is considered that TAM with PW can be used for treatment of skin hyperpigmentation such as melisma and freckle, and can be further used for development of whitening cosmetics with few skin side effects. In addition, because this study exhibited the aging inhibitory effect as well, it is considered that additional studies of TAM with PW on aging inhibition mechanism are needed.
However, because this study was performed on a limited number of experimental objects and conducted on animals only, it is considered that clinical studies on hyperpigmented individuals will be needed. In addition, because this study identified that TAM had an outstanding melanin generation inhibition and had an inhibitory effect when used along with PW, it is considered that further continuous and various studies on the use of PW are needed in addition to more studies on TAM with PW on various categories.
Conflicts of interest
All contributing authors declare no conflicts of interest.
Acknowledgments
This study was supported by a third academic research of Asan-si Medical tourism spa services project.
References
- 1.Lee SH, Ahn SG, Jung SG. Skin barrier. Seoul: Ryo Moon Gak; 2010, p. 1–7 [In Korean].
- 2.Textbook Compilation Committee of Korean Dermatological Association. Dermatology. Seoul: Ryo Moon Gak; 2001, p. 1-9, 409-12, 533-5 [In Korean].
- 3.Chenm J.S., Wei C., Marshall M.R. Inhibition mechanism of Kojic acid on polyphenol oxidase. J Agric Food Chem. 1991;39:1897–1901. [Google Scholar]
- 4.Urabe K., Aroca P., Tsukamoto K., Mascagna D., Palumbo A., Prota G. The inherent cytotoxicty of melanin precursors. Biochim Biophys Acta. 1994;1221:272–278. doi: 10.1016/0167-4889(94)90250-x. [DOI] [PubMed] [Google Scholar]
- 5.Ha BJ. Cosmeceuticals. Seoul: Shinkwang; 2001, p. 66-84, 138-40, 143-7 [In Korean].
- 6.Curto E.V. Inhibitors of mammalian melanocytes tyrosinase: in vitro comparisons of alkyl esters of gentisic acid with other putative inhibitors. Biochem Pharmacol. 1992;57:663–672. doi: 10.1016/s0006-2952(98)00340-2. [DOI] [PubMed] [Google Scholar]
- 7.Chakraborty A.K. Effect of arbutin on melanogenic proteins in human melanocytes. Pigment Cell Res. 1998;11:206–212. doi: 10.1111/j.1600-0749.1998.tb00731.x. [DOI] [PubMed] [Google Scholar]
- 8.Kim J., Kwen I.H., Lim H.J., Lim K.S., Hwang C.Y. Inhibitory effect and mechanism on melanogenesis of Radix glycyrrhizae water extract. J Korean Orient Med Ophthalmol Otolaryngol Dermatol. 2003;16:96–118. [In Korean, English abstract] [Google Scholar]
- 9.Doo I.S., Lim K.S., Hwang C.Y., Park M.C., Kim N.K. A study on the melanin synthesis inhibition and whitening effect of Schizandrae fructus. J Korean Orient Med Ophthalmol Otolaryngol Dermatol. 2007;20:51–62. [In Korean, English abstract] [Google Scholar]
- 10.Kim D.S., Sung B.G., Lee J.C., Lee B.K., Woo W.H., Lim K.S. Inhibitory effect of Belamcandae Rhizoma on the melanogenesis in MSH-stimulated B16F10 cells. J Korean Orient Med Ophthalmol Otolaryngol Dermatol. 2011;24:25–35. [In Korean, English abstract] [Google Scholar]
- 11.Son D.S., Kim Y.B. Depigmentation activity of Kakamseosiokyong-san. J Korean Orient Med Ophthalmol Otolaryngol Dermatol. 2002;15:104–117. [In Korean, English abstract] [Google Scholar]
- 12.Park H.S., Kim H.J., Kim Y.B. The study on depigmentation of Kamikwibi-tang. J Korean Orient Med Ophthalmol Otolaryngol Dermatol. 2004;17:48–58. [In Korean, English abstract] [Google Scholar]
- 13.Oh W.K., Kim K.B., Lim J.Y., Lee S.K., Kwon Y.D., Yeom S.R. Effects of Dokhwalkisaeng-tang on melanin synthesis inhibition and gene expression in B16F10 melanoma cells. Korean J Orient Pathol. 2009;23:63–75. [In Korean, English abstract] [Google Scholar]
- 14.Joint Textbook Compilation Committee of Colleges of Oriental Medicine. Herbology. Seoul: Yeongrimsa; 2005, p. 245–7 [In Korean].
- 15.Lee M.H., Song S.H., Ham I.H., Bu Y.M., Kim H.C., Choi H.Y. Anti-inflammatory effect and contents from the aerial part and root of the various Taraxacum spp. distributed in Korea. Korea J Herbol. 2010;25:77–84. [In Korean, English abstract] [Google Scholar]
- 16.Jang M.H., Choi J.S., Bae N.Y., Ahn T.W. Effects of TAM (Taraxacum mongolicum) on Th2 cytokine production in MC/9 mast cells. J Sasang Const Med. 2012;24:54–65. [In Korean, English abstract] [Google Scholar]
- 17.Kim H.W., Kim B.J., Lim S.H., Kim H.Y., Lee S.Y., Cho S.I. Anti-oxidative effects of Taraxaci Herba and protective effects on human HaCaT keratinocyte. Korea J Herbol. 2009;24:103–108. [In Korean, English abstract] [Google Scholar]
- 18.Paek IN. Inhibitory effects of flavonoid from commercial Taraxaci Herba on the melanin biosynthesis [MS thesis]. Seoul, Korea: Graduate School of Chungang University; 2004, 1–33 [In Korean, English abstract].
- 19.Kang JR. Anti-oxidation and melanin inhibition characteristics of Taraxacum platycarpum and Compositae plants [PhD thesis]. Seoul: Graduate School of Konkuk University; 2009, p. 1–89 [In Korean, English abstract].
- 20.Tishler M., Shoenfel Y. The medical and scientific aspects of spa therapy. Isr J Med Sci. 1996;32:8–10. [PubMed] [Google Scholar]
- 21.Millikan L.E. Complementary medicine in dermatology. Clin Dermatol. 2002;20:602–605. doi: 10.1016/s0738-081x(02)00263-8. [DOI] [PubMed] [Google Scholar]
- 22.Jang M.H., Go G.Y., Ahn Y.C., Ahn T.W. Effect of DOGO phreatic water containing sulphur on atopic dermatitis in NC/Nga mouse. J Korean Orient Medi Ophthalmol Otolaryngol Dermatol. 2013;26:36–53. [In Korean, English abstract] [Google Scholar]
- 23.Carmichael J., DeGraff W.G., Gazdar A.F., Minna J.D., Mitchell J.B. Evaluation of a tetrazolium based semiautomated colorimetric assay: assessment of chemosensitivity testing. Cancer Res. 1987;47:936–942. [PubMed] [Google Scholar]
- 24.Yagi A., Kanbara T., Morinobu N. The effect of tyrosinase inhibition for aloe. Planta Med. 1986;3981:517–519. doi: 10.1055/s-2006-962798. [DOI] [PubMed] [Google Scholar]
- 25.Furuya R., Akiu S., Ideta R., Naganuma M., Fukuda M., Hirobe T. Changes in the proliferative activity of epidermal melanocytes in serum-free primary culture during the development of ultraviolet radiation B-induced pigmented spots in hairless mice. Pigment Cell Res. 2002;15:348–356. doi: 10.1034/j.1600-0749.2002.02035.x. [DOI] [PubMed] [Google Scholar]
- 26.Kimura Y., Sumiyoshi M. French maritime pine bark (Pinus maritima Lam.) extract (Flavangenol) prevents chronic UVB radiation-induced skin damage and carcinogenesis in melanin-possessing hairless mice. Photochem Photobiol. 2010;86:95563. doi: 10.1111/j.1751-1097.2010.00751.x. [DOI] [PubMed] [Google Scholar]
- 27.Sumiyoshi M., Kimura Y. Effects of a turmeric extract (Curcuma longa) on chronic ultraviolet B irradiation-induced skin damage in melanin-possessing hairless mice. Phytomedicine. 2009;16:1137–1143. doi: 10.1016/j.phymed.2009.06.003. [DOI] [PubMed] [Google Scholar]
- 28.The Korean Society of Pathologists. Pathology, vol. 2. Seoul: Komoonsa; 1996, p. 58 [In Korean].
- 29.Jimbow K., Chen H., Park J.S., Thomas P.D. Increased sensitivity of melanocytes to oxidative stress and abnormal expression of tyrosinase-related protein in vitiligo. Br J Dermatol. 2001;144:55. doi: 10.1046/j.1365-2133.2001.03952.x. [DOI] [PubMed] [Google Scholar]
- 30.Tsukamoto K., Jackson I.J., Urabe K., Montague P.M., Hearing V.J. A second tyrosinase-related protein, TRP-2, is a melanogenic enzyme termed DOPAchrome tautomerase. EMBO J. 1992;11:519–526. doi: 10.1002/j.1460-2075.1992.tb05082.x. [DOI] [PMC free article] [PubMed] [Google Scholar]
- 31.Boissy R.E., Sakai C., Zhao H., Kobayashi T., Hearing V.J. Human tyrosinase related protein-1(TRP-1) does not function as a DHICA oxidase activity in contrast to murine TRP-1. Exp Dermatol. 1998;7:198–204. doi: 10.1111/j.1600-0625.1998.tb00324.x. [DOI] [PubMed] [Google Scholar]
- 32.Jimbow K. Increased sensitivity of melanocytes to oxidative stress and abnormal expression of tyrosinase-related protein in vitiligo. Br J Dermatol. 2001;144:55. doi: 10.1046/j.1365-2133.2001.03952.x. [DOI] [PubMed] [Google Scholar]
- 33.Busca R., Ballotti R. Cyclic AMP a key messenger in the regulation of skin pigmentation. Pigment Cell Res. 2000;13:60–69. doi: 10.1034/j.1600-0749.2000.130203.x. [DOI] [PubMed] [Google Scholar]
- 34.Saha B., Singh S.K., Sarkar C., Bera R., Ratha J., Tobin D.J. Activation of the MITF promoter by lipid-stimulated activation of p38-stress signalling to CREB. Pigment Cell Res. 2006;29:595–605. doi: 10.1111/j.1600-0749.2006.00348.x. [DOI] [PubMed] [Google Scholar]
- 35.Zhang W., Tsan R., Nam D.H., Lu W., Fidler I.J. Loss of adhesion in the circulation converts amelanotic metastastic melanoma cells to melanotic by inhibition of AKT. Neoplasia. 2006;8:543–550. doi: 10.1593/neo.05655. [DOI] [PMC free article] [PubMed] [Google Scholar]
- 36.Hong W.S. Institute of Oriental Medicine Press; Seoul: 1985. Jeonggyo Hwangje-Naegyeong Somun (精校黃帝內經素問) p. 11, 295–96. [Google Scholar]
- 37.So W.B. Daeseong Cultural Press; Seoul: 1992. So’ Jebyungwonhuron (諸病源候論) p 200, 302. [Google Scholar]
- 38.Heo J. Bubin Publishers; Seoul: 2005. Dongeuibogam (東醫寶鑑) p. 1992. [In Korean] [Google Scholar]
- 39.Lew Y. Daeseong Cultural Press; Seoul: 1986. Uihakgangmok (醫學綱目) p. 1081. [Google Scholar]
- 40.Cho G. People's Medical Publishing House; Beijing: 1987. Seongjechongrok (聖濟總錄) p. 1763. [Google Scholar]
- 41.Lee J. Pyeonjuuihakipmoon (編註醫學入門), vol. 4. Seoul: Daeseong Cultural Press; 1990, p. 29, 63–4, 224.
- 42.Chin S.G. Shanghai Science and Technology Publishing; Shanghai: 1989. Oegwajeongjong (外科正宗) p. 290, 298. [Google Scholar]
- 43.Joo J.H. People's Medical Publishing House; Beijing: 1993. Dangyeeuijip (丹溪醫集) p. 24. [Google Scholar]
- 44.Pawlak-Lemanska K., Tyrakowska B., Szymusiak H., Soffers A.E.M.F., Rietjens I.M.C.M. pH-dependent antioxidant properties of quercetin and luteolin metabolites. Free Radic Res. 2002;36:202–208. [Google Scholar]
- 45.Abdalla S., Abu Zarga M., Sabri S. Effects of the flavone luteolin, isolated from Colchicum richii, on guinea-pig isolated smooth muscle and heart and on blood pressure and blood flow. Phytother Res. 1994;8:5–9. [Google Scholar]
- 46.Hur HS. Anti-oxidant activity and whitening activity of luteolin [MS thesis]. Seoul: Graduate School of Chungang University; 2007, p. 1-45 [In Korean, English abstract].
- 47.Chakraborty A.K., Funasaka Y., Slominski A., Ermak G., Hwang J., Pawelek J.M. Production and release of pro-opiomelanocortin (POMC) derived peptides by human melanocytes and keratinocytes in culture: regulation by ultraviolet B. Biochim Biophys Acta. 1996;1313:130–138. doi: 10.1016/0167-4889(96)00063-8. [DOI] [PubMed] [Google Scholar]
- 48.Aberdam E., Bertolotto C., Sviderskaya E.V., de Thillot V., Hemesath T.J., Fisher D.E. Involvement of microphthalmia in the inhibition of melanocyte lineage differentiation and of melanogenesis by agouti signal protein. J Biol Chem. 1998;273:19560–19566. doi: 10.1074/jbc.273.31.19560. [DOI] [PubMed] [Google Scholar]
- 49.Fuuimoto N., Watanabe H., Nakatani T., Roy G., Ito A. Induction of thyroid tumours in (C57BL/6NxC3H/N) F1 mice by oral administration of kojic acid. Food Chem Toxicol Sci. 1998;73:287–293. doi: 10.1016/s0278-6915(98)00030-1. [DOI] [PubMed] [Google Scholar]
- 50.Takizawa T., Mitsumori K., Tamura T., Nasu M., Ueda M., Imai T. Hepatocellular tumor induction in heterozygous p53-deficient CBA mice by a 26-week dietary administration of kojic acid. Toxicol Sci. 2003;73:287–293. doi: 10.1093/toxsci/kfg094. [DOI] [PubMed] [Google Scholar]
- 51.Lee S.H., Park J.S., Kim S.Y., Kim J.J., Chung S.R. Isolation of inhibitory components on tyrosinase activity from the bark of Paeonia moutan. Yakhak Hoeji. 1998;42:353–358. [In Korean, English abstract] [Google Scholar]
- 52.Lee Y.H. A Comparative study of geological characteristics traditional spa and newly-established spa. J Korean Geogr Soc. 2007;42:851–862. [In Korean, English abstract] [Google Scholar]
- 53.Park H. Korea Culture & Tourism Institute; Seoul: 1989. Ildong sulfur springs as the national health promotion, national recreation and tourist resort. p. 212,236–8. [In Korean] [Google Scholar]
- 54.Cha Y.Y., Kim D.G., Heo S.K., Kim E.G., Heo Y.J., Kong I.P. A literature review and study on effect of balneotherapy. J Korean Orient Med Ophthalmol Otolaryngol Dermatol. 2007;20:132–141. [In Korean, English abstract] [Google Scholar]
- 55.McMurtry C.W. Dermatologic therapeutics: sulfur. J Cutan Dis. 1913;322:399–408. [Google Scholar]
- 56.Lowe N.Y., Breeding Y., Russel D. Cutaneous polyamines in psoriasis. Br J Dermatol. 1982;107:21–26. doi: 10.1111/j.1365-2133.1982.tb00285.x. [DOI] [PubMed] [Google Scholar]
- 57.Blondell J.M. The anti-carcinogenic effect of magnesium. Med Hypotheses. 1980;6:863–871. doi: 10.1016/0306-9877(80)90010-9. [DOI] [PubMed] [Google Scholar]
- 58.Shani J., Kushelevsky A.P., Harari M., Even-Paz Z. Sustained decreased of blood pressure in psoriatic patients during treatment at the Dead Sea. Pharmacol Res. 1995;31:355–359. doi: 10.1016/1043-6618(95)80089-1. [DOI] [PubMed] [Google Scholar]
- 59.Moysan A., Morliere P., Marquis L., Richard A., Dubertret L. Effects of selenium on UVA-induced lipid peroxidation in cultured human skin fibroblasts. Skin Pharmacol. 1995;8:139–148. doi: 10.1159/000211337. [DOI] [PubMed] [Google Scholar]
- 60.Jeroza D., Vigas M., Tatar P., Jurcovicora J., Palat M. Rise in plasma beta-endorphin and ACTH in response to hyperthermia in sauna. Horm Metab Res. 1985;17:693–694. doi: 10.1055/s-2007-1013648. [DOI] [PubMed] [Google Scholar]
- 61.Cozzi F., Laxxarin P., Todesco S., Cima L. Hypothalamic–pituitary–adrenal axis dysregulation in healthy subjects undergoing mud-bath application. Arthritis Rheum. 1995;38:724–725. doi: 10.1002/art.1780380530. [DOI] [PubMed] [Google Scholar]
- 62.O’Hare J.P., Heywood A., Summerhayes C., Lunn G., Evans J.M., Walters G. Observation on the effects of immersion in bath spa water. Br Med J. 1985;291:1747–1751. doi: 10.1136/bmj.291.6511.1747. [DOI] [PMC free article] [PubMed] [Google Scholar]
- 63.Valitutti S., Costellino F., Musiani P. Effect of sulphurus “thermal” water on T lymphocytes proliferative response. Ann Allergy. 1990;65:463–468. [PubMed] [Google Scholar]
- 64.National Federation of Department of Rehabilitation Medicine, Colleges of Oriental Medicine. Oriental rehabilitation medicine. Seoul: Seowondang; 1995, p. 445–6 [In Korean].
- 65.Song E.J., Choi Y.J., Kim H.S., Park H., Lee H.J., Cho K.A. Effect of Suanbo hot spring bathing on atopic dermatitis in Nc/Nga mouse [oral presentation] Korean Dermatol Assoc Abstract Book. 2011;63:123–124. [In Korean] [Google Scholar]
- 66.Lee W.H. Therapeutic effect about hot spring water as Korea traditional hydrotherapy. J Rehabil Sci Res. 2009;27:55–64. [In Korean, English abstract] [Google Scholar]
- 67.Nagase H., Visse R., Murphy G. Structure and function of matrix metalloproteinases and TIMPs. Cardiovasc Res. 2006;69:562–573. doi: 10.1016/j.cardiores.2005.12.002. [DOI] [PubMed] [Google Scholar]