

Abstract
Background
China is estimated to have had the largest number of people with diabetes in the world in 2015, with extrapolation of existing data suggesting that this situation will continue until at least 2030. Type 2 diabetes has been reported to be more prevalent among people with low socioeconomic status (SES) in high–income countries, whereas the opposite pattern has been found in studies from low– and middle–income countries. We conducted a systematic review to describe the cross–sectional association between SES and prevalence of type 2 diabetes in Chinese in mainland China, Hong Kong and Taiwan.
Methods
We conducted a systematic literature search in Medline, Embase and Global Health electronic databases for English language studies reporting prevalence or odds ratio for type 2 diabetes in a Chinese population for different SES groups measured by education, income and occupation. We appraised the quality of included studies using a modified Newcastle–Ottawa Scale. Heterogeneity of studies precluded meta–analyses, therefore we summarized study results using a narrative synthesis.
Results
Thirty–three studies met the inclusion criteria and were included in the systematic review. The association between education, income and occupation and type 2 diabetes was reported by 27, 19 and 12 studies, respectively. Most, but not all, studies reported an inverse association between education and type 2 diabetes, with odds ratios (OR) and 95% confidence interval (CI) ranging from 0.39 (CI not reported) to 1.52 (95% CI 0.91 – 2.54) for the highest compared to the lowest education level. The association between income and type 2 diabetes was inconsistent between studies. Only a small number of studies identified a significant association between occupation and type 2 diabetes. Retired people and people working in white collar jobs were reported to have a higher risk of type 2 diabetes than other occupational groups even after adjusting for age.
Conclusions
This first systematic review of the association between individual SES and prevalence of type 2 diabetes in China found that low education is probably associated with an increased prevalence of type 2 diabetes, while the association between income and occupation and type 2 diabetes is unclear.
The prevalence of diabetes in China has increased markedly (and much faster than in high income countries) over recent decades [1]. Nationally representative surveys indicate an increase in prevalence of diabetes in China from about 0.9% in adults aged 30 years or older in 1980 to 11.6% in adults aged 18 years or older in 2010 [2,3]. China is thought to have had the largest number of people with diabetes in the world in 2015, with extrapolation of existing data suggesting that this situation will continue until at least 2030 [4].
Socioeconomic status (SES) is a complex concept that describes the position an individual occupies in the structure of society [5]. It consists of many dimensions and is often measured by using several indicators such as income, education and occupation. SES has been recognized as an important determinant of a population’s health [6]. SES is closely linked to a wide range of health problems, including communicable and non–communicable diseases, with different strengths and directions of association in different populations [7–12]. Unlike many risk factors that have consistently shown an association with diabetes across populations, including age, overweight/obesity and physical inactivity, the association between SES and diabetes is not the same in all populations [4,13–15]. In high–income countries, type 2 diabetes is more prevalent among lower than higher socioeconomic groups [10,16–21], whereas the opposite pattern has been found in studies from low– and middle–income countries undergoing rapid economic development [22–25].
Evidence from developed countries indicates that, during the epidemiological transition, noncommunicable diseases occur initially in high SES groups, before appearing in low SES groups [26]. China has experienced extremely rapid economic development over the past 30 years and major economic inequality exists within and between regions, but it is not clear how this is associated with diabetes prevalence [27]. Previous studies have reported inconsistent associations between SES and prevalence of type 2 diabetes in China [28–31]. Understanding the association between SES and diabetes in China is necessary in order to attempt to address socioeconomic health disparities in diabetes as well as for planning approaches to primary and secondary prevention of diabetes in the Chinese population.
To our knowledge, there is no published systematic review of SES and prevalence of type 2 diabetes in China. We conducted a systematic review of cross–sectional studies to describe the association between SES (measured by education, income and occupation) and prevalence of type 2 diabetes in Chinese populations in mainland China, Hong Kong and Taiwan. Chinese people in Hong Kong and Taiwan are genetically similar to their counterparts in mainland China. However, the former are at a more advanced stage of economic development and epidemiological transition, with a larger proportion of people living in urbanised environments and developing related lifestyle habits than in China. Health care systems also differ to that of mainland China [32]. Understanding the association between SES and type 2 diabetes in Hong Kong and Taiwan is useful for helping estimate future diabetes prevalence in urban areas of mainland China.
METHODS
Literature search
This systematic review was conducted using the PRISMA guideline (see checklist in Appendix S1 in Online Supplementary Document(Online Supplementary Document)). The protocol was registered on PROSPERO and can be accessed at http://www.crd.york.ac.uk/PROSPERO/display_record.asp?ID=CRD42016047913. We carried out a systematic literature search of published studies describing the association between SES and prevalence of type 2 diabetes in mainland China, Hong Kong and Taiwan. We searched Medline (1946–May 2016), Embase (1980–May 2016) and Global Health (1973–May 2016) using a comprehensive search strategy (Appendix S2 in Online Supplementary Document(Online Supplementary Document)). Although the primary reviewers are Chinese, we did not include Chinese databases because other members of the research team, who provided additional review input, are not Chinese speakers. No limits were applied for language or publication time.
Study selection and data extraction
We included cross–sectional population–based studies and baseline surveys of population–based cohort studies which: included Chinese populations in mainland China, Hong Kong or Taiwan aged 18 years or older; reported data on prevalence of type 2 diabetes or odds ratio of type 2 diabetes for populations in different SES groups; defined individual SES exposure as education, income or occupation; and were written in English. We excluded: case–control and hospital–based studies; studies limited to populations selected for specific characteristics such as hypertension or obesity; and non–English language articles. If data from the same study were reported in multiple publications, we applied the following three criteria in the order given, thereby including the publication with either: more information on the association between SES indicators and type 2 diabetes; a greater number of participants; or the most recent publication date. We did not include longitudinal studies as no longitudinal studies of incidence of diabetes in different SES groups in mainland China were identified in our pilot literature search. We conducted a pilot literature search for longitudinal studies published after 2010 based on a systematic review published in 2011, which reported no studies of incidence of diabetes and SES were identified in China [15].
Two authors (HW and XM) screened the titles, abstracts and (for potentially relevant studies) full text of articles and independently extracted key characteristics for included articles. We extracted information on: author; study year; year of publication; sample size; number of people with type 2 diabetes; demographics; participant selection; study location; SES measures; diabetes diagnosis method; outcome measures (prevalence and odds ratio); and adjustments for potential confounders. Where possible, confidence intervals for prevalence and odds ratio were calculated if they were not reported by authors. For studies reporting several models to estimate the association between SES and diabetes, the result from the model with the most complete adjustment for confounding was chosen. Disagreements were resolved by discussion between the two authors (HW and XM) with a third author acting as arbiter if a decision could not be made.
Quality assessment
Two authors (HW and XM) independently appraised the quality of included studies using a modified Newcastle–Ottawa Scale (NOS) for cohort studies (Appendix S3 in Online Supplementary Document(Online Supplementary Document)) which allows a quantitative assessment of study quality [33]. This scale contains six items, categorized into three dimensions including selection, comparability, and outcome. Within the selection category, a study can be awarded one score for each of the following items: representativeness of the sample; description of the sample; and ascertainment of SES exposures. Within the comparability category, a maximum of two scores were given for the control of confounding factors. Within the outcome category, a maximum of two scores were given for the assessment of the diagnosis of diabetes and one score for the confidence intervals and probability level reported in studies. Each study was scored from 0–8, with a higher score representing higher quality.
Synthesis of study findings
We reported type 2 diabetes prevalence and odds ratios for associations between SES indicators and type 2 diabetes for each of education, income and occupation. For education and income, we presented summary figures showing the prevalence of type 2 diabetes in the lowest and highest SES level and odds ratios of type 2 diabetes for the highest compared with lowest SES level from the model with the most complete adjustment for confounding. Ideally, we would have summarized odds ratios adjusted for age and sex only, but unfortunately few studies reported these minimally adjusted estimates, with most adjusting for additional factors. For studies reporting results only in several subgroups (eg, stratified by age and gender), we presented the result with the largest sample size. It was not possible to summarize the findings for occupation in figures, given the marked heterogeneity in definition of occupation.
For each SES indicator, the full results from each study, including stratification by urban/rural status were summarized in supplementary materials, grouped according to whether studies presented: only prevalence; only odds ratios; and both prevalence and odds ratios, and ranked from high to low quality. These figures and tables were accompanied by a narrative synthesis of the study findings, since heterogeneity between studies precluded meta–analyses.
RESULTS
Selection of studies
The literature search initially identified 3003 studies, with 1935 remaining after de–duplication. Of these, 1771 studies were excluded after title and abstract screening, and 131 further studies were excluded after full text review. Thirty–three studies met the inclusion criteria and were included in the systematic review (Figure 1).
Figure 1.
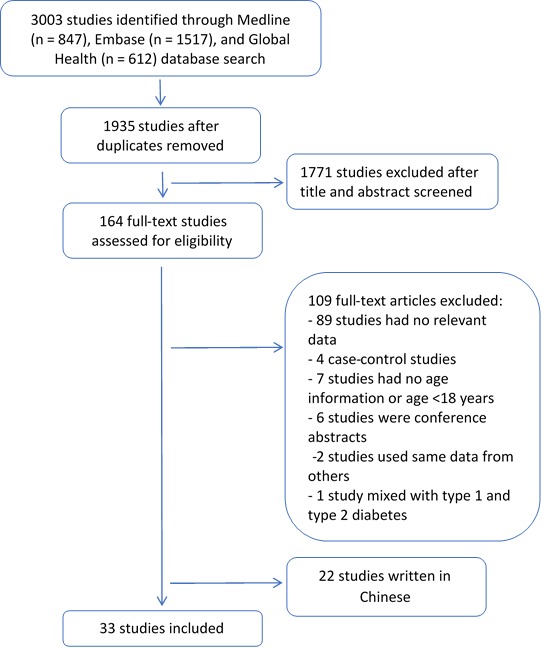
Flowchart of selection of studies in systematic review.
Study characteristics
An overview of the characteristics of the included studies is presented in Table 1. Twenty–four studies were conducted in mainland China (three in urban areas, five in rural areas and 16 in both urban and rural areas), three in Hong Kong and six in Taiwan. Study year ranged from 1986 to 2012, with a marked increase in studies on this topic over time, with 24 studies published since 2009. Sample size ranged from 988 [63] to 512 891 [41]. All studies included both men and women, but only five reported the association between SES and type 2 diabetes by sex. Self–reported diabetes and fasting blood glucose were the most commonly used methods to diagnose diabetes. Some studies used an oral glucose tolerance test (OGTT), random blood glucose and postprandial blood glucose for diagnosis of diabetes. Twelve studies provided prevalence of diabetes in different SES groups, 15 studies provided odds ratio of diabetes for different SES groups, and six provided both prevalence and odds ratios.
Table 1.
Characteristics of studies identified in systematic review with evaluation of association between prevalence of type 2 diabetes and SES in mainland China, Hong Kong and Taiwan
| Study | Study year | Participants selection | Sample, N (diabetes) | Gender (% men) | Age (mean ± SD, years) | Study location* | SES indicator | Diabetes diagnosis method | Outcome measure (prevalence/odds ratio) | Quality score |
|---|---|---|---|---|---|---|---|---|---|---|
| Wu et al. 2016 [34] |
2007–2011 |
Using a random multistage stratified sampling method, 2–3 cities within each of 6 provinces from south and north China were selected, from which several communities and villages were randomly selected |
23 010 (983†) |
46.9 |
≥18 (43.0, 30.4–56.3)‡ |
Urban and rural |
Education |
Self–report or FBG |
Prevalence |
7 |
| Liu et al. 2016 [35] |
2001, 2010 |
Using a two–stage cluster random sampling method, 9 residential communities were randomly selected in Wanshoulu district in Beijing, from which all households were chosen and one person aged ≥60 was randomly selected in each household |
2001: 2277 (487§), 2010: 2102 (521§) |
2001: 41.4; 2010: 40.3 |
≥60 (67.9 ± 5.8 in 2001; 71.2 ± 6.6 in 2010) |
Urban |
Education |
Self–report or FBG |
Prevalence |
5 |
| Zhou et al. 2015 [36] |
2010 |
Using a multistage probability sampling design, 3 communities or villages were selected in each of 4 subdistricts with probability proportional to size from each National Disease Surveillance Point; within each community 50 households were randomly selected, and one person randomly selected in each household |
98 058 (12 237§) |
45.7 |
≥18 (NR) |
Urban and rural |
Education, occupation |
Self–report or FBG or OGTT or HbA1c |
Odds ratio |
6 |
| Yu et al. 2015 [37] |
2012 |
Using a multistage stratified random cluster sampling method, 32 counties were selected from 9 cities, from which 3 or 4 towns were randomly selected; within each town, 3 neighborhood committers were randomly selected, from each of which one village was randomly selected, before randomly selecting people aged 18 to 79 years |
16 834 (1380‖) |
45.9 |
18–79 (42.7 ± 14.5) |
Urban and rural |
Education, income, occupation |
Self–report or FBG |
Prevalence |
7 |
| Xue et al. 2015 [38] |
2006, 2009 |
Using a stratified random cluster sampling method, people who lived in Qingdao city for at least 5 years in 3 urban areas and 3 rural areas were selected |
6894 (360‡) |
39.4 |
35–74 (51.2 ± 10.6) |
Urban and rural |
Education, income |
HbA1c |
Odds ratio |
7 |
| Xu et al. 2015 [39] |
2010–2011 |
Using a multistage stratified random sampling method, 3 central temples and 3 counties in Chengdu region were selected from each altitude level; 4 townships were selected from each county, and within each townships 3 villages were selected, from which all people aged ≥18 were selected |
1659 (106‖) |
49.5 |
≥18 (44.0 ± 15.2) |
Urban and rural |
Education, income |
Self–report or FBG or OGTT |
Prevalence |
7 |
| Bu et al. 2015 [40] |
2007–2008 |
Using a multistage stratified random sampling method, cities within 14 provinces in China were selected, from which 152 city districts and 112 rural villages were randomly selected; people aged ≥20 years who had lived at their current residence for ≥5 years were selected |
39 071 (3254‖) |
39.2 |
≥30 (NR) |
Urban and rural |
Education |
Self–report or FBG or OGTT |
Odds ratio |
6 |
| Bragg et al. 2014 [41] |
2004–2008 |
People aged 30–79 were selected from five urban and five rural areas in China; these were permanent residents identified through official residential and invited by letter after extensive publicity campaigns |
512 891 (30 773‖) |
41.0 |
30–79 (NR) |
Urban and rural |
Education, income |
Self–report or FBG or random blood glucose |
Prevalence |
5 |
| Zhang et al. 2013 [28] |
2005 |
Using a multistage stratified cluster random sampling method, 3 communities were randomly selected from two urban and one suburban district(s) in Tianjin; 3 neighborhoods were randomly selected from each community and all people who had lived in the selected neighborhoods for >5 years and were aged ≥15 years were selected |
7315 (688§) |
NR |
20–79 (NR) |
Urban |
Education, income, occupation |
Self–report or FBG or OGTT |
Odds ratio |
6 |
| Xia et al. 2013 [42] |
2010–2011 |
Using a stratified random sampling method, 3 communities within each of 4 districts of Haikou were randomly selected, from which 1000 people were selected |
12 000 (636§) |
51.0 |
>18 (49.1 ± 0.26¶) |
Urban |
Education, occupation |
FBG |
Prevalence |
5 |
| Wu et al. 2013 [43] |
2010 |
Using a probability sampling design and a multistage cluster sampling method, 1 county from rural National Disease Surveillance Points (DSPs) and one district from urban DSPs were selected from 8 provinces, resulting in 64 principle sample units |
13 157 (868‡) |
48.1 |
≥50 (62.6 ± 0.3) |
Urban and rural |
Income |
Self–report |
Both |
6 |
| Wang et al. 2013 [44] |
2011 |
Using a multistage stratified random sampling method, all townships within two counties in Yunnan province were selected and within each township 2 villages were randomly selected |
4801 (341‖) |
44.8 |
25–86 (51.1) |
Rural |
Education, income |
Self–report or FBG or OGTT |
Odds ratio |
7 |
| Cai et al. 2013 [45] |
2011 |
Using a multistage stratified random sampling method, 1 county with high wealth and 1 county with low wealth were randomly selected in Yunnan province; people aged ≥18 were randomly selected from 20 villages within each county |
9396 (614§) |
46.0 |
≥18 (51.7 ± 19.6) |
Rural |
Education |
Self–report or FBG |
Prevalence |
6 |
| Yan et al. 2012 [46] |
2009 |
Using a multistage random cluster sampling method, people aged ≥7 were randomly selected from 228 communities in 9 provinces |
8458 (NR) |
47.1 |
≥18 (NR) |
Urban and rural |
Income |
FBG or HbA1c |
Odds ratio |
6 |
| Chen and Chen. 2012 [47] |
NR |
Using a multistage random cluster sampling method, 2–12 townships were randomly selected from each 23 counties in Taiwan, within which 12–123 neighborhoods were randomly selected; within each neighborhood, 4 households were randomly selected |
13 741 (NR) |
57.0 |
18–64 (NR) |
Taiwan |
Occupation |
Self–report |
Both |
6 |
| Shi et al. 2011 [48] |
2002 |
Using a multistage random sampling method, households were randomly selected from 6 counties and 2 cities; all people in the households were selected |
2849 (79‖) |
45.9 |
≥20 (47.0) |
Urban and rural |
Education |
FBG |
Prevalence |
6 |
| Lin et al. 2011 [49] |
2004 |
Using a multistage random sampling method with a sampling rate proportional to size within each stage, 39 Li units were randomly selected from each 8 city districts; people were randomly selected from each sample Li |
2332 (284§) |
48.6 |
≥40 (56.9) |
Taiwan |
Education, income |
Self–report or FBG |
Prevalence |
6 |
| Kavikondala et al. 2011 [50] |
2005–2008 |
People were randomly selected from ‘The Guangzhou Health and Happiness Association’ who are permanent residents in Guangzhou |
19 818 (2193‡) |
26.7 |
50–96 (60.4) |
Urban |
Education, occupation |
Self–report or FBG |
Odds ratio |
6 |
| Fu et al. 2011 [30] |
2006–2007 |
All adult residents aged 18–64 were selected with exclusion of those who were temporary workers or university students not living in the county from four rural communities in Deqing, Zhejiang province |
4506 (99‡) |
41.4 |
18–64 (46.1 ± 10.0) |
Rural |
Education, income, occupation |
Self–report or FBG |
Both |
7 |
| Cai et al. 2011 [29] |
2008–2010 |
Using a multistage stratified random sampling method, 3 counties with low, high and high level of wealth were randomly selected from Yunnan province; all townships in counties were selected and 3 villages in each township were selected by probability proportional to size, from which people aged ≥18 years were randomly selected |
10 007 (657§) |
46.2 |
≥18 (NR) |
Rural |
Education, income |
Self–report or FBG |
Odds ratio |
6 |
| Wei et al. 2010 [51] |
2005 |
Using a multistage random cluster sampling, communities were randomly selected from 5 areas in a region in Heilongjiang |
1058 (75§) |
50.1 |
>20 (NR) |
Rural |
Education, income |
Self–report or FBG or OGTT |
Both |
7 |
| Zhou et al. 2009 [52] |
2007–2008 |
People aged ≥20 years in 10 communities in Beijing were selected where their committees would like to cooperate with the research team |
2801 (580§) |
27.2 |
35–79 (54.7) |
Urban and rural |
Education, income, occupation |
Self–report or FBG or OGTT |
Both |
7 |
| Ning et al. 2009[53] |
2001–2002, 2006 |
Using a stratified random cluster sampling method, people aged 35–74 years living in Qingdao city for at least 5 years were randomly selected from 3 urban districts and 4 rural counties |
11 624 (1383‡) |
39.6 |
35–74 (54.4 in 2001–2002; 51.5 in 2006) |
Urban and rural |
Education, income, occupation |
Self–report or FBG or OGTT |
Odds ratio |
7 |
| Hu et al. 2009 [54] |
2000–2001 |
Using a multistage stratified random sampling method, 1 rural and 1 urban county within each of four provinces from North and 4 provinces from South China were randomly selected; 1 township/street was randomly selected from each county, from which people aged 35–74 years were randomly selected |
15 236 (986§) |
48.4 |
35–74 (50.1 ± 0.12¶) |
Urban and rural |
Education, income, occupation |
Self–report or FBG |
Prevalence |
7 |
| Xu et al. 2006 [31] |
2000–2001 |
Using a multistage random sampling method, 3 urban districts and 2 rural counties were randomly selected in Nanjing, from each of which 3 streets/towns were selected; 3 villages were randomly selected in each street/town, from which people aged ≥35 y who had been a local resident for at least 5 years in each village were selected |
29 340 (556§) |
49.8 |
≥35 (NR) |
Urban and rural |
Education, income, occupation |
Self–report |
Both |
6 |
| Chou and Chi. 2005 [55] |
1996 |
People aged ≥60 years in 6000 households were randomly selected from a continuous sample survey, which use a full list of addresses of quarters in Hong Kong as the sampling frame |
2003 (246§) |
47.0 |
≥60 (NR) |
Hong Kong |
Education |
Self–report |
Prevalence |
4 |
| Yu and Wong. 2004 [56] |
NR |
Households in Tai Po Hong Kong were randomly selected by telephone survey using a residential telephone directory |
2670 (NR) |
NR |
≥20 (NR) |
Hong Kong |
Income |
Self–report |
Odds ratio |
5 |
| Woo et al. 2003 [57] |
1995–1996 |
People aged 25–74 from 3 major of Hong Kong were randomly selected by telephone survey |
988 (59§) |
49.4 |
25–74 (45.6 ± 11.7) |
Hong Kong |
Education |
FBG or OGTT |
Prevalence |
5 |
| Chen et al. 2001 [58] |
1996–1997 |
Using a multistage proportional stratified random cluster sampling method, people aged 50–79 years were randomly selected from 3 townships |
1293 (182‡) |
41.8 |
50–79 (63.8) |
Taiwan |
Education |
Self–report or FBG |
Odds ratio |
7 |
| Chen et al. 1999 [59] |
1995–1996 |
Using a proportional stratified random sampling method, people aged 40–79 years were randomly selected from 6 areas |
1601 (295§) |
48.7 |
40–79 (57.4) |
Taiwan |
Occupation |
Self–report or FBG |
Odds ratio |
7 |
| Pan et al. 1997 [60] |
1994 |
People aged ≥25 years were selected from cities and rural areas in 19 provinces |
213 515 (4864§) |
52.9 |
25–64 (NR) |
Urban and rural |
Income |
Self–report or FBG or OGTT |
Odds ratio |
6 |
| Chou et al. 1994 [61] |
1991 |
All people aged >30 years in each village from Kin–Hu Town were selected |
3236 (193§) |
47.5 |
>30 (NR) |
Taiwan |
Education |
FBG or OGTT |
Odds ratio |
5 |
| Tai et al. 1992 [62] | 1986 | 8 subdistricts of Ta–An District in Taipei City and 5 villages of 11 counties of Taiwan Province were randomly selected | 11 478 (715§) | 50.3 | ≥40 (NR) | Taiwan | Education, income | Self–report or FBG or postprandial blood glucose or OGTT | Odds ratio | 6 |
SD – standard deviation, Self–report – self–reported history of type 2 diabetes or using medication for type 2 diabetes, FBG – fasting blood glucose, OGTT – oral glucose tolerance test, NR – not reported
*Urban and/or rural are in mainland China.
†Median and interquartile range.
‡Number is estimated based on the crude prevalence of diabetes.
§Number reported in the study.
‖Number is estimated based on the adjusted prevalence of diabetes.
¶Standard error.
Quality of included studies
The quality scores of included studies ranged from 4 to 7 with a mean score of 6.0 based on the modified NOS assessment. Two studies had a highly selected study population. One selected the sample from an association for elders to represent the total older population of the study area [50], and a second study included participants who were willing to cooperate with the research team, without using any sampling techniques [52]. Fourteen studies did not report sex or age distribution, which is a limitation since both sex and age are important risk factors for type 2 diabetes [4]. Eight studies only reported crude prevalence of diabetes or unadjusted odds ratio for the association between SES and diabetes [35,42,45,48,49,55,57,61] and five studies defined diabetes solely based on self–reported diagnosis [31,43,47,55,56]. In addition, four studies did not provide confidence intervals or p values for statistical tests [35,41,42,57].
Measures of SES
A single measure of SES was reported in 15 studies, with the remaining studies reporting data for two (10 studies) or three (8 studies) SES indicators. Education was the most commonly used indicator, being reported in 27 studies, and was classified either as highest educational level (in 21 studies) or the number of school years completed. Income was reported in 19 studies, including 15 family income measures and four personal income measures. Occupation was reported in 12 studies, but the measures of occupation differed greatly between studies, with the definition based on: job titles; skills (manual or non–manual); or a simple classification of employed and unemployed.
Association between SES and type 2 diabetes
Among the 27 studies reporting on education and type 2 diabetes, 16 reported prevalence estimates, among which five reported standardized prevalence. Fifteen studies reported odds ratios, 14 of which presented odds ratios that controlled for various potential confounders. Generally, prevalence of type 2 diabetes was higher in those with a lower compare to higher education level (Figure 2 and Appendices S4 and S6 in Online Supplementary Document(Online Supplementary Document)). Most, but not all, studies reported either a significant inverse association between education level and type 2 diabetes or a possible trend toward such an association, with odds ratios (95% CI) ranged from 0.39 (CI not reported) to 1.52 (0.91, 2.54) for the highest compared to the lowest education level (Figure 3 and Appendices S5 and S6 in Online Supplementary Document(Online Supplementary Document)). The studies from Hong Kong reported an inverse association [57] and no significant association [55] between education and type 2 diabetes. Among four studies from Taiwan reporting an association between education and type 2 diabetes, two reported an inverse association [49,61], and the other two reported no evidence of an association [58,62]. Among all studies, four studies reported sex–specific analyses, with two reporting that higher education was associated with increased prevalence of type 2 diabetes among men, with the opposite observed in women [34,52]. The other two studies [39,53] did not find any gender differences in the association between education and type 2 diabetes.
Figure 2.

Prevalence of type 2 diabetes in the lowest and highest levels of education and income in included studies.
Figure 3.

Study specific odds ratios for type 2 diabetes comparing the highest vs lowest levels of education and income in included studies.
Of the 19 studies reporting on income and type 2 diabetes, 10 reported prevalence estimates, among which four reported a standardized prevalence. Fourteen studies reported odds ratios, all but one of which only presented odds ratios adjusted for various confounders. There was no clear pattern of prevalence of type 2 diabetes by income level across studies, with considerable inconsistency between studies (Figure 2, Appendices S7 and S9 in Online Supplementary Document(Online Supplementary Document)). Similarly, among studies reporting odds ratios, the evidence for an association between income level and type 2 diabetes was inconsistent (Figure 3, Appendices S8 and S9 in Online Supplementary Document(Online Supplementary Document)). The study from Hong Kong reported an inverse association between income and type 2 diabetes [56]. The studies from Taiwan reported an inverse association [49] and no significant association [62] between income and type 2 diabetes. Among all studies, four studies reported sex–specific analyses, among which Ning et al. [53] found a significant positive association between income and type 2 diabetes only in men in rural areas. Zhou et al. [52] and Yan et al. [46] also found a positive association in men but not in women. A fourth study did not find a gender difference, but included a very small sample size [39].
Of the 12 studies reporting on occupation and type 2 diabetes, eight reported prevalence estimates, with two reporting estimates standardized for various factors. Nine studies reported odds ratios, all of which controlled for various potential confounders. As the measures of occupation were heterogeneous, it is not easy to rank the occupation classification from high to low SES. This affects the comparability of the findings from studies reporting on occupation and type 2 diabetes and we were unable to present the results using a figure as for education and income. Zhou et al. [36] and Zhang et al. [28] found an increased risk of type 2 diabetes in retired compared to employed people after adjusting for age. Xu et al. [31] found the prevalence of type 2 diabetes was much higher in people with white collar occupations than blue collar occupations, even after controlling for confounding factors. Chen and Chen [47] found professionals had the lowest risk of type 2 diabetes compared to other kinds of occupation such as officials, salespersons and assemblers. However, most studies did not report a statistically significant association between occupation and prevalence of type 2 diabetes (Appendices S10, S11 and S12 in Online Supplementary Document(Online Supplementary Document)).
DISCUSSION
This systematic review of the association between SES and prevalence of type 2 diabetes in Chinese populations in mainland China, Hong Kong and Taiwan suggests that higher education is probably associated with a decreased prevalence of type 2 diabetes. The association between income and type 2 diabetes was inconsistent between studies. While most studies found no association between occupation and diabetes prevalence, a few did report higher prevalence among people who were retired or in white–collar jobs compared to other occupations. These findings were not obviously influenced by study year or quality score.
Explanation for findings in this systematic review
In this systematic review, most studies suggested that higher levels of education are associated with decreased prevalence of diabetes, but some found the opposite association. For example, Xu et al. [39] reported a positive association between education and prevalence of type 2 diabetes in a relatively small Tibetan population. Tibet is an undeveloped region at an earlier economic development stage compared with other parts of China, which may partly contribute to this different result. Despite being conducted in the same area and using the same methods Liu et al. [35] found a much higher prevalence of type 2 diabetes in higher education groups in people aged 60 years or older in a 2010 survey, having found no association in the 2001 survey. This study dichotomised education using a cut–off of 7 years. However, from the 1960s a large proportion of Chinese started to receive middle school education (9 years of education) [64] and so choosing 7 years as the cut–point may have different effects in different birth cohorts. Xu et al. [31] found a significantly higher crude prevalence of type 2 diabetes in people with a higher education level, but the logistic regression model revealed a non–significant inverse association after adjusting for several variables. This means that the crude positive association between prevalence of type 2 diabetes and education may have been distorted by confounding factors. Furthermore, differences in definitions of education might explain some of the heterogeneity observed between studies. It is important to note that all three studies reporting a positive association between education and prevalence of type 2 diabetes measured education as school years completed [31,35,39]. However, people may receive different economic return from school years completed compared to educational level achieved [65].
The direction of association between income and prevalence of type 2 diabetes differed between studies in our review. This is inconsistent with previous studies which has found people from high–income countries with low income were more likely to have type 2 diabetes [66,67], but an opposite association in people from low– and middle–income countries [22,68]. There are several potential explanations for the inconsistent association between income and diabetes in our review. First, unlike education, which is usually completed in young adulthood, income is unstable and sensitive to change in life circumstances and so it is not necessarily a good indicator of whole life SES [69]. Second, self–reported income is more likely to be under– or over–estimated in studies as people may consider income sensitive information and be reluctant to report it, which obviously decreases the reliability and increases the risk of non–differential bias toward a null association [70]. In addition, income is only one part of an individual’s assets and is not a very good measure among older people, especially retired people, where income is low but actual wealth can be high. Furthermore, the classification of income level is very different between studies with the lowest category ranging from <2500¥ (US$ 360) to <10 000¥ (US$ 1440) for a family’s whole year income [41,52]. Four studies in this systematic review used personal income as individual’s measure of SES [28,53,54,60]. However, total family income is believed to be more reliable than personal income, especially for young adults and women, who may not be the main earners in the family [69]. However, when applying total family income to all family members, family size should be accounted for, since for the same income, a larger family may have higher outgoing costs than a smaller family [71]. Among 15 studies reporting total family income, only one study considered family size [31]. Furthermore, China has undergone a very rapid economic development during the past several decades [72]. However, changes in an individual’s lifestyle and health–related behaviors may lag behind changes in economic conditions and may also differ in different settings.
We did not find a consistent association between occupation and prevalence of type 2 diabetes in this systematic review, though a few studies reported statistically significant findings. The classification of occupation across studies was complex and heterogeneous. Occupation in China is associated with education and income but also differing levels of physical activity that makes its classification as a risk factor for diabetes challenging.
The methods used to diagnose type 2 diabetes varied across studies, which was another source of heterogeneity between studies. Different diagnostic criteria may have a different effect on the magnitude of the association between SES and diabetes. According to the latest China nationally representative diabetes survey, around 70% of Chinese adults with diabetes were undiagnosed [3]. Thus, among the five studies that defined diabetes based on self–report, a large proportion of those with diabetes in these studies may have been erroneously assigned to the non–diabetic group and this misclassification may differ by SES groups. Bragg et al. [41] found that undiagnosed diabetes was more common among people in low education and low income groups, while the opposite was found for self–reported diabetes. People with high SES typically have more access to health resources such as routine health checks, thus they may be more likely to be aware of their health conditions. However, another study [28] did not find this difference. To more clearly examine this association, more studies reporting on the association between SES and both diagnosed and undiagnosed diabetes are required.
Limitations of the study
Our review was limited to papers published in the English language. A systematic review of studies published in Chinese is also needed to exclude potential bias. Another important limitation is that the association between SES and diabetes was rarely the main research aim or hypothesis of most identified studies. SES was generally considered as a descriptive variable of the study sample or a potential confounder of relationships between other variables and health outcomes. It is also important to note that most prevalence estimates presented in studies were unadjusted for age, which is a key confounder of the association between SES and diabetes. Additionally, all but three studies reporting odds ratios were adjusted for various factors in addition to age and sex, many of which may lie on the causal pathway between SES and type 2 diabetes. Inclusion of these factors may have led to over–adjustment of the association between SES indicators and type 2 diabetes. A few studies in this systematic review found that the strength and direction of association between SES and prevalence of type 2 diabetes differed by sex but it is not clear whether this is consistent in different populations. A sex–specific SES gradient in health outcomes has been reported by previous studies [73]. For example, the SES gradient in prevalence of type 2 diabetes appears to be stronger in women than men in Scotland [74]. Furthermore, the scope of this review did not include the association between other indicators of individual SES (such as wealth, house condition, car and home ownership) or area–based SES measures [75].
SES indicators may have different values and implications in different urban and rural settings and in developed and undeveloped areas [76–79]. For example, people in rural areas may not need a very high education level to engage in agricultural or farming work. Also, the same level of income may have different implications for people living in developed and undeveloped areas. For example, an average monthly income of US$ 1500 provides vastly different standards of living for a family in west China compared to those living in Hong Kong. In this review, efforts were made to examine whether the association between SES and type 2 diabetes vary by study location in urban, rural mainland China, Hong Kong and Taiwan. However, the inconsistent findings and limited number of studies within each of these study geographical locations meant that no obvious patterns were observed.
Implications for health policy and future research
Health polices for reducing socioeconomic health disparities in diabetes can only be made when the association between SES and diabetes is fully understood. This review found some evidence of an inverse relationship between education and prevalence of type 2 diabetes in Chinese populations. However, associations between income, occupation and diabetes were inconsistent. More studies, including review of those in Chinese language publications, are needed to explore the association between income and occupation and diabetes and to identify whether associations differ in different sub–groups of the population and in different regions of China. Additionally, repeated cross–sectional studies are needed to explore how associations between SES and diabetes change over time in China.
Although the association between SES and diabetes varies between countries, China is the country with the largest number of people with diabetes in the world and is undergoing rapid economic development. The epidemiological transition in China and the challenges of identifying and addressing socio–economic inequalities in health therefore have important implications for global health.
CONCLUSIONS
This first systematic review of the association between individual SES and prevalence of type 2 diabetes in China found that low education is probably associated with an increased prevalence of type 2 diabetes. However, further work is needed to determine whether similar associations are observed with income and occupation.
Acknowledgments
Disclaimer: We confirm that the views expressed in this submitted article are our own and not an official position of the institution or funder.
Footnotes
Funding: HW and XM are funded by scholarships from the China Scholarship Council.
Authorship declaration: HW and XM independently conducted the literature search and data extraction. HW wrote the first draft of the paper. All authors contributed to the interpretation of the findings and the paper’s critical writing. All authors approved the final draft of the manuscript.
Competing interests: Sarah H Wild reports honoraria for lectures on epidemiology of diabetes from Global MedEd/Astra Zeneca and on the Scottish Diabetes Register from Novo Nordisk. All authors have completed the ICMJE uniform disclosure form at http://www.icmje.org/coi_disclosure.pdf (available upon request from the corresponding author) and declare no other conflicts of interest.
Additional Material
REFERENCES
- 1.NCD Risk Factor Collaboration Worldwide trends in diabetes since 1980: a pooled analysis of 751 population-based studies with 4.4 million participants. Lancet. 2016;387:1513–30. doi: 10.1016/S0140-6736(16)00618-8. [DOI] [PMC free article] [PubMed] [Google Scholar]
- 2.National Diabetes Co-operative Study Group A mass survey of diabetes mellitus in a population of 300 000 in 14 provinces and municipalities in China. Zhonghua Nei Ke Za Zhi. 1981;20:678–83. [article in Chinese] [PubMed] [Google Scholar]
- 3.Xu Y, Wang L, He J, Bi Y, Li M, Wang T, et al. Prevalence and control of diabetes in Chinese adults. JAMA. 2013;310:948–59. doi: 10.1001/jama.2013.168118. [DOI] [PubMed] [Google Scholar]
- 4.International Diabetes Federation. IDF diabetes atlas seventh edition. 2015. Available: http://www.diabetesatlas.org/resources/2015-atlas.html. Accessed: 11 May 2017.
- 5.Lynch J, Kaplan G. Socioeconomic position. 2000: Social epidemiology. New York: Oxford University Press. [Google Scholar]
- 6.Cutler DM, Lleras-Muney A, Vogl T. Socioeconomic status and health: dimensions and mechanisms. Cambridge, MA: National Bureau of Economic Research; 2008. [Google Scholar]
- 7.Grotto I, Huerta M, Sharabi Y. Hypertension and socioeconomic status. Curr Opin Cardiol. 2008;23:335–9. doi: 10.1097/HCO.0b013e3283021c70. [DOI] [PubMed] [Google Scholar]
- 8.McLaren L. Socioeconomic status and obesity. Epidemiol Rev. 2007;29:29–48. doi: 10.1093/epirev/mxm001. [DOI] [PubMed] [Google Scholar]
- 9.Clark AM, DesMeules M, Luo W, Duncan AS, Wielgosz A. Socioeconomic status and cardiovascular disease: risks and implications for care. Nat Rev Cardiol. 2009;6:712–22. doi: 10.1038/nrcardio.2009.163. [DOI] [PubMed] [Google Scholar]
- 10.Agardh EE, Ahlbom A, Andersson T, Efendic S, Grill V, Hallqvist J, et al. Explanations of socioeconomic differences in excess risk of type 2 diabetes in Swedish men and women. Diabetes Care. 2004;27:716–21. doi: 10.2337/diacare.27.3.716. [DOI] [PubMed] [Google Scholar]
- 11.Cella DF, Orav EJ, Kornblith AB, Holland JC, Silberfarb PM, Lee KW, et al. Socioeconomic status and cancer survival. J Clin Oncol. 1991;9:1500–9. doi: 10.1200/JCO.1991.9.8.1500. [DOI] [PubMed] [Google Scholar]
- 12.Marmot M. Social determinants of health inequalities. Lancet. 2005;365:1099–104. doi: 10.1016/S0140-6736(05)74234-3. [DOI] [PubMed] [Google Scholar]
- 13.Hossain P, Kawar B, El Nahas M. Obesity and diabetes in the developing world—a growing challenge. N Engl J Med. 2007;356:213–5. doi: 10.1056/NEJMp068177. [DOI] [PubMed] [Google Scholar]
- 14.Jeon CY, Lokken RP, Hu FB, van Dam RM. Physical activity of moderate intensity and risk of type 2 diabetes a systematic review. Diabetes Care. 2007;30:744–52. doi: 10.2337/dc06-1842. [DOI] [PubMed] [Google Scholar]
- 15.Agardh E, Allebeck P, Hallqvist J, Moradi T, Sidorchuk A. Type 2 diabetes incidence and socio-economic position: a systematic review and meta-analysis. Int J Epidemiol. 2011;40:804–18. doi: 10.1093/ije/dyr029. [DOI] [PubMed] [Google Scholar]
- 16.Connolly V, Unwin N, Sherriff P, Bilous R, Kelly W. Diabetes prevalence and socioeconomic status: a population based study showing increased prevalence of type 2 diabetes mellitus in deprived areas. J Epidemiol Community Health. 2000;54:173–7. doi: 10.1136/jech.54.3.173. [DOI] [PMC free article] [PubMed] [Google Scholar]
- 17.Espelt A, Borrell C, Roskam AJ, Rodríguez-Sanz M, Stirbu I, Dalmau-Bueno A, et al. Socioeconomic inequalities in diabetes mellitus across Europe at the beginning of the 21st century. Diabetologia. 2008;51:1971–9. doi: 10.1007/s00125-008-1146-1. [DOI] [PubMed] [Google Scholar]
- 18.Evans JM, Newton RW, Ruta DA, MacDonald TM, Morris AD. Socio-economic status, obesity and prevalence of Type 1 and Type 2 diabetes mellitus. Diabet Med. 2000;17:478–80. doi: 10.1046/j.1464-5491.2000.00309.x. [DOI] [PubMed] [Google Scholar]
- 19.Meadows P. Variation of diabetes mellitus prevalence in general practice and its relation to deprivation. Diabet Med. 2000;17:478–80. doi: 10.1111/j.1464-5491.1995.tb00572.x. [DOI] [PubMed] [Google Scholar]
- 20.Robbins JM, Vaccarino V, Zhang H, Kasl SV. Socioeconomic status and type 2 diabetes in African American and non-Hispanic white women and men: evidence from the Third National Health and Nutrition Examination Survey. Am J Public Health. 2001;91:76–83. doi: 10.2105/AJPH.91.1.76. [DOI] [PMC free article] [PubMed] [Google Scholar]
- 21.Tang M, Chen Y, Krewski D. Gender-related differences in the association between socioeconomic status and self-reported diabetes. Int J Epidemiol. 2003;32:381–5. doi: 10.1093/ije/dyg075. [DOI] [PubMed] [Google Scholar]
- 22.abu Sayeed M, Ali L, Hussain MZ, Rumi MA, Banu A, Azad Khan AK. Effect of socioeconomic risk factors on the difference in prevalence of diabetes between rural and urban populations in Bangladesh. Diabetes Care. 1997;20:551–5. doi: 10.2337/diacare.20.4.551. [DOI] [PubMed] [Google Scholar]
- 23.Ali O, Tan TT, Sakinah O, Khalid BA, Wu LL, Ng ML. Prevalence of NIDDM and impaired glucose tolerance in aborigines and Malays in Malaysia and their relationship to sociodemographic, health, and nutritional factors. Diabetes Care. 1993;16:68–75. doi: 10.2337/diacare.16.1.68. [DOI] [PubMed] [Google Scholar]
- 24.Illangasekera U, Rambodagalla S, Tennakoon S. Temporal trends in the prevalence of diabetes mellitus in a rural community in Sri Lanka. J R Soc Promot Health. 2004;124:92–4. doi: 10.1177/146642400412400214. [DOI] [PubMed] [Google Scholar]
- 25.Ramachandran A, Snehalatha C, Kapur A, Vijay V, Mohan V, Das AK, et al. High prevalence of diabetes and impaired glucose tolerance in India: National Urban Diabetes Survey. Diabetologia. 2001;44:1094–101. doi: 10.1007/s001250100627. [DOI] [PubMed] [Google Scholar]
- 26.World Health Organization. Noncommunicable disease risk factors and socioeconomic inequalities - what are the links? A multicountry analysis of noncommunicable disease surveillance data. 2010. Available: http://www.wpro.who.int/publications/PUB_9789290614746/en/. Accessed: 1 February 2017.
- 27.Xie Y, Zhou X. Income inequality in today’s China. Proc Natl Acad Sci U S A. 2014;111:6928–33. doi: 10.1073/pnas.1403158111. [DOI] [PMC free article] [PubMed] [Google Scholar]
- 28.Zhang H, Xu W, Dahl AK, Xu Z, Wang HX, Qi X. Relation of socio-economic status to impaired fasting glucose and Type 2 diabetes: findings based on a large population-based cross-sectional study in Tianjin, China. Diabet Med. 2013;30:e157–62. doi: 10.1111/dme.12156. [DOI] [PubMed] [Google Scholar]
- 29.Le C, Jun D, Zhankun S, Yichun L, Jie T. Socioeconomic differences in diabetes prevalence, awareness, and treatment in rural southwest China. Trop Med Int Health. 2011;16:1070–6. doi: 10.1111/j.1365-3156.2011.02805.x. [DOI] [PubMed] [Google Scholar]
- 30.Fu C, Chen Y, Wang F, Wang X, Song J, Jiang Q. High prevalence of hyperglycaemia and the impact of high household income in transforming rural China. BMC Public Health. 2011;11:862. doi: 10.1186/1471-2458-11-862. [DOI] [PMC free article] [PubMed] [Google Scholar]
- 31.Xu F, Yin XM, Zhang M, Leslie E, Ware R, Owen N. Family average income and diagnosed type 2 diabetes in urban and rural residents in regional mainland China. Diabet Med. 2006;23:1239–46. doi: 10.1111/j.1464-5491.2006.01965.x. [DOI] [PubMed] [Google Scholar]
- 32.Leung GM, Lu J-FR, Meng Q. Mainland China, Hong Kong, and Taiwan, Health Systems of. In International Encyclopedia of Public Health. 2nd edition. Oxford: Academic Press; 2017. [Google Scholar]
- 33.Wells G, Shea B, O’Connell D, Peterson J, Welch V, Tugwell P. The Newcastle-Ottawa Scale (NOS) for assessing the quality of nonrandomised studies in meta-analyses. 2000. Available: http://www.ohri.ca/programs/clinical_epidemiology/oxford.asp. Accessed: 23 June 2016.
- 34.Wu J, Cheng X, Qiu L, Xu T, Zhu G, Han J, et al. Prevalence and clustering of major cardiovascular risk factors in China: a recent cross-sectional survey. Medicine. 2016;95:e2712. doi: 10.1097/MD.0000000000002712. [DOI] [PMC free article] [PubMed] [Google Scholar]
- 35.Liu M, Wang J, He Y, Jiang B, Wu L, Wang Y, et al. Awareness, treatment and control of type 2 diabetes among Chinese elderly and its changing trend for past decade. BMC Public Health. 2016;16:278. doi: 10.1186/s12889-016-2874-7. [DOI] [PMC free article] [PubMed] [Google Scholar]
- 36.Zhou M, Astell-Burt T, Bi Y, Feng X, Jiang Y, Li Y, et al. Geographical variation in diabetes prevalence and detection in china: multilevel spatial analysis of 98,058 adults. Diabetes Care. 2015;38:72–81. doi: 10.2337/dc14-1100. [DOI] [PMC free article] [PubMed] [Google Scholar]
- 37.Yu J, Ma Y, Yang S, Pang K, Yu Y, Tao Y, et al. Risk factors for cardiovascular disease and their clustering among adults in Jilin (China). Int J Environ Res Public Health. 2015;13:ijerph13010070. [DOI] [PMC free article] [PubMed] [Google Scholar]
- 38.Xue B, Tan JB, Ning F, Sun JP, Zhang KY, Liu L, et al. Association between serum uric acid and prevalence of type 2 diabetes diagnosed using HbA1c criteria among Chinese Adults in Qingdao, China. Biomed Environ Sci. 2015;28:884–93. doi: 10.3967/bes2015.122. [DOI] [PubMed] [Google Scholar]
- 39.Xu S, Jiayong Z, Li B, Zhu H, Chang H, Shi W, et al. Prevalence and clustering of cardiovascular disease risk factors among Tibetan adults in China: a population-based study. PLoS One. 2015;10:e0129966. doi: 10.1371/journal.pone.0129966. [DOI] [PMC free article] [PubMed] [Google Scholar]
- 40.Bu S, Ruan D, Yang Z, Xing X, Zhao W, Wang N, et al. Sex-specific prevalence of diabetes and cardiovascular risk factors in the middle-aged population of China: a subgroup analysis of the 2007-2008 China National Diabetes and Metabolic Disorders Study. PLoS One. 2015;10:e0139039. doi: 10.1371/journal.pone.0139039. [DOI] [PMC free article] [PubMed] [Google Scholar]
- 41.Bragg F, Li L, Smith M, Guo Y, Chen Y, Millwood I, et al. Associations of blood glucose and prevalent diabetes with risk of cardiovascular disease in 500 000 adult Chinese: the China Kadoorie Biobank. Diabet Med. 2014;31:540–51. doi: 10.1111/dme.12392. [DOI] [PMC free article] [PubMed] [Google Scholar]
- 42.Xia Z, Wang Z, Cai Q, Yang J, Zhang X, Yang T. Prevalence and risk factors of type 2 diabetes in the adults in Haikou City, Hainan Island, China. Iran J Public Health. 2013;42:222–30. [PMC free article] [PubMed] [Google Scholar]
- 43.Wu F, Guo Y, Kowal P, Jiang Y, Yu M, Li X, et al. Prevalence of major chronic conditions among older Chinese adults: the Study on Global AGEing and Adult Health (SAGE) Wave 1. PLoS One. 2013;8:e74176. doi: 10.1371/journal.pone.0074176. [DOI] [PMC free article] [PubMed] [Google Scholar]
- 44.Wang KW, Shu ZK, Cai L, Wu JQ, Wei W. Assessment of the magnitude of contextual and individual demographic effects on diabetes mellitus and glucose intolerance in rural southwest China: a multilevel analysis. PLoS One. 2013;8:e68553. doi: 10.1371/journal.pone.0068553. [DOI] [PMC free article] [PubMed] [Google Scholar]
- 45.Le C, Lin L, Jun D, Jianhui H, Keying Z, Wenlong C, et al. The economic burden of type 2 diabetes mellitus in rural southwest China. Int J Cardiol. 2013;165:273–7. doi: 10.1016/j.ijcard.2011.08.039. [DOI] [PubMed] [Google Scholar]
- 46.Yan S, Li J, Li S, Zhang B, Du S, Gordon-Larsen P, et al. The expanding burden of cardiometabolic risk in China: The China Health and Nutrition Survey. Obes Rev. 2012;13:810–21. doi: 10.1111/j.1467-789X.2012.01016.x. [DOI] [PMC free article] [PubMed] [Google Scholar]
- 47.Chen FL, Chen PY. Health disparities among occupations in Taiwan: a population study. J Occup Health. 2012;54:147–53. doi: 10.1539/joh.11-0052-FS. [DOI] [PubMed] [Google Scholar]
- 48.Shi Z, Yuan B, Zhang C, Zhou M, Holmboe-Ottesen G. Egg consumption and the risk of diabetes in adults, Jiangsu, China. Nutrition. 2011;27:194–8. doi: 10.1016/j.nut.2010.01.012. [DOI] [PubMed] [Google Scholar]
- 49.Lin WY, Xaiver Pi-Sunyer F, Chen CC, Davidson LE, Liu CS, Li TC, et al. Coffee consumption is inversely associated with type 2 diabetes in Chinese. Eur J Clin Invest. 2011;41:659–66. doi: 10.1111/j.1365-2362.2010.02455.x. [DOI] [PMC free article] [PubMed] [Google Scholar]
- 50.Kavikondala S, Jiang CQ, Zhang WS, Cheng KK, Lam TH, Leung GM, et al. Intergenerational influences on diabetes in a developing population: the Guangzhou Biobank Cohort Study. Am J Hum Biol. 2011;23:747–54. doi: 10.1002/ajhb.21206. [DOI] [PubMed] [Google Scholar]
- 51.Wei W, Liu SY, Zeng FF, Yao SP, Zhang HT, Wan G, et al. Type 2 diabetes and impaired glucose tolerance in North-China-based rural community adults. Public Health. 2010;124:593–601. doi: 10.1016/j.puhe.2010.05.014. [DOI] [PubMed] [Google Scholar]
- 52.Zhou X, Ji L, Luo Y, Han X, Zhang X, Sun X, et al. Risk factors associated with the presence of diabetes in Chinese communities in Beijing. Diabetes Res Clin Pract. 2009;86:233–8. doi: 10.1016/j.diabres.2009.09.014. [DOI] [PubMed] [Google Scholar]
- 53.Ning F, Pang ZC, Dong YH, Gao WG, Nan HR, Wang SJ, et al. Risk factors associated with the dramatic increase in the prevalence of diabetes in the adult Chinese population in Qingdao, China. Diabet Med. 2009;26:855–63. doi: 10.1111/j.1464-5491.2009.02791.x. [DOI] [PubMed] [Google Scholar]
- 54.Hu D, Sun L, Fu P, Xie J, Lu J, Zhou J, et al. Prevalence and risk factors for type 2 diabetes mellitus in the Chinese adult population: the InterASIA Study. Diabetes Res Clin Pract. 2009;84:288–95. doi: 10.1016/j.diabres.2009.02.021. [DOI] [PubMed] [Google Scholar]
- 55.Chou KL, Chi I. Functional disability related to diabetes mellitus in older Hong Kong Chinese adults. Gerontology. 2005;51:334–9. doi: 10.1159/000086371. [DOI] [PubMed] [Google Scholar]
- 56.Yu TS, Wong TW. Socioeconomic distribution of health and health care utilization in a new town in Hong Kong, China. Biomed Environ Sci. 2004;17:234–45. [PubMed] [Google Scholar]
- 57.Woo J, Ho SC, Sham A, Sea MM, Lam KS, Lam TH, et al. Diet and glucose tolerance in a Chinese population. Eur J Clin Nutr. 2003;57:523–30. doi: 10.1038/sj.ejcn.1601586. [DOI] [PubMed] [Google Scholar]
- 58.Chen KT, Chen CJ, Gregg EW, Engelgau MM, Narayan KM. Prevalence of type 2 diabetes mellitus in Taiwan: Ethnic variation and risk factors. Diabetes Res Clin Pract. 2001;51:59–66. doi: 10.1016/S0168-8227(00)00200-X. [DOI] [PubMed] [Google Scholar]
- 59.Chen KT, Chen CJ, Gregg EW, Williamson DF, Narayan KM. High prevalence of impaired fasting glucose and type 2 diabetes mellitus in Penghu Islets, Taiwan: evidence of a rapidly emerging epidemic? Diabetes Res Clin Pract. 1999;44:59–69. doi: 10.1016/S0168-8227(99)00025-X. [DOI] [PubMed] [Google Scholar]
- 60.Pan XR, Yang WY, Li GW, Liu J. Prevalence of diabetes and its risk factors in China, 1994. Diabetes Care. 1997;20:1664–9. doi: 10.2337/diacare.20.11.1664. [DOI] [PubMed] [Google Scholar]
- 61.Chou P, Liao MJ, Tsai ST. Associated risk factors of diabetes in Kin-Hu, Kinmen. Diabetes Res Clin Pract. 1994;26:229–35. doi: 10.1016/0168-8227(94)90065-5. [DOI] [PubMed] [Google Scholar]
- 62.Tai TY, Chuang LM, Wu HP, Chen CJ. Association of body build with non-insulin-dependent diabetes mellitus and hypertension among Chinese adults: a 4-year follow-up study. Int J Epidemiol. 1992;21:511–7. doi: 10.1093/ije/21.3.511. [DOI] [PubMed] [Google Scholar]
- 63.Woo J, Ho SC, Lau S, Lau J, Yuen YK. Prevalence of cognitive impairment and associated factors among elderly Hong Kong Chinese aged 70 years and over. Neuroepidemiology. 1994;13:50–8. doi: 10.1159/000110358. [DOI] [PubMed] [Google Scholar]
- 64.Saywell WG. Education in China since Mao. Can J High Educ. 1980;10:1–27. [Google Scholar]
- 65.Faia MA. Selection by certification: a neglected variable in stratification research. Am J Sociol. 1981;86:1093–111. doi: 10.1086/227355. [DOI] [Google Scholar]
- 66.Wallach JB, Rey MJ. A socioeconomic analysis of obesity and diabetes in New York City. Prev Chronic Dis. 2009;6:A108. [PMC free article] [PubMed] [Google Scholar]
- 67.Dinca-Panaitescu S, Dinca-Panaitescu M, Bryant T, Daiski I, Pilkington B, Raphael D. Diabetes prevalence and income: results of the Canadian Community Health Survey. Health Policy. 2011;99:116–23. doi: 10.1016/j.healthpol.2010.07.018. [DOI] [PubMed] [Google Scholar]
- 68.Ramachandran A, Mary S, Yamuna A, Murugesan N, Snehalatha C. High prevalence of diabetes and cardiovascular risk factors associated with urbanization in India. Diabetes Care. 2008;31:893–8. doi: 10.2337/dc07-1207. [DOI] [PubMed] [Google Scholar]
- 69.Galobardes B, Shaw M, Lawlor DA, Lynch JW, Davey Smith G. Indicators of socioeconomic position (part 1). J Epidemiol Community Health. 2006;60:7–12. doi: 10.1136/jech.2004.023531. [DOI] [PMC free article] [PubMed] [Google Scholar]
- 70.Turrell G. Income non-reporting: implications for health inequalities research. J Epidemiol Community Health. 2000;54:207–14. doi: 10.1136/jech.54.3.207. [DOI] [PMC free article] [PubMed] [Google Scholar]
- 71.Krieger N, Williams DR, Moss NE. Measuring social class in US public health research: concepts, methodologies, and guidelines. Annu Rev Public Health. 1997;18:341–78. doi: 10.1146/annurev.publhealth.18.1.341. [DOI] [PubMed] [Google Scholar]
- 72.The World Bank. Poverty & Equity, China. 2016. Available: http://povertydata.worldbank.org/poverty/country/CHN. Accessed: 29 August 2016.
- 73.Phillips SP, Hamberg K. Women’s relative immunity to the socio-economic health gradient: artifact or real? Glob Health Action. 2015;8:27259. doi: 10.3402/gha.v8.27259. [DOI] [PMC free article] [PubMed] [Google Scholar]
- 74.Walker JJ, Livingstone SJ, Colhoun HM, Lindsay RS, McKnight JA, Morris AD, et al. Effect of socioeconomic status on mortality among people With Type 2 Diabetes A study from the Scottish Diabetes Research Network Epidemiology Group. Diabetes Care. 2011;34:1127–32. doi: 10.2337/dc10-1862. [DOI] [PMC free article] [PubMed] [Google Scholar]
- 75.Liberatos P, Link BG, Kelsey JL. The measurement of social class in epidemiology. Epidemiol Rev. 1988;10:87–121. doi: 10.1093/oxfordjournals.epirev.a036030. [DOI] [PubMed] [Google Scholar]
- 76.Haynes R, Gale S. Deprivation and poor health in rural areas: inequalities hidden by averages. Health Place. 2000;6:275–85. doi: 10.1016/S1353-8292(00)00009-5. [DOI] [PubMed] [Google Scholar]
- 77.Barnett S, Roderick P, Martin D, Diamond I, Wrigley H. Interrelations between three proxies of health care need at the small area level: an urban/rural comparison. J Epidemiol Community Health. 2002;56:754–61. doi: 10.1136/jech.56.10.754. [DOI] [PMC free article] [PubMed] [Google Scholar]
- 78.Gilthorpe MS, Wilson RC. Rural/urban differences in the association between deprivation and healthcare utilisation. Soc Sci Med. 2003;57:2055–63. doi: 10.1016/S0277-9536(03)00071-6. [DOI] [PubMed] [Google Scholar]
- 79.Martin D, Brigham P, Roderick P, Barnett S, Diamond I. The (mis) representation of rural deprivation. Environ Plann A. 2000;32:735–51. doi: 10.1068/a32130. [DOI] [Google Scholar]
Associated Data
This section collects any data citations, data availability statements, or supplementary materials included in this article.