

Abstract
The ability to track labeled cancer cells in vivo would allow researchers to study their distribution, growth, and metastatic potential within the intact organism. Magnetic resonance (MR) imaging is invaluable for tracking cancer cells in vivo as it benefits from high spatial resolution and the absence of ionizing radiation. However, many MR contrast agents (CAs) required to label cells either do not significantly accumulate in cells or are not biologically compatible for translational studies. We have developed carbon-based nanodiamond–gadolinium(III) aggregates (NDG) for MR imaging that demonstrated remarkable properties for cell tracking in vivo. First, NDG had high relaxivity independent of field strength, a finding unprecedented for gadolinium(III) [Gd(III)]–nanoparticle conjugates. Second, NDG demonstrated a 300-fold increase in the cellular delivery of Gd(III) compared to that of clinical Gd(III) chelates without sacrificing biocompatibility. Further, we were able to monitor the tumor growth of NDG-labeled flank tumors by T1- and T2-weighted MR imaging for 26 days in vivo, longer than was reported for other MR CAs or nuclear agents. Finally, by utilizing quantitative maps of relaxation times, we were able to describe tumor morphology and heterogeneity (corroborated by histological analysis), which would not be possible with competing molecular imaging modalities.
Keywords: Nanodiamonds, gadolinium, cancer, in vivo, MRI
Graphical Abstract
INTRODUCTION
Magnetic resonance (MR) imaging is a noninvasive technique used to image live organisms in three dimensions with high spatiotemporal resolution.1–6 MR imaging is reliant on intrinsic proton relaxation times of tissue and is widely used in clinical settings as an alternative to X-ray radiography, computed tomography, and nuclear modalities because it requires no ionizing radiation. To enhance tissue contrast, paramagnetic gadolinium(III) [Gd(III)] chelates are commonly utilized as contrast agents (CAs).7–9 These agents shorten the relaxation time of water protons in the region of CA accumulation to generate contrast in tissue.7–9 Gd(III)-based agents at clinically relevant concentrations produce positive contrast by shortening the longitudinal (T1) proton relaxation time. In regions of very high CA accumulation, these agents can produce negative contrast by decreasing the transverse (T2) proton relaxation time. The efficiency with which CAs decrease relaxation time is termed relaxivity (r1 or r2 for longitudinal and transverse relaxivities, respectively). One application of MR imaging is cellular labeling, which can be harnessed to track transplanted cells and tissues in vivo. MR imaging is advantageous due to absence of ionizing radiation and better spatiotemporal resolution than optical and nuclear techniques.10–13 Information on cellular localization and movement would enhance our understanding of numerous disease processes, including immune cells homing to sites of inflammation, invasion and metastasis of cancer cells, and stem cell differentiation and migration.10,14,15
In the context of cancer, the ability to noninvasively track cancer cells in vivo would permit researchers to study cellular distribution, growth, and metastatic potential in preclinical models. Cancer cells can be labeled ex vivo with CAs, implanted into a small-animal model system, and longitudinally monitored for tumor growth. Unlike stem cells and immune cells, cancer cells present a unique challenge for CA development because their growth and proliferation dilutes the concentration of CA in the cell. Therefore, an ideal CA for tracking cancer cells should possess the following properties: substantial intracellular accumulation and retention, biocompatibility, congruence with cellular function, performance at clinically relevant field strengths, and ability to enable imaging over long periods of time.14,15
Unfortunately, clinically utilized Gd(III) chelates such as Dotarem, Magnevist, and ProHance do not effectively accumulate in cells.11,16 In contrast, nanoparticle CAs composed of iron oxide or manganese have been utilized to label cell populations.12,17–19 Although these particles benefit from high labeling efficiencies, they produce nontunable negative contrast and suffer from susceptibility artifacts and clearance by macrophages.11 If Gd(III)-based CAs can be designed for high cell accumulation, labeled cancer cells can produce tunable T1 and T2 contrast according to CA concentration within the cell.
A popular strategy to improve cell labeling efficiency of Gd(III)-based agents is conjugation to nanoparticles. There are numerous reports of Gd(III)–nanoparticle formulations with high cell labeling efficiency and imaging efficacy.1,2,5,10,20–23 In particular, carbon-based nanomaterials bearing Gd(III) ions such as gadographene, gadofullerene, and gadonanotubes have been explored.21,24–27 However, a majority of these constructs have not enabled long-term cell labeling and fate mapping in vivo due to limited stability in biological media.28,29 In contrast to other carbon-based nanomaterials, detonation nanodiamonds (NDs) have great potential for a variety of in vivo applications.30–35 NDs are 4–6 nm carbon particles with a diamond crystal structure.30,36,37 NDs are biocompatible; can carry a broad range of therapeutics; are dispersible in water; and allow uniform, scalable production.30,35,38 Nanodiamonds were recently analyzed for biocompatibility in rats and nonhuman primates and shown to be nontoxic over 6 months by comprehensive analysis of serum, urine, histology, and body weight.35
We previously developed NDs for MR imaging by covalently coupling Gd(III)-based contrast agents to the ND surface.39 These ND–Gd(III) conjugates provided approximately 10-fold enhancement in relaxivity with respect to the uncoupled Gd(III) CA and clinical Gd(III) CAs.
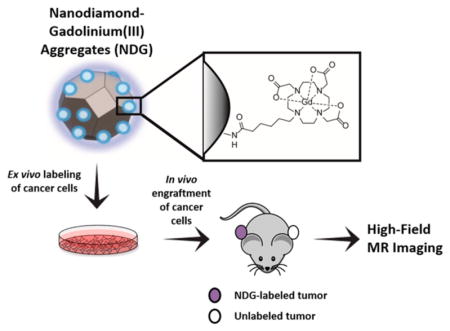
Herein, we report the synthesis, characterization, in vitro and in vivo testing of a new class of ND–Gd(III) conjugates (NDG) for MR imaging of cancer growth (Figure 1). To increase Gd(III) loading, we functionalized the nanostructure with amines by silanization of the ND surface, and peptide-coupled the aminated NDs to carboxylated Gd(III) chelates. NDG aggregates were evaluated for relaxivity across a wide range of field strengths, biocompatibility, cell labeling efficacy, and tracking long-term tumor growth in vivo using T1- and T2-weighted MR imaging at 7 T.
Figure 1.

Nanodiamond–gadolinium(III) aggregates (NDG) for tracking cancer cell growth in vivo. (1) A colloidal suspension of 4–6 nm detonation nanodiamonds (NDs) is reduced using borane in tetrahydrofuran, followed by silanization with (3-aminopropyl)-trimethoxysilane to increase primary amines on the ND surface (NDA).40 (2) NDA is peptide-coupled to Gd(III) chelates bearing a carboxylate with a six-carbon linker arm using EDC–NHS chemistry. (3) NDG spontaneously aggregates but maintains colloidal stability in water, saline, and serum-supplemented media. 4) MDA-MB-231 m-Cherry human breast cancer cells are labeled with NDG. (5) NDG-labeled cells are engrafted on the flank of immunocompromised SCID beige mice; on the other flank is engrafted an unlabeled xenograft of the same cells as a control. (6) Mice are serially imaged by MRI at 7 T to visualize tumor growth and morphology.
RESULTS AND DISCUSSION
Synthesis and Characterization of ND–Gd(III) Aggregates
NDs were reduced using borane in tetrahydrofuran, followed by silanization with (3-aminopropyl)-trimethoxysilane as previously described.40 Silanization provided additional primary amine groups on the ND surface to create aminated NDs (NDA). A Gd(III) chelate composed of a tetraazacyclododecanetriacetic acid with a six-carbon linker terminating in a carboxylic acid (Gd–C5–COOH) was synthesized (Figure S1). Gd–C5–COOH was peptide-coupled to NDA in the presence of 1-ethyl-3-[3-(dimethylamino)propyl] carbodiimide hydrochloride (EDC) and N-hydroxysuccinimide (NHS), yielding ND–Gd(III) aggregates (Figure 1).
The resulting NDG and NDA aggregates were analyzed using a number of physical and chemical characterization methods. Transmission electron microscopy (TEM) was used to visualize particle structure and revealed NDA and NDG to be heterogeneous particle aggregates (Figure S2a–d). Energy-dispersive X-ray (EDX) spectroscopy was employed to compare the chemical composition of NDG and NDA. The EDX spectrum of NDG exhibited characteristic Gd(III) peaks, and the spectrum of NDA did not (Figure S2e). Gd(III) content of NDG was additionally confirmed and quantified by inductively coupled plasma mass spectroscopy (ICP-MS) (Table 1). The Gd(III) content of NDG was 1.5 ± 0.2 μmol/mg and exceeded that of the first-generation ND–Gd(III) conjugates by 2 orders of magnitude.39 Amide bond formation was assessed by Fourier transform infrared spectroscopy (FTIR), where an amide stretch was visualized in the IR spectrum of NDG but not in the spectra of NDA or Gd–C5–COOH (Figure S3). Therefore, the conversion of amines to amides was assessed by a modified Kaiser test41 (Table 1 and Figure S4). The number of primary amines in NDG was significantly lower than that of NDA, suggesting that a majority of the Gd(III) is covalently coupled to the ND surface by amide bonds. Finally, the hydrodynamic size of NDG aggregates in water was measured by dynamic light scattering (DLS), while the surrogate surface charge was assessed by measuring ζ potentials (Figures S5–S7). NDA aggregates were 75.6 ± 8.6 nm with a ζ potential of +50.8 ± 1.8 mV. The strong positive potential observed is attributed to the large number of free amines on the NDA surface. Hydrodynamic size increases and ζ potential did not change significantly as peptide-coupling ratios of Gd–C5–COOH to ND increased from 0.1:1 and 1:1 to 5:1. As more Gd(III) is coupled to NDG aggregates, there is greater hydration as more water molecules coordinate with Gd(III).
Table 1.
Chemical Characterization of NDGa
| NDG | NDA | Gd–C5–COOH | |
|---|---|---|---|
| Gd(III) content (μmol mg−1) | 1.5 ± 0.2 | n.a. | n.a. |
| primary amines (μmol mg−1) | 0.2 ± 0.1 | 1.6 ± 0.3 | n.a. |
| r1 at 1.4 T (mM−1 s−1) | 11.1 ± 0.9 | n.a. | 6.4 ± 0.8 |
| r2 at 1.4 T (mM−1 s−1) | 16.1 ± 0.9 | n.a. | 10.4 ± 0.8 |
| r1/r2 at 1.4 T | 0.69 | n.a | 0.61 |
| r1 at 7 T (mM−1 s−1) | 11.5 ± 0.8 | n.a | 4.8 ± 0.7 |
| r2 at 7 T (mM−1 s−1) | 15.5 ± 0.8 | n.a. | 8.1 ± 0.7 |
| r1/r2 at 7 T | 0.74 | n.a. | 0.59 |
Gd(III) content of NDG is quantified by ICP-MS. Peptide coupling is verified by comparing primary amine content in NDA (pre-coupling) and NDG (post-coupling). Primary amine content is assessed using a modified Kaiser test41 (see Figure S4). The number of primary amines is lower in NDG compared to NDA as a majority of surface amines are modified to amides post-chelate coupling. r1 for NDG is two-fold greater, and r2 is 1.5-fold greater, than Gd–C5–COOH at 1.4 T. Unlike other nanoformulations bearing Gd(III) that suffer from less efficient relaxation kinetics at higher field strengths, the longitudinal relaxivity of NDG and r1/r2 ratio are maintained at 7 T. n.a. = not applicable.
To evaluate CA performance, the r1 and r2 relaxivities of NDG aggregates and Gd–C5–COOH were measured (Table 1). At 1.4 T, the r1 relaxivity of NDG aggregates was 11.1 ± 0.9 mM−1 s−1, about 2-fold greater than the r1 of Gd–C5–COOH. The r2 relaxivity of NDG aggregates was 16.1 ± 0.9 mM−1 s−1, about 1.5-fold greater than the r2 of Gd–C5–COOH. Compared to those of the first-generation ND–Gd(III) conjugates, the relaxivities of NDG aggregates was 5-fold lower. One explanation for lower r1 relaxivity is that the silanization of the ND surface alters the coordination network of Gd(III) compared to the previously unsilanized surface. Remarkably, the r1 and r2 relaxivity of NDG aggregates at 7 T was 11.5 ± 0.8 and 15.5 ± 0.8 mM−1 s−1 and comparable to the relaxivities at 1.4 T. The r1-to-r2 ratio of 0.74 at 7 T is among the highest for dual T1–T2 agents and favors tunable contrast. Further, other nanoconstructs bearing Gd(III) experience a significant drop in r1 relaxivity as a result of increasing field strength and altered relaxation kinetics.7,8,42 Therefore, the magnetic-field independence of NDG r1 relaxivity required further exploration.
Nuclear Magnetic Relaxation Dispersion Profile of NDG Aggregates
The parameters influencing r1 relaxivity of Gd(III)-based chelates are described by the Solomon–Bloembergen–Morgan (SBM) theory. SBM theory outlines three primary ways to optimize the relaxation kinetics of Gd(III) chelates: (i) changing the rotational correlation time, τr; (ii) increasing the rate of water exchange in the inner sphere, τm; and (iii) increasing the number of coordinated water molecules, q.7,9 Of these parameters, modulation of τr by slowing the reorientation time (e.g., by conjugation to a nanoparticle) is commonly used to increase r1 relaxivity.9,42 This method is most effective at field strengths up to 1.5 T, but at higher field strengths, long τr times can result in up to 90% decrease in r1 relaxivity. NDG aggregates, like other nanoparticle constructs, would be expected to benefit from a τr-mediated increase ≤1.5 T and a τr-mediated decrease at higher field strengths. However, we have observed a unique phenomenon in which r1 relaxivity of NDG at 7 T was actually comparable to that measured at 1.4 T. This finding suggests different mechanisms of relaxation kinetics are involved.
To explore which parameters gave rise to high-field performance of NDG, we obtained nuclear magnetic relaxation dispersion (NMRD) profiles of NDG aggregates and Gd–C5–COOH, where the r1 relaxivity was measured across field strengths ranging from 0.01–300 MHz (2.3 × 10⁻⁴ – 7 T) (Figure 2). We observed that the pattern of relaxivity changes across field strengths was similar between NDG aggregates and the small-molecule-chelate Gd–C5–COOH except that NDG aggregates had higher relaxivity at all field strengths (relaxivity decreased at higher temperature due to greater molecular tumbling rates). This is in agreement with the expected fast exchange regime43–45 of the coordinated water molecules, indicating optimized τm values for both the NDG aggregates and Gd–C5–COOH. There was no increase in relaxivity between the 0.5–2 T typically seen when τr of the underlying construct is long. The best-fit parameters of the NMRD profiles43,45–47 revealed that the τr values of NDG aggregates and Gd–C5–COOH were not significantly different. This suggests that the Gd(III) chelate retained rotational freedom even after attachment to NDs and that the major contributor for high-field performance was the high number of “coordinated” water molecules, q (Figures 2 and S8, and Table S1).
Figure 2.

Nuclear magnetic relaxation dispersion profiles of NDG and Gd–C5–COOH. Longitudinal proton relaxivities of NDG and Gd–C5–COOH decrease with increasing magnetic field strength but remain stable at field strengths greater than 60 MHz. The r1 of NDG is higher than that of Gd–C5–COOH at all field strengths. Unlike most other Gd(III)-nanoparticle constructs, NDG does not benefit from a τR-mediated increase between 10 and 100 MHz, nor does it suffer from a decrease in relaxivity between 60 and 300 MHz. This is likely due to ND aggregates in solution providing a loose framework for Gd(III) conjugation that does not hinder the rotational freedom of the chelates. The lines are the best fit curves obtained using parameter values reported in Table S1.
As expected for a chelate bearing a seven-coordinate gadolinium ion, the NMRD fits of aqueous Gd–C5–COOH indicate that there are two water molecules coordinated to Gd(III) in the first coordination sphere (approximately 3.1 Å), providing the best fit profile displayed as a solid line in Figure 2.8,9 The NMRD profiles reported on , where r is the metal–hydrogen distance of the ith water molecules. For NDG aggregates, to reproduce the experimental NMRD profiles, the two water molecules in the first coordination sphere must be supplemented by a relatively large number of water molecules in what is termed the “second coordination sphere”. Assuming a second-sphere radius of 3.6 Å, approximately 13 water molecules would need to coordinate with the Gd(III) ion with a lifetime m of tens of picoseconds. Furthermore, there is inverse covariance with the assumed distance of water protons and number of molecules, so there are likely fewer molecules at lesser distance or more molecules at greater distance; for example, there are 10 water molecules at 3.4 Å or 19 at 3.8 Å. Accordingly, the presence of 13 second sphere water molecules allows for an excellent agreement between best fit profiles and experimental data (Figure 2). The presence of this large network of water molecules close to the Gd(III) ion may explain the high-field performance of NDG aggregates.
There are previous reports of carbon-based nanomaterials, particularly gadonanotubes, having unique NMRD profiles in solution, especially at low field strengths (<0.1 MHz), attributed to geometric confinement of Gd(III) and high water-coordination numbers.24,48 A plausible explanation for the relaxometric behavior of NDG may be related to the hydrophilic, amidated NDG being able to form robust and continuous hydration layers near the surface.39,49 In this scenario, the Gd(III) ions would increase the relaxation rates of the water protons in these hydration layers, as in the case of water molecules in the second coordination sphere.45
Labeling Cancer Cells Using NDG
The MDA-MB-231 m-Cherry human triple-negative breast cancer cell line was used as the model system for cellular studies using NDG. Cellular tolerance of NDG was evaluated by cell viability measurements across ND concentrations ranging from 31.25–1000 μg/mL, where NDG maintained colloidal stability in serum-supplemented media at all concentrations. We observed that NDG was well-tolerated with a range of doses (Figure 3a). The cell labeling efficiency of NDG was compared with that of Gd–C5–COOH and Gd–DOTA, a clinically used chelate. Cells were incubated with different Gd(III)-equivalent doses of NDG, Gd–C5–COOH and Gd–DOTA for 24 h, after which the agents were washed and cells harvested for analysis of Gd(III) content. NDG delivered in excess of 160 fmol of Gd(III) per cancer cell, which was 300-fold greater than the amount delivered by the two free chelates (Figure 3b). The detection limit of cells labeled with Gd(III) by MR imaging is known to be approximately 0.1 fmol/cell in vitro and 1 fmol/cell in vivo.50,51
Figure 3.

Labeling MDA-MB-231 m-Cherry cells with NDG. (a) Cell viability shows that NDG is well-tolerated across a wide dose range. (b) Cells are incubated with NDG, Gd(III)–DOTA or Gd–C5–COOH for 24 h, after which they are harvested for analysis of Gd(III) content. NDG confers 300-fold improvement in cellular delivery of Gd(III) compared to Gd(III)–DOTA and Gd–C5–COOH. (c) STEM image of single cell after 24 h of incubation with NDG. Enhancing NDG aggregates are seen inside the cell and being engulfed near the plasma membrane (white arrows). (d) STEM image at greater magnification showing two highlighted areas: one with apparent NDG aggregates (teal) and another without (red). (e) EDX spectroscopy of the two regions highlighted in (d); the Lα1 peak of gadolinium is clearly observed in the spectrum for the region bearing NDG aggregates (teal) and not in the region of vacant cytoplasm (red). The Lα2 peak of gadolinium is also seen.
To confirm that cells internalized NDG aggregates, individual cells were visualized using scanning transmission electron microscopy (STEM). The resulting images showed NDG clusters within the cell and being engulfed by membrane-associated vesicles at the cell periphery (Figure 3c). A pair of regions of interest (ROIs) were delineated in the higher magnification STEM image of the cell: one with apparent NDG aggregates and the other a vacant region of cytoplasm (Figure 3d). EDX spectroscopy of the two ROIs revealed the characteristic Gd(III) X-ray spectrum only in the ROI bearing NDG aggregates and not in the region of vacant cytoplasm (Figure 3e). Collectively, we have shown that NDG aggregates are one of the most efficient delivery vehicles of Gd(III) to cells compared to other Gd(III)–nanoparticle formulations. Furthermore, the cell labeling efficacy of NDG compares favorably to that of other carbon-based nanomaterials such as gadographene,21 gadonanotubes,52 and gadofullerenes26 without sacrificing biocompatibility.
High-Field MR Imaging of Cells Labeled with NDG
To determine if the high cellular Gd(III) loading conferred by NDG translates into contrast, cellular phantoms were imaged using MR. Cells were labeled with increasing dose of NDG, spun down to a pellet, and imaged by MRI at 7 T (Figure S9). As expected, when cellular concentration of Gd(III) exceeds a certain threshold, positive contrast diminishes to yield negative contrast, even in a T1-weighted sequence. At the highest dose (Figure S9iv), T2 and T2* relaxation times are shorter than the “short” echo time of a T1-weighted sequence, resulting in a predominant T2 effect over T1.
We sought to demonstrate this “T2 shortening” is concentration-dependent and can be exploited for dual T1–T2 imaging. Instead of being spun down to a pellet, cells labeled with 500 μg/mL of NDG were diluted in an agarose–media suspension. Specifically, cylindrical cavities were created in an agarose gel and were filled with NDG-labeled (110 fmol Gd(III)/cell) or unlabeled cells suspended in 1:1 agarose–media (Figure 4a). The cavity containing the NDG-labeled cells exhibited positive T1 contrast, and the cavity containing unlabeled cells could not be differentiated from agarose background (Figure 4b). In addition, cells incubated with NDA (equal ND concentration but no Gd(III)) could not be differentiated from background (Figure 4c). In the T2-weighted sequence, the cavity containing the NDG-labeled cells appeared dark and the outline of the cavity containing the unlabeled cells is visible (Figure 4d). This vial was imaged using the IVIS Lumina optical imaging system, and m-Cherry fluorescence showed the presence of cells in both cavities (Figure 4e). These findings suggest that NDG aggregates are efficiently able to deliver a Gd(III) payload to cells, and labeled cells can produce both positive and negative contrast.
Figure 4.

(a) Experimental setup for imaging cells suspended in agarose. A pair of 5 mm cylindrical cavities are created in a vial containing a 1:1 agarose–media gel. Each cavity is gelled with either NDG-labeled or unlabeled cells suspended in a 1:1 agarose–media mixture. (b) Coronal (top) and axial (bottom) section of vial containing cells suspended in agarose–media. “NDG” indicates the cavity containing NDG-labeled cells, where significant contrast enhancement is observed, while the cavity containing unlabeled cells (“UL”) is indiscernible (location indicated by dotted circle in axial section). (c) Axial T1-weighted MR image of NDA-labeled and unlabeled cells. NDA-labeled cells are indistinguishable from unlabeled cells in terms of contrast. “NDA” indicates NDA-labeled cells, “UL” indicates unlabeled cells. (d) Axial T2-weighted MR image of NDG-labeled and unlabeled cells (same vial as that used in (b)). NDG-labeled cells exhibit negative contrast, while a faint outline of the unlabeled cells is visible using T2-weighting. “NDG” indicates NDG-labeled cells; “UL” indicates unlabeled cells. (e) The same vial as that used in (b), imaged in an IVIS Lumina optical imaging system detecting m-Cherry fluorescence and measured as radiant efficiency with units of [(p/sec/cm2/sr)/(μW/cm2)]. m-Cherry readouts indicate the presence of cells in both cavities. “NDG” indicates NDG-labeled cells; “UL” indicates unlabeled cells.
High-Field MR Imaging of NDG-Labeled Xenografts in Immunocompromised Mice for Tracking Cancer Growth In Vivo
Immunocompromised mice were inoculated with two tumors, one composed of NDG-labeled cells (right flank) and one composed of unlabeled cells (left flank). Mice were imaged at several time points over 26 days. Tumor growth was quantified over time by m-Cherry fluorescence readouts using an IVIS Lumina optical system (Figure S10).
To demonstrate tunability of contrast, cells were treated with maximum NDG dose at inoculation, where it was expected that high initial cellular NDG concentration would translate to negative contrast in T1-weighted sequences. T2 shortening is expected to dissipate as the tumor grows, where the dilution of cellular NDG concentration would result in T1-weighted positive contrast.
As early as day 2 NDG-labeled cells were visible, providing negative contrast in the T1-weighted sequence, as expected (Figure 5a). The unlabeled cells displayed a similar signal as that of the surrounding muscle. The T2-weighted images showed the location of the unlabeled cells on the left flank more clearly (Figure 5b). By day 14, the NDG tumor was enlarged and still displayed T2 shortening. The unlabeled tumor grew and continued to exhibit as much signal as surrounding muscle.
Figure 5.

7 T MR images of a SCID-beige mouse bearing a NDG-labeled xenograft and an unlabeled xenograft of MDA-MB-231 m-Cherry cells (n = 5, representative mouse shown). Images are shown 2, 14, and 26 days after engraftment. NDG tumor is on the right flank (left in page, red arrows); unlabeled tumor is on the left flank (right in page, white arrows). (a) T1-weighted images, where the NDG tumor is clearly visualized as a dark mass on the right flank, and the unlabeled tumor, showing a similar signal as compared to the surrounding muscle. As the NDG tumor enlarges, there is a progressive increase in signal brightness as Gd(III) dilutes within the tumor to limit the T2-shortening effect. (b) T2-weighted images, where the NDG appears dark and the unlabeled tumor appears bright relative to the surrounding tissue. This sequence of images validates the positions of the tumors in the T1-weighted sequence, particularly of the unlabeled tumor in the left flank. (c) A quantitative heat map of T1 relaxation times in the NDG tumor, unlabeled tumor and muscle is overlaid on the T2-weighted anatomical image of the mouse at day 26. Shorter T1 times in the NDG tumor likely indicate high levels of Gd(III) within the tumor core, while longer T1 times at the tumor edge likely indicate edema. The saturation-recovery plots of longitudinal relaxation (right panel) demonstrate the T2 shortening of T1 in the NDG tumor while showing longer relaxation time of the unlabeled tumor compared with those of the surrounding muscle.
However, by day 26, there was significant variance in contrast enhancement in different parts of the NDG tumor, with some regions showing positive contrast and others showing negative contrast. This suggests that Gd(III) was heterogeneously distributed. This profile was further validated by the T2-weighted images that showed a contrast differential within the tumor (as expected, regions that appeared bright in the T1-weighted image were dark in the T2-weighted image). This transition from negative to positive contrast is helpful for determining tissue distribution of agent.
At each MR imaging time point, the T1- and T2-relaxation times within each tumor and surrounding muscle was measured. However, during early time points (up to 19 days), the T1- or T2-relaxation times could not be quantified due to high cellular NDG concentration causing T2-shortening. At Day 26, a quantitative T1-map was overlaid on the T2-weighted anatomical image (Figure 5c, left panel). The T1-relaxation time for a representative ROI defined within the NDG tumor 26 days after engraftment was 844 ms, compared to T1 times of 2225 and 1999 ms in ROIs defined in the unlabeled tumor and muscle, respectively. Within the NDG tumor, the T1 times ranged from 0–2500 ms. T1 values have previously been correlated with tissue properties, where short T1 values are associated with fat or Gd(III)-mediated contrast enhancement, long T1 values are associated with fluid (blood, lymph, or edema), and intermediate values are associated with soft tissue.8,9,53 Accordingly, in the NDG tumor, T1 times <100 ms likely corresponded to areas of high Gd(III) concentration (e.g., necrotic regions where Gd(III) has pooled or regions of less dilution and, therefore, less proliferation in the tumor core), and intermediate T1 times between 500–800 ms corresponded to actively dividing NDG-labeled cells, while long T1 times (>2500 ms) were likely due to edema within the tumor.
To further quantify MR signal in the tumors, ROIs were delineated within each tumor and within surrounding muscle (Figure S11). The saturation recovery of longitudinal magnetization was plotted against time for each of the ROIs (Figure 5c, right panel). We observed that the unlabeled tumor and muscle have typical T1 signal-recovery profiles, while the signal is not completely recovered in the NDG tumor, suggestive of T2 shortening. Overall, by dilution of Gd(III) across time and a quantitative T1 map within the NDG-labeled tumor, we are able to describe tumor morphology and heterogeneity. The regional contrast variance used to describe tissue features would not be possible with other MR CAs because T2 agents (e.g., iron oxide nanoparticles) display negative contrast only, and other Gd(III) agents suffer from low sensitivity. While the accuracy of this technique to describe tumor heterogeneity is limited by lack of similar T1 maps of the labeled tissue at baseline and other successive time points, it represents a new way to broadly and noninvasively analyze tumor growth.
Biodistribution of NDG Aggregates in Recipient Mice and within Tumor Xenografts
At the end of the 26 day time point three mice were euthanized, and both tumors, proximal leg muscles, kidneys, liver, spleen, stomach, and bowels were harvested for analysis of Gd(III) content. On average, the NDG tumors had 971 ± 534 μg of Gd(III) per g of tissue, where proximal leg muscle and unlabeled tumors had <1 μg/g of tissue (Figure 6a). The Gd(III) content detected in the other clearance organs was also <1 μg/g of tissue (Figure S12). The NDG tumors at the end of day 26 retained approximately 95% of the Gd(III) inoculated at day 0 (Figure 6b), indicating that NDG aggregates are well-retained within the tumor nearly one month after engraftment. This level of retention would not be possible with iron oxide nanoparticles due to metabolism by the innate immune system.
Figure 6.

(a) Gd(III) content of tumors harvested at the 26 day end point (n = 3). The NDG tumors have high Gd(III) content of approximately 1 mg per g of tissue, while unlabeled tumors and muscle has negligible quantities of Gd(III). (b) Gd(III) content in NDG tumors was compared between the inoculation time point and the 26 day end point, and on average, 95% of the Gd(III) remained within the tumor. (c) Hematoxylin and eosin (H&E) section of unlabeled tumor (40× magnification) showing uniform, invasive neoplastic cells along with a region of central clearing indicative of necrosis, along with showing several mitoses indicative of a high proliferative rate. (d) H&E section of NDG tumor (60× magnification) showing a similar morphology to the unlabeled tumor but containing visible NDG aggregates within neoplastic cells and in the interstitial space (black arrows). The number of mitoses visible is comparable to the unlabeled tumor. An enlarged image is shown in Figure S13 for greater detail. (e) Spatial distribution of Gd(III) in a cross-section of the NDG tumor, quantified using laser ablation ICP-MS. Gd(III) is distributed throughout the section, with highest concentrations in the center.
The remaining two mice were euthanized for histological analysis of the NDG tumor and unlabeled tumor. In hematoxylin and eosin (H&E) sections, we observed invasive tumor cells with high mitotic rate, along with diffuse regions of necrosis and edema in both the unlabeled and NDG tumors (Figure 6c,d). We noted that the NDG tumor section contained several granular masses that were most likely NDG aggregates (Figure 6d, black arrows; Figure S13). Laser-ablation ICP-MS of an approximately 12 mm × 6 mm NDG tumor cross-section showed that Gd(III) was distributed throughout the tumor with highest concentrations in the center (Figure 6e). Similar analysis of the unlabeled tumor showed absence of Gd(III) as expected (Figure S14). These findings correspond to the morphological changes described on the basis of the T1 maps of the tumors. Collectively, these findings serve as evidence that NDG aggregates can be visualized within the tumor by light microscopy and that they accumulate significantly within the tumor without affecting negatively affecting tumor architecture.
CONCLUSIONS
In summary, we present nanodiamond–gadolinium(III) aggregates for MR imaging of cancer growth in vivo that fulfill nearly all of the criteria for a highly effective MR contrast agent: high relaxivity at high field strengths, significant Gd(III) payload delivery to cells, biocompatibility, no adverse effects on tumor growth (determined based on cells tested in this study), retention over time, and long-term imaging capability with dual contrast up to one month. While other carbon nanomaterials, such as graphene, fullerenes, and nanotubes, have all been conjugated to Gd(III) and have been shown to label cells with high efficiency, few of these constructs have been translated toward in vivo biological applications.21,26,28,54
The ability to track the pattern of cancer growth in vivo is highly valuable to determine tumor properties such as growth potential and invasiveness.4,10,55,56 NDG-labeled cells have the unique property of transitioning from negative to positive contrast depending on concentration. We have shown that cancer cells prelabeled with NDG aggregates enable the longitudinal monitoring of cancer growth from engraftment to growth and differentiation. We have presented a new method with which to describe tumor morphology and regional variance in tumor architecture on the basis of relaxation times by differential distribution of NDG across the tumor.
While we used flank xenografts as a proof-of-concept, our findings can be extended to orthotopic tumor xenografts within the brain, thorax, abdomen, and pelvis: locations that can only be imaged noninvasively via a modality that provides high spatial resolution, unlimited depth penetration, and three-dimensional imaging. The long-term retention of NDG aggregates within cancer cells without inducing cytotoxicity can be potentially applied toward tracking other types of therapeutic cells such as pluripotent stem cells and immune cells. However, the biocompatibility of NDG with these types of cells are yet to be assessed.
It is clear that nanodiamond–gadolinium(III) aggregates are promising MR contrast agents for imaging cancer in vivo and can potentially be utilized for labeling, imaging, and tracking a variety of cells for advanced therapeutic benefits.
MATERIALS AND METHODS
General Synthesis Methods and Characterization
Reagents and solvents were purchased from Sigma-Aldrich Chemical Co. (St. Louis, MO) unless specified otherwise. Synthesis procedures were performed under ambient conditions unless described explicitly. Initial purification of Gd(III) chelates and precursors was accomplished by flash chromatography using standard-grade silica gel (Sorbent Technologies, Norcross, GA). A Varian 500 MHz Avance III nuclear magnetic resonance spectrometer and a Bruker Amazon X LC-MS ion trap mass spectrometer (Billerica, MA) were used for chemical characterization. Final purification was achieved using a Varian Prostar 500 high-performance liquid chromatograph using a Waters 4.6 × 250 mm 5 μm Atlantis C18 column and mobile phases of Millipore water, 0.05% trifluoroacetic acid in Millipore water, and acetonitrile. Dynamic light scattering for NDG characterization was performed on a Malvern ZetasizerNano (Malvern Instruments Ltd., Malvern, United Kingdom) particle size and ζ potential analyzer.
Synthesis of Ethyl-Protected DO3A Macrocycle (1,4,7-Tris(ethyl acetate)-1,4,7,10-tetraazacyclododecane·HBr
Cyclen (Strem Chemicals Inc., 2.202 g, 12.8 mmol), sodium acetate (3.158 g, 38.5 mmol), and acetonitrile (40 mL) were added sequentially into a 250 mL round-bottom flask equipped with a magnetic stir bar and a digital thermometer. The reaction vessel was cooled in an ice bath and stirred at 0 °C for 10 min. In a separate 150 mL Erlenmeyer flask, ethyl bromoacetate (4.20 mL, 37.9 mmol) was diluted into acetonitrile (20 mL). The dissolved ethyl bromoacetate was transferred into an addition funnel and added drop-wise to the reaction vessel containing cyclen and sodium acetate in acetonitrile over 30 min while maintaining a temperature below 5 °C. The reaction was stirred under these conditions for an additional 15 min before the ice bath was removed, the reaction allowed to warm to room temperature, and stirring continued overnight. After stirring for 18 h, the solids were separated by filtration and rinsed with acetonitrile. The organic solution was concentrated to a clear oil and dissolved in methanol (5 mL, required heat and sonication). Upon complete dissolution, diethyl ether (25 mL) was slowly added. The resultant suspension was cooled at −20 °C for 12 h. The white precipitate was collected and dried by lyophilization. Yield: 2.505 g (35%). 1H NMR (500 MHz, CDCl3, δ): 10.01 (s, 1H), 4.17 (qd, J = 7.2, 1.2 Hz, 6H), 3.75–2.41 (m, 22H), 1.28 (td, J = 7.2, 1.2 Hz, 9H). 13C NMR (126 MHz, CDCl3) δ 171.15, 170.31, 61.31, 60.78, 57.27, 55.17, 51.38, 49.25, 48.22, 47.43, 14.31. ESI-MS (m/z) [M + H]+ calcd, 431.3; found, 431.3.
Synthesis of 1-(Ethyl hexanoate)-4,7,10-Tris[(tertethylcarbonyl)methyl]-1,4,7,10-tetraazacyclododecane
To a 50 mL round-bottom flask was added 1,4,7-Tris(ethyl acetate)-1,4,7,10-tetraazacyclododecane·HBr (0.550 g, 1.1 mmol) and potassium carbonate (0.375 g, 2.7 mmol) followed by dissolution in acetonitrile (10 mL). To the cloudy suspension was added ethyl 6-bromohexanoate (0.29 mL, 1.6 mmol). The reaction mixture was heated to 50 °C and allowed to stir under nitrogen for 18 h. Reaction progress was monitored by thin layer chromatography with 1:9 methanol–dichloromethane and iodoplatinate stain. Upon completion of the reaction, the solution was filtered using a Büchner funnel to remove excess salts, and the residual solids were washed with acetonitrile. The product-containing filtrate was concentrated under vacuum, and the crude material was purified using flash column chromatography with a gradient of 5:95 to 10:90 methanol–dichloromethane. Elution of product was monitored by TLC using iodoplatinate stain. 13C NMR analysis of purified product contained peaks that suggest partial deprotection or transesterification of ethyl esters during column chromatography. Therefore, primary product characterization was achieved by electrospray ionization–mass spectrometry (ESI–MS). Combined fractions were collected, concentrated by rotary evaporation and stored under vacuum overnight. Yield: 0.501 g (82%). ESI–MS (m/z) [M + H]+ calcd: 572.7; found: 572.5.
Synthesis of Gd–C5–COOH
To a 50 mL round-bottom flask was added the tetra-ethyl protected chelate (0.279 g, 0.5 mmol) dissolved in aqueous 1 M sodium hydroxide (10 mL) for saponification of the chelate ethyl esters. The reaction was stirred at room temperature for 4 h, at which time complete deprotection was observed by ESI–MS. The pH of the stirring solution was adjusted to 7.2 using 1 M hydrochloric acid. Gadolinium(III) acetate hydrate (0.242 g, 0.6 mmol) was added, followed by an observed drop in pH to 4.7. The mildly acidic conditions required for metalation were achieved by addition of 1 M sodium hydroxide to pH 6.5. The metalation reaction was stirred at room temperature for 24 h. The crude mixture was purified by semipreparative reverse-phase high-performance liquid chromatography (RP-HPLC) using the following conditions: 0 min 0% solvent B, 17 min 31% solvent B, 21–26 min 100% solvent B, and 31–34 min 0% solvent B. The desired product, Gd–C5–COOH, elutes from 15.0 to 15.9 min as monitored by UV–vis at 201/210 nm and was collected and lyophilized. Yield: 0.156 g (52%). ESI-MS (m/z) [M + H]+ calcd: 616.16166; found: 616.1618. Anal. calcd for K[C20H32GdN4O8]·5H2O, C: 31.57; H: 5.83; N:7.36. Found: C: 31.22; H: 5.69; N: 7.12.
Nanodiamonds, Aminated Nanodiamonds, and Nanodiamond–Gadolinium(III) Aggregates
Nanodiamond (ND) powders were acquired from the Nanocarbon Research Institute (Nagano, Japan). Amine modified NDs were produced according to the protocols from Kruger et al,57 Zhang et al.,58 and Chow et al.32 Briefly, after reduction of the ND surface (2.5 g) with BH3·THF (25 mL, 1M) for 3 days, the ND surface (1 g) was functionalized with (3-aminopropyl)-trimethoxysilane (100 mL, 5%), purified by centrifugation, and dried by lyophlization. NDA powder was then resuspended to a concentration of 10 mg/mL in 0.2% w/v acetic acid. A total of 1 mL of this NDA suspension (10 mg of NDA) was dissolved in 0.5 mL of diisopropylethyl amine and 3.5 mL of DMSO, following by vigorous sonication. In a separate vessel, 0.5, 5, or 50 mg of Gd–C5–COOH (see Figure S1 for synthesis details) was combined with five equivalents of NHS and EDC in 5 mL of 3:1 DMSO–Millipore water and vigorously sonicated. NDA and Gd–C5–COOH mixtures were combined in a 15 mL Falcon tube and shaken overnight at room temperature. The mixture was purified first by three rounds of centrifugation with Milli-Q water at 10000g for 20 min. At the end of the third round, the pellet was resuspended in 1 mL of milli-Q water and transferred to a 1.5 mL Eppendorf tube. This mixture is purified by a further 3 rounds of centrifugation at 21000g for 20 min. The final pellet is resuspended in 1 mL of 0.2% w/v acetic acid, resulting in the NDG aggregates at 10 mg/mL.
Low-Field Relaxivity (r1 and r2)
A stock suspension of NDG was made by suspending 10 mg of NDG in 1 mL of 0.2% w/v acetic acid as explained above. Then, between 50 and 100 μL was taken from the stock and dissolved in Millipore water to total volume of 1 mL. This sample was serially diluted four times generating five samples of 500 μL each. Solutions were heated to 37 °C, and 500 μL of each concentration was placed into a Bruker minispec mq60 60 MHz (1.41 T) NMR spectrometer (Billerica, MA) for measurement of T1 and T2 relaxation time. Data were collected using an inversion recovery pulse sequence using four averages, a 15 s repetition time, and 10 data points. The remaining volumes of each solution were utilized for ICP analysis of Gd(III) concentration. The inverse of the relaxation time (1/T1 or 1/T2, s−1) was plotted against the Gd(III) concentration (mM) determined by ICP-MS of each of the five samples. By the application of a linear fit to this data, the slope that was generated was defined as the relaxivity of the agent in units of mM−1 s−1.
High-Field Relaxivity (7 T)
A stock suspension of NDG at 10 mg/mL was made as described in above. Samples of 10, 7.5, 5, and 2.5 μL of the stock suspension were added to Millipore water to a total volume of 500 μL. Each solution was added to a 5 3/4 in. flame-sealed Pasteur pipet and centrifuged at 100g at 4.0 °C for 5 min. The bottom sections of the pipets were scored with a glass scribe to make small capillaries, which were imaged on a Bruker Pharmscan 7 T imaging spectrometer fitted with a RF RES 300 1H 089/023 quadrature transmit receive 23 mm volume coil (Bruker BioSpin, Billerica, MA). T1 relaxation times were measured using a rapid-acquisition rapid-echo (RARE-VTR) T1 map pulse sequence, with static echo time (11 ms) and variable repetition time (150, 250, 500, 750, 1000, 2000, 4000, 6000, 8000, and 10000 ms) values. Imaging parameters were as follows: field of view (FOV), 25 × 25 mm2; matrix size (MTX), 256 × 256; number of axial slices, 4; slice thickness (SI), 1.0 mm; and averages (NEX), 3 (total scan time: 2 h 36 min). T1 analysis was carried out using the image sequence analysis tool in Paravision 6.0 software (Bruker) with monoexponential curve-fitting of image intensities of selected regions of interest (ROIs) for each axial slice. Spin–spin relaxation times (T2) were measured using a multislice multiecho (MSME) T2-map pulse sequence, with static TR (5000 ms) and 32 fitted echoes in 11 ms intervals (11, 22,…, 352 ms). Imaging parameters were as follows: field of view, 25 × 25 mm2; matrix size, 256 × 256; number of axial slices, 4; slice thickness, 1.0 mm; and averages, 3 (total scan time: 48 min). T2 analysis was carried out using the image sequence analysis tool in Paravision 6.0 software (Bruker) with monoexponential curve-fitting of image intensities of selected ROIs for each axial slice.
Metals Analysis by ICP-MS
ICP-MS was performed on a computer-controlled (QTEGA v. 2.6) Thermo (Thermo Fisher Scientific, Waltham, MA) iCapQ ICP-MS equipped with an ESI SC-2DX autosampler and autodilution system (Elemental Scientific Inc., Omaha, NE). Quantitation of metal concentration was performed by acid digestion of nanoconjugate samples followed by ICP-MS analysis. Specifically, for NDG aggregates, Gd(III) content was measured by addition of 5 ul of NDG sample into 300 μL of concentrated nitric acid (BDH AristarPlus Nitric acid, 70%). The mixture was heated at 65 °C for at least 2 h. This was followed by addition of ultrapure H2O (18.2 Ω·m) up to a 10 mL total sample volume. For cells labeled with NDG, 20–150 μL of NDG-labeled cells suspended in PBS or media were added to 100 μL 70% nitric acid and heated at 65 °C for at least 4 h. Following digestion, ultrapure H2O water was added for a final sample volume of 3 mL. Individual Gd elemental standards were prepared at 0, 0.78125, 1.5625, 3.125, 6.25, 12.5, 25.0, 50.0, 100, and 200 ng/mL concentrations with 2% nitric acid (v/v), 2% HCl (v/v), and 5.0 ng/mL internal standards (6Li, Sc, Y, In, Ho, and Bi), up to a total sample volume of 5 mL. Each sample was acquired using pme survey run (one sweep) and three main (peak jumping) runs (100 sweeps). The isotopes selected were 156,157Gd using 115In and 165Ho as internal standards for data interpolation and machine stability. Instrument performance was optimized daily by means of manufacturer’s autotune and Thermo TuneA solution.
FTIR
NDG, NDA, and Gd–C5–COOH were dried in vacuo. Infrared spectra were obtained with a Bruker Alpha FTIR spectrometer equipped with an attenuated total reflectance accessory. Approximately 3 mg of each sample was analyzed with the anvil depressed.
Primary Amine Quantification
A modified Kaiser test was used to quantify primary amines and is based on a procedure previously reported by Jarre et al.41 The following reagents are utilized.
acetate buffer at pH 5.5
5% ninhydrin solution
KCN–pyridine reagent: 2 mL of 30 mM KCN dissolved in 98 mL of pyridine
phenol solution: 40 g of phenol dissolved in 10 mL of ethanol
ethanol solution: 30 mL of reagent alcohol is dissolved in 20 mL of DI water
For the standard curve, 1 mL of known concentrations of benzylamine (10, 5, 2.5, 1.25, and 0.625 mM) were used. For NDG or NDA, 1 mg of dried sample was vigorously sonicated in 1 mL of DI water. To this 1 mL of solution of NDG, NDA, or benzylamine was added 1 mL of reagent (i) followed by sonication for 15 min. Next, 1 mL of reagent (iii) and 1 mL of reagent (iv) were added, and the suspension was heated in an oil bath at 120 °C for 10 min. Next, 1 mL of reagent (ii) was added and heated for another 10 min. The solution was then cooled to room temperature within 30 min, and 5 mL of ethanol solution was added. The solids were separated by centrifugation, and a UV–vis spectrum was recorded from the supernatants. The peak at 570 nm indicated presence of primary amines. Unknown amine concentrations were determined from a standard curve.
STEM and EDX Spectroscopic analysis
NDG and NDA samples were dried and placed on gold slot grids with a carbon coated Formvar support film and analyzed in a STEM (HD2300-A, Hitachi) with a dual-detector EDX system (energy-dispersive X-ray spectroscopy; Thermo Scientific, MA). System settings were as follows: 200 kV acceleration voltage, objective aperture of 75 μm in diameter, and 2 min spectrum recording time per area. The NSS Noran System Seven software was used for EDX analysis.
Resin Embedding of Cells for STEM and EDX Spectroscopic Analysis
Cells were labeled with 1 mg/mL NDG in media for 24 h. Cells were washed, harvested, and fixed in 2.5% glutaraldehyde (25% aqueous stock solution), 2% formaldehyde (16% aqueous stock solution) (Electron Microscopy Sciences) in DPBS (Dulbecco’s phosphate-buffered saline, Cellgro Mediatech, Inc.) at pH 7.4. After fixation overnight at 4 °C, the samples were rinsed in PBS and in ddH2O for 15 min each and post-fixed in aqueous 2% osmium tetroxide (EMS) for 1 h. After two rinses in ddH2O for 15 min each, the specimens were dehydrated in 25%, 50%, 75%, and 90% ethanol for 20 min each and two times for 10 min each in 100% ethanol. After infiltration with a 1:1 mixture of Spurr resin (EMS) and ethanol for 3 h, the samples were infiltrated overnight in pure resin. For polymerization, the samples were transferred into fresh resin in flat embedding molds and polymerized at 60 °C for 48 h. The blocks were sectioned using a diamond knife (Diatome) with an ultra-microtome (UC7, Leica) at a nominal thickness of 70 nm, and the sections were collected on 200 mesh copper grids, dried, and observed in a STEM (HD2300-A, Hitachi) with an acceleration voltage of 80 kV. The NSS Noran System Seven software was used for EDX analysis.
NMRD Profiles and Analysis
Water proton relaxation rates of solutions containing NDG, Gd–C5–COOH, or Gd–C5–COOH mixed with NDA were measured from 0.01 to 40 MHz proton Larmor frequency using a fast field cycling Stelar relaxometer. The relaxivity profiles of NDG were obtained after the subtraction of the diamagnetic NDA relaxation rates and normalized to 1 mM Gd(III) concentration.
General Cell Culture
DPBS, media, and dissociation reagents were purchased from Life Technologies (Carlsbad, CA). CorningBrand cell culture consumables (flasks, plates, etc.) and sera were purchased from VWR Scientific (Radnor, PA). MDA-MB-231 m-Cherry (ATCC HTB-26TM) cells were purchased from the American Type Culture Collection (ATCC, Manassas, VA) and cultured in phenol red-free minimum essential media-α (α-MEM) supplemented with 10% fetal bovine serum (FBS), 1% nonessential amino acids, 1% sodium pyruvate, and 1% 100 mM L-glutamate. Cells were confirmed free of mycoplasma contamination by MycoAlert Mycoplasma Detection Kit (Lonza Group Ltd., Switzerland). Prior to all experiments, cells were plated and allowed to incubate for 24 h before dosing. Cells were harvested with 0.25% TrypLE for 5 min at 37 °C in a 5.0% CO2 incubator. Cells were grown in a humidified incubator operating at 37 °C and 5.0% CO2.
Guava ViaCount Assay for Cell Counting
Cell counting was conducted using a Guava EasyCyte Mini Personal Cell Analyzer (EMD Millipore). After cell harvesting, an aliquot (50 μL) of the cell suspensions was mixed with Guava ViaCount reagent (150 μL) and allowed to stain at room temperature for at least 5 min (dilution factor of 4 and cell density between 20 and 150 cells/μL). After gentle vortexing for 10 s, stained cells were counted using a Guava EasyCyte Mini Personal Cell Analyzer (PCA) using the ViaCount software module. For each sample, 500–1000 events were acquired. Gating of live–dead and cell–debris classifications were performed manually by the operator. Instrument performance was validated biweekly using GuavaCheck Beads following the software module “Daily Check”.
Cellular Delivery Studies
Cellular delivery studies were performed with MDA-MB-231 m-Cherry cells. MDA-MB-231 m-Cherry cells were plated at a cell density of approximately 25 000 per well for 24 h of uptake in a 24 well plate as counted by a hemocytometer. Stock solutions of NDG were prepared by resuspending a pellet of known mass of NDG in fresh media. Gd(III) concentration ranged from 5–1500 μM (0.005–1 mg/mL diamond concentration). For harvesting, cells were rinsed in-plate three times with 500 μL of PBS and trypsinized using 100 μL of 0.25% TrypLE. Following trypsin treatment, 150 μL of media was added to each well and mixed by a pipet to ensure that all cells were lifted into suspension. The cellular suspensions were centrifuged at 1000g for 5 min at 4 °C, after which the supernatant was discarded, and the pellet was resuspended in fresh media. This process was repeated twice. From the final cell suspension, 50 μL was used for cell counting, and 150 μL was used for Gd content analysis via ICP-MS.
Cell Pellet MR Imaging
Approximately 7.5 × 10⁵ MDA-MB-231 m-Cherry cells were incubated in 25 cm2 T-flasks with NDG aggregates (Gd(III) concentrations of 500, 50, and 5 μM) suspended in media for 24 h, rinsed with DPBS (2 × 1 mL/flask), and harvested with 500 μL of trypsin. After the addition of 500 μL of fresh complete media, cells were transferred to 1.5 mL microcentrifuge tubes and centrifuged at 1000g at 4.0 °C for 5 min. The supernatant was removed; the cell pellets were resuspended in 1 mL of complete media, added to 5 3/4 in. flame-sealed Pasteur pipets, and centrifuged at 100g at 4.0 °C for 5 min. The bottom sections of the flame-sealed pipets were then scored with a glass scribe, broken into small capillaries, and imaged using a RF RES 300 1H 089/023 quadrature transreceiver 23 mm volume coil (Bruker BioSpin). T1 and T2 relaxation times were measured as described above.
Agarose Cell Phantoms
A 2% w/v low-melting-temperature agarose solution was mixed in equal parts with serum supplemented media at 37 °C to create a 1% agarose–media mixture. A 10 mL glass vial was gelled with 5 mL of the agarose–media mixture around two 5 mm outer diameter NMR tubes placed approximately 3 mm apart and about 1 cm from the bottom of the vial. The tubes were then removed to create cylindrical cavities within the gel. One cavity was filled with 250 μL of cells, labeled with 0.5 mg/mL NDG for 24 h and suspended in warm agarose–media mixture at a cell density of 30 000 cells/μL. The other cavity was filled with unlabeled cells suspended in warm agarose–/media mixture at the same cell density. The vial was placed on ice for 15 min for gelling to take place.
The vial was filled with media, capped, and sealed with parafilm. The vial was imaged in a Bruker Pharmscan 7 T imaging spectrometer fitted with RF RES 300 1H 089/023 quadrature transreceiver 23 mm volume coil (Bruker BioSpin) at 25 °C. A rapid acquisition with refocused echoes (RARE) pulse sequence was used. For T1 weighting, the following parameters were used: TR, 208.7 ms; TE, 10.8 ms; flip angle, 180°; NEX, 1; FOV, 25 × 25 mm2; slice thickness, 1 mm; and matrix size, 256 × 256. For T2 weighting, the following parameters were used: TR, 4000 ms; TE, 40 ms; flip angle, 180°; NEX, 1; FOV, 25 × 25 mm2; slice thickness, 1 mm; and matrix size, 256 × 256. The same vial was also imaged in an IVIS Spectrum (PerkinElmer, Waltham, MA) for m-Cherry fluorescence. An excitation wavelength of 580 nm and an emission wavelength of 620 nm were used.
In Vivo Studies
All mice were handled and processed according to a protocol approved by Northwestern University Animal Care and Use Committee in accordance with current guidelines from the National Institutes of Health Model Procedure of Animal Care and Use. Female, SCID-beige mice aged 6–8 weeks at initiation were used for the length of the study. Mice were imaged by MRI on a Bruker PharmaScan 7 T magnet (Bruker Biospin). A total of five flasks containing approximately 5 × 10⁶ MDA-MB-231 m-Cherry cells were labeled with NDG at 500 μM Gd(III) concentration (0.5 mg/mL diamond concentration) for 24 h. Cells from each flask were washed repeatedly, resuspended in sterile phosphate buffered saline to a volume of 0.1 mL, and injected into the right rear flank of the mice (n = 5).
Similarly, unlabeled cells were injected into the left rear flank of the same mice. Mice were then imaged at 2, 5, 9, 14, 19, and 26 days postengraftment using both T1- and T2-weighted sequences. During imaging, mice were held under 1–2% inhaled isoflurane anesthesia and respiration was monitored using an SA Instruments MR compatible monitoring system (SA Instruments, Stonybrook, NY). T1-weighted images were acquired using a rapid acquisition rapid echo (T1-RARE) sequence with imaging parameters as follows: RARE factor, 4; repetition time (TR)/echo time (TE), 750 ms/6.2 ms; field of view, 30 × 30 mm2; matrix size, 200 × 200; number of axial slices, 3; slice thickness, 0.7 mm; and averages, 1. T2-weighted images were acquired using an accelerated TurboRARE sequence with imaging parameters as follows: RARE factor, 4; TR/TE, 800 ms/17 ms; NEX, 4; and identical geometry to the T1-RARE sequence. T1 relaxation times were measured using a RARE T1-map pulse sequence (RARE-VTR), with static echo time (6.5 ms) and variable repetition time (100, 200, 400, 800, 1500, 3000, and 6500 ms). Imaging parameters were as follows: RARE factor, 2; FOV, 30 × 30 mm2; MTX, 128 × 128; NS, 3; slice SI, 0.7 mm; and NEX, 1 (total scan time: 11 min).
T1 analysis was carried out using JIM 6.0 (Xinapse Systems, Essex, UK) with monoexponential curve-fitting of image intensities. JIM 6.0 was also used to draw ROIs in each tumor and surrounding muscle in the T1-weighted image obtained at day 26 for each mouse. T1 maps obtained in each ROI were overlaid on a T2-weighted anatomical reference image from the same time point.
In Vivo Fluorescence Imaging
Immediately prior to each MRI time point, fluorescence images of mice were obtained an IVIS Spectrum (PerkinElmer, Waltham, MA). Mice held under 3% inhaled isoflurane anesthesia for the duration of imaging. Mice were placed on their right or left side to image the NDG tumor or unlabeled tumor, respectively. For m-Cherry fluorescence readouts, an excitation wavelength of 580 nm and emission wavelength of 620 nm were used. Mice were allowed to recover and ambulate for several minutes before MR imaging. Image data were processed using Living Image software. ROIs were defined corresponding to each tumor and used to determine background subtracted radiant efficiency.
Organ Analysis for Gd(III) Content
At the end of the 26 day time point, mice were sacrificed, and their organs were digested and analyzed for Gd(III) content by ICP-MS. The tumors, proximal leg muscles, spleens, and kidneys were placed into preweighed Teflon tubes, weighed, and dissolved in 9:1 ACS reagent grade nitric acid–hydrogen peroxide to a total volume of 1 mL. The livers, stomachs, and bowels were placed into preweighed TFM vessels, weighed, and dissolved in 9:1 ACS reagent grade nitric acid–hydrogen peroxide (10 mL). The solutions were digested using an EthosEZ microwave digestion system (Milestone, Shelton, CT) with a 120 °C ramp for 30 min followed by a 30 min hold and a 45 min exhaust cycle. The resultant solutions were weighed and an aliquot was transferred to a preweighed 15 mL conical tube. The final ICP-MS sample was prepared as described above.
Laser Ablation ICP-MS
Laser ablation ICP-MS was accomplished using a NuWave UP213 Nd:Yag Laser (Elemental Scientific Inc., Portland, OR) coupled to a computer-controlled (QTEGRA v. 2.6.2) Thermo iCapQ ICP-MS (Thermo Fisher Scientific) of NDG-labeled and unlabeled tumor cross-sections. Laser ablation performance was optimized prior to ample runs using a NIST 612 glass standard using an 80 um spot size, 10 Hz rep rate, and 100% laser power (percent He was optimized at 5% with nebulizer Ar pressure at 1). Tissue sections were ablated using a 100 μm spot size, 20 Hz rep rate, 100 um/sec laser passes, and laser output of 39–42% (laser power was adjusted to a fluence of 0.2–0.3 mJ for accurate tissue ablation). Additionally, the method was setup with a 40 s laser warm-up time prior to each line pass and a 20 s washout time at the end of each line pass. The isotopes selected or analysis were 64Zn, 66Zn, 57Fe, 156Gd, and 157Gd with a 10 ms dwell time for each isotope. Following ablation, data was analyzed using MATLAB (Version R2016a) to produce 2D color maps of signal intensities of the selected isotopes. MATLAB code is available by requesting it from the corresponding author.
Statistics
Structural and chemical characterization results of NDG aggregates and Gd–C5–COOH report the average and standard deviation of a minimum of three independently synthesized batches. NMRD profiles were obtained for two independently synthesized batches of NDG and Gd–C5–COOH. Results of cell studies represent averages of three separate experiments, each in triplicate wells. A total of five mice were used for in vivo MRI, each bearing two tumors (NDG-labeled and unlabeled). This setup requires no randomization, and investigators were not blinded. MR and fluorescence images of a single representative mouse are shown. After the final imaging time point, three subjects were used for Gd(III) biodistribution analysis, while two subjects were used for histological analysis. All bar graphs indicate averages, and error bars represent standard deviations.
Supplementary Material
Acknowledgments
This work was supported the National Institutes of Health (NIH) Centers of Cancer Nanotechnology Excellence initiative of the National Cancer Institute under award no. U54CA151880, the NIH National Institute of Biomedical Imaging and Bioengineering under award no. R01EB005866, the National Science Foundation Biomaterials grant no. DMR-1105060, and the Rosenberg Cancer Foundation. Metal analysis was performed at the Northwestern University (NU) Quantitative Bioelemental Imaging Center, generously supported by NASA Ames Research Center grant no. NNA04CC36G. C.L. and G.P. acknowledge MIUR PRIN 2012SK7ASN, the European Commission, contracts BioMed-Bridges 284209 and pNMR 317127, and the EU ESFRI Instruct Core Centre CERM. DLS and ζ potential measurements were made at the Keck II Facility, while STEM and EDX spectroscopy was conducted at the EPIC facility, both part of the NUANCE Center at NU, which has received support from the Soft and Hybrid Nanotechnology Experimental (SHyNE) Resource (NSF NNCI-1542205); the MRSEC program (NSF DMR-1121262) at the Materials Research Center; the International Institute for Nanotechnology (IIN); the Keck Foundation; and the State of Illinois through the IIN. Animal models were developed by the NU Developmental Therapeutics Core through Dr. Irawati Kandela, imaging work was performed at the NU Center for Advanced Molecular Imaging by Dr. Chad Haney, and histology services were provided by the NU Mouse Histology and Phenotyping Laboratory through Dr. Lin Li. All of these core facilities are generously supported by NCI CCSG P30 CA060553 awarded to the Robert H Lurie Comprehensive Cancer Center.
Footnotes
Author Contributions
N.R., D.H., and T.J.M. designed experiments. N.R. and K.W.M. carried out all experiments except the following: L.K.M., L.M.M., L.M.L., and D.J.M. carried out some chemical syntheses. A.T.P. conducted TEM analyses. A.F. conducted cell uptake experiments. G.P. and C.L. performed NMRD experiments. N.R., D.H., and T.J.M. analyzed experimental results. N.R., G.P., C.L., D.H., and T.J.M. wrote the manuscript.
Notes
The authors declare no competing financial interest.
Supporting Information enclosed. The Supporting Information is available free of charge on the ACS Publications website at DOI: 10.1021/acs.nanolett.6b03378.
Figures showing experimental methods, spectral analysis results, Kaiser test results, DLS and ζ potentials, NMRD profiles, MRI and fluorescence results, ROI selection and T1 fitting, and Gd(III) content.(PDF)
References
- 1.Banerjee SR, Ngen EJ, Rotz MW, Kakkad S, Lisok A, Pracitto R, Pullambhatla M, Chen Z, Shah T, Artemov D, Meade TJ, Bhujwalla ZM, Pomper MG. Angew Chem, Int Ed. 2015;54(37):10778–82. doi: 10.1002/anie.201503417. [DOI] [PMC free article] [PubMed] [Google Scholar]
- 2.Heffern MC, Matosziuk LM, Meade TJ. Chem Rev. 2014;114(8):4496–539. doi: 10.1021/cr400477t. [DOI] [PMC free article] [PubMed] [Google Scholar]
- 3.Manus LM, Strauch RC, Hung AH, Eckermann AL, Meade TJ. Anal Chem. 2012;84(15):6278–87. doi: 10.1021/ac300527z. [DOI] [PMC free article] [PubMed] [Google Scholar]
- 4.Haris M, Yadav SK, Rizwan A, Singh A, Wang E, Hariharan H, Reddy R, Marincola FM. J Transl Med. 2015;13:313. doi: 10.1186/s12967-015-0659-x. [DOI] [PMC free article] [PubMed] [Google Scholar]
- 5.Nandwana V, De M, Chu S, Jaiswal M, Rotz M, Meade TJ, Dravid VP. Cancer Treat Res. 2015;166:51–83. doi: 10.1007/978-3-319-16555-4_3. [DOI] [PMC free article] [PubMed] [Google Scholar]
- 6.Harney AS, Meade TJ. Future Med Chem. 2010;2(3):503–19. doi: 10.4155/fmc.09.168. [DOI] [PMC free article] [PubMed] [Google Scholar]
- 7.Caravan P. Chem Soc Rev. 2006;35(6):512–23. doi: 10.1039/b510982p. [DOI] [PubMed] [Google Scholar]
- 8.Caravan P, Ellison JJ, McMurry TJ, Lauffer RB. Chem Rev. 1999;99(9):2293–352. doi: 10.1021/cr980440x. [DOI] [PubMed] [Google Scholar]
- 9.Helm L, Merbach AE, Tóth É. The Chemistry of Contrast Agents in Medical Magnetic Resonance Imaging. 2. John Wiley & Sons Inc; Hoboken, N.J: 2013. [Google Scholar]
- 10.Bulte JW. AJR, Am J Roentgenol. 2009;193(2):314–25. doi: 10.2214/AJR.09.3107. [DOI] [PMC free article] [PubMed] [Google Scholar]
- 11.Guenoun J, Koning GA, Doeswijk G, Bosman L, Wielopolski PA, Krestin GP, Bernsen MR. Cell transplantation. 2012;21(1):191–205. doi: 10.3727/096368911X593118. [DOI] [PubMed] [Google Scholar]
- 12.Rogers WJ, Meyer CH, Kramer CM. Nat Clin Pract Cardiovasc Med. 2006;3(10):554–62. doi: 10.1038/ncpcardio0659. [DOI] [PubMed] [Google Scholar]
- 13.Zhang F, Xie J, Liu G, He Y, Lu G, Chen X. Mol Imaging Biol. 2011;13(4):695–701. doi: 10.1007/s11307-010-0401-2. [DOI] [PMC free article] [PubMed] [Google Scholar]
- 14.Frangioni JV, Hajjar RJ. Circulation. 2004;110(21):3378–83. doi: 10.1161/01.CIR.0000149840.46523.FC. [DOI] [PubMed] [Google Scholar]
- 15.Hoshino K, Ly HQ, Frangioni JV, Hajjar RJ. Prog Cardiovasc Dis. 2007;49(6):414–20. doi: 10.1016/j.pcad.2007.02.005. [DOI] [PubMed] [Google Scholar]
- 16.Crich SG, Biancone L, Cantaluppi V, Duo D, Esposito G, Russo S, Camussi G, Aime S. Magn Reson Med. 2004;51(5):938–44. doi: 10.1002/mrm.20072. [DOI] [PubMed] [Google Scholar]
- 17.Juang JH, Wang JJ, Shen CR, Kuo CH, Chien YW, Kuo HY, Tsai ZT, Yen TC. Transplant Proc. 2010;42(6):2104–8. doi: 10.1016/j.transproceed.2010.05.103. [DOI] [PubMed] [Google Scholar]
- 18.Botsikas D, Terraz S, Vinet L, Lamprianou S, Becker CD, Bosco D, Meda P, Montet X. Islets. 2012;4(3):243–8. doi: 10.4161/isl.20857. [DOI] [PMC free article] [PubMed] [Google Scholar]
- 19.Lamprianou S, Immonen R, Nabuurs C, Gjinovci A, Vinet L, Montet XC, Gruetter R, Meda P. Diabetes. 2011;60(11):2853–60. doi: 10.2337/db11-0726. [DOI] [PMC free article] [PubMed] [Google Scholar]
- 20.Carney CE, Lenov IL, Baker CJ, MacRenaris KW, Eckermann AL, Sligar SG, Meade TJ. Bioconjugate Chem. 2015;26(5):899–905. doi: 10.1021/acs.bioconjchem.5b00107. [DOI] [PMC free article] [PubMed] [Google Scholar]
- 21.Hung AH, Holbrook RJ, Rotz MW, Glasscock CJ, Mansukhani ND, MacRenaris KW, Manus LM, Duch MC, Dam KT, Hersam MC, Meade TJ. ACS Nano. 2014;8(10):10168–77. doi: 10.1021/nn502986e. [DOI] [PMC free article] [PubMed] [Google Scholar]
- 22.Nicholls FJ, Rotz MW, Ghuman H, MacRenaris KW, Meade TJ, Modo M. Biomaterials. 2016;77:291–306. doi: 10.1016/j.biomaterials.2015.11.021. [DOI] [PMC free article] [PubMed] [Google Scholar]
- 23.Vistain LF, Rotz MW, Rathore R, Preslar AT, Meade TJ. Chem Commun. 2016;52(1):160–163. doi: 10.1039/c5cc06565h. [DOI] [PMC free article] [PubMed] [Google Scholar]
- 24.Ananta JS, Godin B, Sethi R, Moriggi L, Liu X, Serda RE, Krishnamurthy R, Muthupillai R, Bolskar RD, Helm L, Ferrari M, Wilson LJ, Decuzzi P. Nat Nanotechnol. 2010;5(11):815–21. doi: 10.1038/nnano.2010.203. [DOI] [PMC free article] [PubMed] [Google Scholar]
- 25.Matson ML, Wilson LJ. Future Med Chem. 2010;2(3):491–502. doi: 10.4155/fmc.10.3. [DOI] [PubMed] [Google Scholar]
- 26.Sitharaman B, Tran LA, Pham QP, Bolskar RD, Muthupillai R, Flamm SD, Mikos AG, Wilson LJ. Contrast Media Mol Imaging. 2007;2(3):139–46. doi: 10.1002/cmmi.140. [DOI] [PubMed] [Google Scholar]
- 27.Toth E, Bolskar RD, Borel A, Gonzalez G, Helm L, Merbach AE, Sitharaman B, Wilson LJ. J Am Chem Soc. 2005;127(2):799–805. doi: 10.1021/ja044688h. [DOI] [PubMed] [Google Scholar]
- 28.Ciofani G, Raffa V, Vittorio O, Cuschieri A, Pizzorusso T, Costa M, Bardi G. Methods Mol Biol. 2010;625:67–83. doi: 10.1007/978-1-60761-579-8_7. [DOI] [PubMed] [Google Scholar]
- 29.Mooney E, Dockery P, Greiser U, Murphy M, Barron V. Nano Lett. 2008;8(8):2137–43. doi: 10.1021/nl073300o. [DOI] [PubMed] [Google Scholar]
- 30.Mochalin VN, Shenderova O, Ho D, Gogotsi Y. Nat Nanotechnol. 2011;7(1):11–23. doi: 10.1038/nnano.2011.209. [DOI] [PubMed] [Google Scholar]
- 31.Chen M, Pierstorff ED, Lam R, Li SY, Huang H, Osawa E, Ho D. ACS Nano. 2009;3(7):2016–2022. doi: 10.1021/nn900480m. [DOI] [PubMed] [Google Scholar]
- 32.Chow EK, Zhang XQ, Chen M, Lam R, Robinson E, Huang H, Schaffer D, Osawa E, Goga A, Ho D. Sci Transl Med. 2011;3(73):73ra21. doi: 10.1126/scitranslmed.3001713. [DOI] [PubMed] [Google Scholar]
- 33.Man HB, Kim H, Kim HJ, Robinson E, Liu WK, Chow EK, Ho D. Nanomedicine. 2014;10(2):359–69. doi: 10.1016/j.nano.2013.07.014. [DOI] [PMC free article] [PubMed] [Google Scholar]
- 34.Moore L, Chow EK, Osawa E, Bishop JM, Ho D. Adv Mater. 2013;25:3502. doi: 10.1002/adma.201300343. [DOI] [PMC free article] [PubMed] [Google Scholar]
- 35.Moore L, Yang J, Lan TT, Osawa E, Lee DK, Johnson WD, Xi J, Chow EK, Ho D. ACS Nano. 2016;10:7385. doi: 10.1021/acsnano.6b00839. [DOI] [PubMed] [Google Scholar]
- 36.Puzyr AP, Baron AV, Purtov KV, Bortnikov EV, Skobelev NN, Mogilnaya OA, Bondar VS. Diamond Relat Mater. 2007;16(12):2124–2128. [Google Scholar]
- 37.Rej E, Gaebel T, Boele T, Waddington DE, Reilly DJ. Nat Commun. 2015;6:8459. doi: 10.1038/ncomms9459. [DOI] [PMC free article] [PubMed] [Google Scholar]
- 38.Purtov KV, Petunin AI, Burov AE, Puzyr AP, Bondar VS. Nanoscale Res Lett. 2010;5(3):631–636. doi: 10.1007/s11671-010-9526-0. [DOI] [PMC free article] [PubMed] [Google Scholar]
- 39.Manus LM, Mastarone DJ, Waters EA, Zhang XQ, Schultz-Sikma EA, Macrenaris KW, Ho D, Meade TJ. Nano Lett. 2010;10(2):484–9. doi: 10.1021/nl903264h. [DOI] [PMC free article] [PubMed] [Google Scholar]
- 40.Kruger A, Liang Y, Jarre G, Stegk J. J Mater Chem. 2006;16(24):2322–2328. [Google Scholar]
- 41.Jarre G, Heyer S, Memmel E, Meinhardt T, Krueger A. Beilstein J Org Chem. 2014;10:2729–37. doi: 10.3762/bjoc.10.288. [DOI] [PMC free article] [PubMed] [Google Scholar]
- 42.Caravan P, Farrar CT, Frullano L, Uppal R. Contrast Media Mol Imaging. 2009;4(2):89–100. doi: 10.1002/cmmi.267. [DOI] [PMC free article] [PubMed] [Google Scholar]
- 43.Bertini I, Kowalewski J, Luchinat C, Nilsson T, Parigi G. J Chem Phys. 1999;111(13):5795–5807. [Google Scholar]
- 44.Hung AH, Duch MC, Parigi G, Rotz MW, Manus LM, Mastarone DJ, Dam KT, Gits CC, Macrenaris KW, Luchinat C, Hersam MC, Meade TJ. J Phys Chem C. 2013;117(31) doi: 10.1021/jp406909b. [DOI] [PMC free article] [PubMed] [Google Scholar]
- 45.Rotz MW, Culver KS, Parigi G, MacRenaris KW, Luchinat C, Odom TW, Meade TJ. ACS Nano. 2015;9(3):3385–96. doi: 10.1021/nn5070953. [DOI] [PMC free article] [PubMed] [Google Scholar]
- 46.Bertini I, Galas O, Luchinat C, Messori L, Parigi G. J Phys Chem. 1995;99(39):14217–14222. [Google Scholar]
- 47.Preslar AT, Parigi G, McClendon MT, Sefick SS, Moyer TJ, Haney CR, Waters EA, MacRenaris KW, Luchinat C, Stupp SI, Meade TJ. ACS Nano. 2014;8(7):7325–32. doi: 10.1021/nn502393u. [DOI] [PMC free article] [PubMed] [Google Scholar]
- 48.Ma Q, Jebb M, Tweedle MF, Wilson LJ. J Mater Chem B. 2013;1(42):5791–5797. doi: 10.1039/c3tb20870b. [DOI] [PubMed] [Google Scholar]
- 49.Korobov MV, Avramenko NV, Bogachev AG, Rozhkova NN, Osawa E. J Phys Chem C. 2007;111(20):7330–7334. [Google Scholar]
- 50.Carney CE, MacRenaris KW, Mastarone DJ, Kasjanski DR, Hung AH, Meade TJ. Bioconjugate Chem. 2014;25(5):945–54. doi: 10.1021/bc500083t. [DOI] [PMC free article] [PubMed] [Google Scholar]
- 51.Harrison VS, Carney CE, MacRenaris KW, Waters EA, Meade TJ. J Am Chem Soc. 2015;137(28):9108–16. doi: 10.1021/jacs.5b04509. [DOI] [PMC free article] [PubMed] [Google Scholar]
- 52.Hassan AA, Chan BT, Tran LA, Hartman KB, Ananta JS, Mackeyev Y, Hu L, Pautler RG, Wilson LJ, Lee AV. Contrast Media Mol Imaging. 2010;5(1):34–8. doi: 10.1002/cmmi.293. [DOI] [PubMed] [Google Scholar]
- 53.Oudkerk M, Sijens PE, Van Beek EJ, Kuijpers TJ. Invest Radiol. 1995;30(2):75–8. doi: 10.1097/00004424-199502000-00002. [DOI] [PubMed] [Google Scholar]
- 54.Smart SK, Cassady AI, Lu GQ, Martin DJ. Carbon. 2006;44(6):1034–1047. [Google Scholar]
- 55.Christensen J, Vonwil D, Shastri VP. PLoS One. 2015;10(7):e0132725. doi: 10.1371/journal.pone.0132725. [DOI] [PMC free article] [PubMed] [Google Scholar]
- 56.Gao XCY, Levenson RM, Chung LW, Nie S, Cui Y. Nat Biotechnol. 2004;22(8):969. doi: 10.1038/nbt994. [DOI] [PubMed] [Google Scholar]
- 57.Kruger A, Liang YJ, Jarre G, Stegk J. J Mater Chem. 2006;16:2322. [Google Scholar]
- 58.Zhang XQ, Lam R, Xu X, Chow EK, Kim HJ, Ho D. Adv Mater. 2011;23:4770–4775. doi: 10.1002/adma.201102263. [DOI] [PubMed] [Google Scholar]
Associated Data
This section collects any data citations, data availability statements, or supplementary materials included in this article.