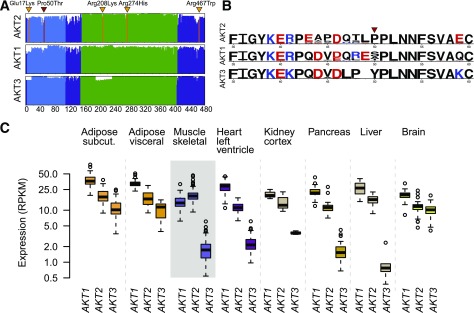
Figure 2.
Expression and conservation properties. A: Amino acid alignment and conservation of the three AKT proteins in vertebrates. The x-axis gives the amino acid position and the height of the lines shows the conservation score across 100 vertebrate genome alignments. The functional domains are the PH domain (blue) and the kinase domain (green). The position of AKT2 Pro50Thr is shown in red and the locations of the other AKT2 disease-causing mutations (37–40) are shown in orange: Glu17Lys, Arg208Lys, Arg274His, and Arg467Trp. B: WebLogo plots of amino acids 35–60 are shown for AKT2, AKT1, and AKT3, contrasting the homology of the three isoforms. The height of letters gives the relative frequency of different amino acids across the 100 vertebrate species, with the colors showing amino acids with similar charge. C: Expression of AKT1, AKT2, and AKT3 in eight insulin-sensitive tissues using RNA sequencing data from the GTEx Consortium. subcut., subcutaneous.

