Abstract
We investigated the mechanism of heterogeneous nuclear ribonucleoprotein F (hnRNP F) renoprotective action in a type 2 diabetes (T2D) mouse model (db/db). Immortalized rat renal proximal tubular cells (IRPTCs) and kidneys from humans with T2D were also studied. The db/db mice developed hyperglycemia, oxidative stress, and nephropathy at age 20 weeks compared with their db/m littermates. These abnormalities, with the exception of hyperglycemia, were attenuated in db/db hnRNP F–transgenic (Tg) mice specifically overexpressing hnRNP F in their RPTCs. Sirtuin-1, Foxo3α, and catalase expression were significantly decreased in RPTCs from db/db mice and normalized in db/db hnRNP F–Tg mice. In vitro, hnRNP F overexpression stimulated Sirtuin-1 and Foxo3α with downregulation of acetylated p53 expression and prevented downregulation of Sirtuin-1 and Foxo3α expression in IRPTCs by high glucose plus palmitate. Transfection of Sirtuin-1 small interfering RNA prevented hnRNP F stimulation of Foxo3α and downregulation of acetylated p53 expression. hnRNP F stimulated Sirtuin-1 transcription via hnRNP F–responsive element in the Sirtuin-1 promoter. Human T2D kidneys exhibited more RPTC apoptosis and lower expression of hnRNP F, SIRTUIN-1, and FOXO3α than nondiabetic kidneys. Our results demonstrate that hnRNP F protects kidneys against oxidative stress and nephropathy via stimulation of Sirtuin-1 expression and signaling in diabetes.
Introduction
Silent mating type information regulation 2 homolog 1 (Sirtuin-1 or NAD-dependent deacetylation sirtuin-1) is a member of the sirtuin family (Sirtuin 1-7) (1) and deacetylases proteins that contribute to cellular regulation of calorie restriction–related longevity. Sirtuin-1 activation protects multiple organs against oxidative stress, including the kidneys (2–6). Thus, glomerular injury was prevented in transgenic (Tg) mice specifically overexpressing Sirtuin-1 in renal proximal tubules (RPTs), whereas RPT-specific deletion of Sirtuin-1 aggravated glomerular damage in diabetes (7).
Hyperglycemia, hyperlipidemia, oxidative stress, and dysregulation of the renin-angiotensin system have been implicated in diabetic nephropathy progression. We reported previously that reactive oxygen species (ROS) generation mediates high glucose (HG) stimulation of angiotensinogen (Agt, the sole precursor of all angiotensins) expression in immortalized rat RPT cells (IRPTCs) in vitro (8,9), and hyperglycemia and Agt overexpression in RPTCs work in concert to induce hypertension, albuminuria, and RPTC apoptosis in diabetic Agt-Tg mice (10). Conversely, RPTC-selective catalase (Cat) overexpression attenuated ROS generation and Agt gene expression and curbed hypertension, tubulointerstitial fibrosis, and RPTC apoptosis in diabetic mice (11–14), demonstrating that oxidative stress and intrarenal renin-angiotensin system dysregulation play a crucial role in diabetic nephropathy progression.
We also reported that insulin inhibits HG-induced stimulation of Agt gene expression and IRPTC hypertrophy via a novel insulin-responsive element (IRE) in the rat Agt gene promoter that binds two nuclear proteins, heterogeneous nuclear ribonucleoprotein F (hnRNP F) and hnRNP K (15–17). Consistently, Akita (a type 1 diabetes model)-Tg mice specifically overexpressing hnRNP F in their RPTCs exhibited lower systolic blood pressure (SBP) and reduced renal hypertrophy and Agt expression (18). Finally, hnRNP F and hnRNP K mediated insulin inhibition of renal Agt expression in Akita mice, thereby preventing hypertension and kidney injury (19). These observations indicate that hnRNP F/K may play an important role in kidney protection in diabetes, but their underlying mechanism of action remains incompletely understood.
The aim of the current study was to investigate the underlying mechanism of hnRNP F action on kidney protection in db/db mice.
Research Design and Methods
Chemicals and Constructs
d-glucose, d-mannitol, and sodium palmitate were purchased from Sigma-Aldrich Canada Ltd. (Oakville, ON, Canada). Normal glucose (NG, 5 mmol/L) DMEM (catalog No. 12320), 100× penicillin/streptomycin, FBS, and expression vector pcDNA 3.1 were from Invitrogen, Inc. (Burlington, ON, Canada). The antibodies used in the current study are listed in Supplementary Table 1. pGL4.20 vector containing Luciferase reporter was obtained from Promega (Sunnyvale, CA). Rat Sirtuin-1 promoter (N-1,360/+84) was obtained from Dr. R. Wayne Alexander (Division of Cardiology, Emory University Hospital, Atlanta, GA). It was cloned from rat genomic DNA by PCR with specific primers (20) and then inserted into pGL4.20 plasmid at XhoI and HindIII restriction sites. QuickChange II Site-Directed Mutagenesis kits and LightShift Chemiluminescent EMSA kits were procured from Agilent Technologies (Santa Clara, CA) and Thermo Scientific (Life Technologies Inc., Burlington, ON, Canada), respectively. Primer biotin-labeling kits were supplied by Integrated DNA Technologies, Inc. (Coralville, IA). Oligonucleotides (Supplementary Table 2) were synthesized by Integrated DNA Technologies. Scrambled Silencer Negative Control small interfering (si)RNA (sc-37007) was obtained from Santa Cruz Biotechnology (Santa Cruz, CA), and rat Sirtuin-1 siRNAs (309757) was obtained from Dharmacon (Ottawa, ON, Canada). Restriction and modifying enzymes were sourced from Invitrogen, Roche Biochemicals, Inc. (Dorval, QC, Canada), and GE Healthcare Life Sciences (Baie d'Urfé, QC, Canada).
Generation of db/db hnRNP F–Tg Mice and Physiological Studies
Tg mice (C57Bl/6) overexpressing rat hnRNP F in RPTCs (line #937) were created in our laboratory (by J.S.D.C.) (18), with a kidney-specific androgen-regulated protein promoter responsive to testosterone (21). We cross-bred lean male db/m mice (C57BLKS) with female homozygous hnRNP F–Tg (C57Bl/6) mice, generating female db/m heterozygous hnRNP F–Tg mice, then backcrossed them with male db/m (C57BLKS) for at least 8 generations to obtain db/db homozygous hnRNP F–Tg mice (>95% in C57BLKS). Male db/db and db/db hnRNP F–Tg mice were tested at age 10 weeks. Age- and sex-matched db/m littermates served as controls. All animals received standard mouse chow and water ad libitum. Animal care and procedures were approved by the Centre de recherche, Centre hospitalier de l’Université de Montréal (CRCHUM) Animal Care Committee and followed the Principles of Laboratory Animal Care (National Institutes of Health Publication No. 85-23, revised 1985; http://grants1.nih.gov/grants/olaw/references/phspol.htm).
Blood glucose levels were measured by Accu-Chek Performa (Roche Diagnostics, Laval, QC, Canada) after 4 to 5 h of fasting. SBP was monitored in the morning with BP-2000 tail-cuff (Visitech Systems, Apex, NC), at least 2–3 times per week per animal, for 10 weeks (18,19,22). The mice were acclimatized to the procedure for at least 15–20 min per day for 5–7 days before the first SBP measurements.
All animals were housed individually in metabolic cages for 8 h during daytime before euthanasia at age 20 weeks. Body weight (BW) was recorded. Urine samples were collected and assayed for albumin and creatinine using the Albuwell and Creatinine Companion ELISA kits (Exocell, Inc., Philadelphia, PA). Immediately after euthanasia, the kidneys were removed, decapsulated, and weighed. Left kidneys were processed for histology and immunostaining and right kidneys for RPT isolation by Percoll gradient (18,19,22).
The glomerular filtration rate (GFR) was estimated with fluorescein isothiocyanate inulin, as recommended by the Animal Models of Diabetic Complications Consortium (http://www.diacomp.org/), with slight modifications (18,19,22).
Mouse urinary Agt, angiotensin II (Ang II), and Ang 1-7 levels were analyzed by ELISA (Immuno-Biological Laboratories, IBL America, Minneapolis, MN) and normalized by urinary creatinine levels (18,19,22).
Caspase-3 (Csp3) activity was assayed in frozen (−80°C) RPTs with Csp3 assay kits (BD Bioscience Pharmingen, Mississauga, ON, Canada) (23–25).
Immunohistochemical Staining
Immunohistochemical staining was undertaken according to the standard avidin-biotin-peroxidase complex method in four to five sections (4 μm thick) per kidney and six mouse kidneys per group (ABC Staining System; Santa Cruz Biotechnology). Staining was analyzed under light microscopy by two independent, blinded observers. Images were assessed by ImageJ software (National Institutes of Health, http://rsb.info.nih.gov/ij/) (22–25).
Tubular luminal area and mean glomerular and RPTC volumes were assessed, as described elsewhere (22–25).
Cell Culture
Rat IRPTCs (passages 13 through 18) were studied (26). Plasmids pcDNA 3.1 and pcDNA 3.1 containing rat hnRNP F cDNA were stably transfected into RPTCs (18). To study the effects of HG and free fatty acids (sodium palmitate), stable transformants at 75–85% confluency were synchronized overnight in serum-free DMEM containing 5 mmol/L d-glucose, then cultured in various concentrations of d-glucose or palmitate for various periods up to 24 h. In separate experiments, IRPTCs and IRPTC–pcDNA 3.1/hnRNP F were cultured in serum-free medium containing 5 mmol/L d-glucose plus 30 mmol/L d-mannitol (NG) or 35 mmol/L d-glucose (HG) DMEM in the absence or presence of 200 μmol/L palmitate-bound BSA for 24 h (27).
Real-time Quantitative PCR
The mRNA levels of various genes in RPTs were quantified by real-time quantitative (q)PCR with the forward and reverse primers listed in Supplementary Table 2 (22–25).
Western Blotting
Western blotting (WB) was performed, as required (22–25). Relative densities of hnRNP F, Cat, Nox4, Agt, ACE, Ace2, MasR, active Csp3 (A-Csp3), Bax, Bcl-2, Sirtuin-1, Foxo3α, Ac-p53, and β-actin bands were quantified by computerized laser densitometry using ImageQuant 5.1 software (Molecular Dynamics, Sunnyvale, CA).
Immunostaining of Kidney Biopsy Samples From Patients With and Without Diabetes
Eight kidney biopsy samples (paraffin sections) for immunostaining were obtained from the Centre hospitalier de l’Université de Montréal (CHUM) Department of Pathology. This study was approved by the CHUM Clinical Research Ethics Committee. All patients gave informed consent.
Statistical Analysis
Data are expressed as means ± SEM. Statistical analysis was performed with the Student t test or one-way ANOVA and the Bonferroni test, as appropriate, provided by GraphPad Prism 5.0 software (http://www.graphpad.com/prism/Prism.htm). P < 0.05 values were considered to be statistically significant.
Results
RPTC-Specific Expression of hnRNP F Transgene in db/db Tg Mouse Kidneys
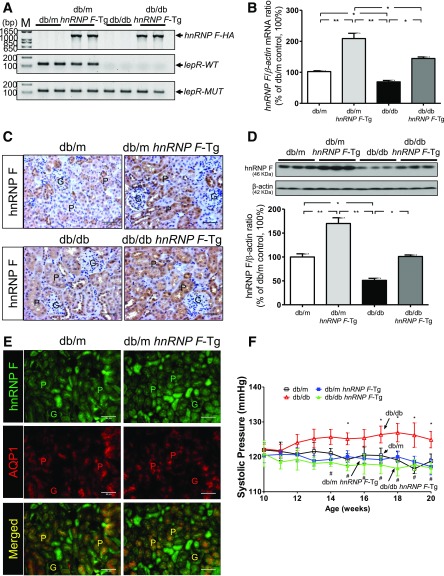
We confirmed the presence of hnRNP F–HA transgene in isolated RPTs from db/m hnRNP F–Tg and db/db hnRNP F–Tg mice but not in db/m and db/db mice (Fig. 1A). Wild-type (WT) leptin receptor (LepR) was expressed in RPTs of db/m and db/m hnRNP F–Tg mice but not in RPTs of db/db and db/db hnRNP F–Tg animals (Fig. 1A). Mutant LepR was detected in all groups (Fig. 1A). hnRNP F mRNA expression levels were markedly higher in RPTs from db/m hnRNP F–Tg and db/db hnRNP F–Tg mice than in db/m and db/db mice, respectively (Fig. 1B), consistent with changes in hnRNP F immunostaining (Fig. 1C) and WB (Fig. 1D). hnRNP F overexpression was RPTC-specific because it colocalized with aquaporin-1 (AQP1), a marker of RPTCs (Fig. 1E). Furthermore, hnRNP F overexpression normalized SBP in db/db hnRNP F–Tg mice (Fig. 1F).
Figure 1.
A: Generation of db/db hnRNP F–Tg mice. Genotyping of hnRNP F–HA transgene, WT, and mutated (MUT) LepR gene by specific PCR analysis. B: Real-time qPCR for hnRNP F mRNA levels in freshly isolated RPTs from db/m, db/m hnRNP F–Tg, db/db, and db/db hnRNP F–Tg mice. C: Immunohistochemical staining for hnRNP F expression in kidney sections (original magnification ×200). D: WB analysis of hnRNP F protein expression in RPT extracts of male db/m, db/m hnRNP F–Tg, db/db, and db/db hnRNP F–Tg mice. E: Colocalization of immunostaining of hnRNP F and AQP1 in male db/m and db/m hnRNP F–Tg mouse kidneys (original magnification ×200). Scale bars = 50 μm. G, glomerulus; P, proximal tubule. *P < 0.05; **P < 0.01. F: Longitudinal changes in mean SBP in male db/m (□), db/m hnRNP F–Tg (■), db/db (△), and db/db hnRNP F–Tg (▲) mice. Values are means ± SEM, n = 10 for each group. *P < 0.05 compared to db/m mice; #P < 0.05 compared to db/db mice.
Physiological Parameters in db/db and db/db hnRNP F–Tg Mice at Age 20 Weeks
Blood glucose levels were significantly higher in db/db than in db/m and db/m hnRNP F–Tg mice (Supplementary Table 3). hnRNP F overexpression in RPTCs did not affect blood glucose levels in db/db hnRNP F–Tg mice. SBP, BW, kidney weight, kidney weight–to–tibial length ratio, GFR, and albumin-to-creatinine ratio were all elevated in db/db compared with db/m or db/m hnRNP F–Tg mice. hnRNP F overexpression in RPTCs attenuated these changes, except for BW and GFR-to-BW, in diabetic db/db hnRNP F–Tg mice. Urinary Agt and Ang I levels were elevated in db/db mice, parallel with decreased Ang 1-7 levels compared with db/m mice. hnRNP F overexpression in db/db mice partially reduced urinary Agt and Ang II levels, whereas it completely normalized urinary Ang 1-7 levels.
hnRNP F Overexpression Attenuates Oxidative Stress in db/db Mouse Kidneys
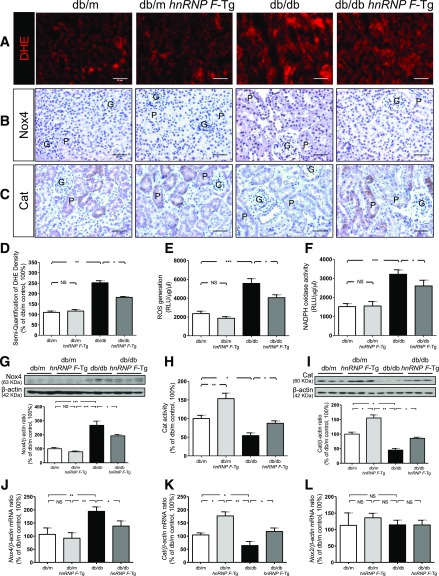
The db/db mice exhibited significantly more pronounced dihydroethidium (DHE) staining (Fig. 2A) and Nox4 immunostaining (Fig. 2B), with lower Cat immunostaining (Fig. 2C) than db/m and db/m hnRNP F–Tg mice. Quantitation of DHE staining (Fig. 2D), ROS generation (Fig. 2E), NADPH oxidase activity (Fig. 2F), and Nox4 protein expression (Fig. 2G) confirmed these observations. In contrast, Cat activity (Fig. 2H) and Cat protein expression (Fig. 2I) were significantly higher in db/m hnRNP F–Tg than in db/m mice but were decreased in db/db compared with db/m mice. hnRNP F overexpression reversed these changes. Consistent changes were observed in Nox4 and Cat mRNA expression (Fig. 2J and K). Neither Nox2 (Fig. 2L) nor Nox1 mRNA expression (data not shown) differed in any group.
Figure 2.
ROS generation, NADPH oxidase and Cat activity, and Nox4 and Cat expression in mouse RPTs at age 20 weeks. DHE (red) staining (A) and Nox4 (B) and Cat (C) immunostaining in kidney sections (original magnification ×200) from db/m, db/m hnRNP F–Tg, db/db, and db/db hnRNP F–Tg mice. G, glomerulus; P, proximal tubule. Scale bars = 50 μm. Semiquantification of DHE fluorescence (D), ROS production (E), NADPH oxidase activity (F), WB of Nox4 (G), Cat activity (H), WB of Cat (I), real-time qPCR of Nox4 mRNA (J), Cat mRNA (K), and Nox2 mRNA (L) in freshly isolated RPTs from db/m, db/m hnRNP F–Tg, db/db, and db/db hnRNP F–Tg mice. Values are means ± SEM, n = 6. *P < 0.05; **P < 0.01; ***P < 0.005; NS, not significant.
hnRNP F Overexpression Attenuates Tubulointerstitial Fibrosis and Profibrotic Gene Expression in db/db Mouse Kidneys
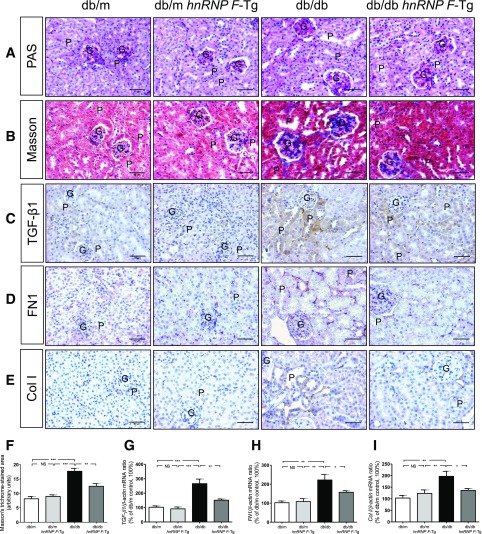
Periodic acid-Schiff staining (Fig. 3A) revealed enhanced extracellular matrix protein expression, tubular lumen dilation, and cell debris accumulation. Some RPTCs were flattened in db/db compared with db/m and db/m hnRNP F–Tg mice. hnRNP F overexpression in db/db hnRNP F–Tg mice markedly suppressed, although never completely prevented, these abnormalities (Fig. 3A). Glomerular tufts and RPTC volume were significantly higher in db/db than in db/m and db/m hnRNP F–Tg mice (Supplementary Table 3). hnRNP F overexpression partially reduced glomerular tuft volume and almost completely normalized RPTC volume in db/db hnRNP F–Tg mice.
Figure 3.
Tubulointerstitial fibrosis and profibrotic gene expression in mouse kidneys at age 20 weeks. Periodic acid-Schiff (PAS) staining (A), Masson’s trichrome staining (B), and TGF-β1 (C), FN1 (D), and Col I (E) immunostaining in kidney sections (original magnification ×200) from db/m, db/m hnRNP F–Tg, db/db, and db/db hnRNP F–Tg mice. G, glomerulus; P, proximal tubule. Scale bars = 50 μm. F: Quantitation of extracellular matrix component accumulation (Masson’s trichrome staining) in db/m, db/m hnRNP F–Tg, db/db, and db/db hnRNP F–Tg mouse kidneys. Real-time qPCR of TGF-β1 (G), FN1 (H), and Col I (I) mRNA in freshly isolated RPTs from db/m, db/m hnRNP F–Tg, db/db, and db/db hnRNP F–Tg mice. Values are means ± SEM, n = 6. *P < 0.05; **P < 0.01; ***P < 0.005. NS, not significant.
Kidneys from db/db mice exhibited significantly higher levels of collagenous components (Masson’s trichrome staining), transforming growth factor (TGF)-β1, fibronectin 1 (FN1), and collagen 1 (Col I) expression (Fig. 3B–E, respectively) relative to db/m and db/m hnRNP F–Tg mice. hnRNP F overexpression markedly reduced tubulointerstitial fibrosis in db/db mice (Fig. 3B–E). Quantitative analysis of Masson’s trichrome staining (Fig. 3F) and qPCR quantitation of TGF-β1, FN1, and Col I (Fig. 3G–I, respectively) mRNA expression confirmed these findings.
hnRNP F Overexpression Prevents Tubular Apoptosis in db/db Mouse Kidneys
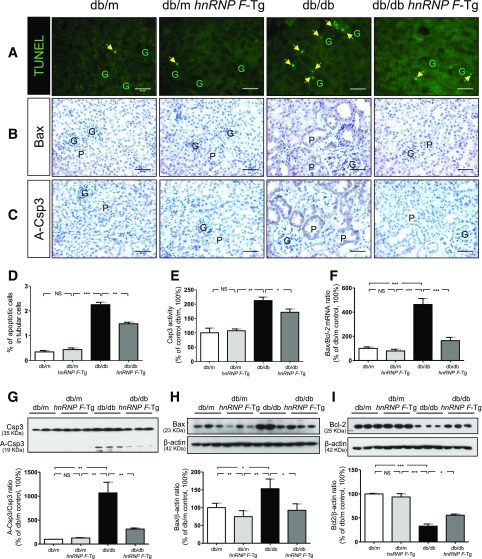
Next, we investigated the effect of hnRNP F overexpression on tubular apoptosis in db/db mice. The number of TUNEL-positive nuclei in RPTCs from db/db mice was significantly higher than in db/m and db/m hnRNP F–Tg mice (Fig. 4A). hnRNP F overexpression significantly reduced the number of TUNEL-positive cells. Consistently, immunostaining for B-cell lymphoma 2 (Bcl-2)– associated protein X (Bax) (Fig. 4B) and A-Csp3 or cleaved Csp3 (Fig. 4C) was significantly stronger in db/db versus db/m and db/m hnRNP F–Tg mice. hnRNP F overexpression also attenuated Bax and A-Csp3 expression (Fig. 4B and C). Assessment of TUNEL-positive cells (Fig. 4D) and A-Csp3 activity (Fig. 4E) in isolated RPTs confirmed these findings. Furthermore, Bax/Bcl-2 mRNA expression was higher in db/db than in db/m and db/m hnRNP F–Tg mice and was reversed in db/db hnRNP F–Tg mice (Fig. 4F). WB of A-Csp3, Bax, and Bcl-2 (Fig. 4G–I, respectively) confirmed these findings.
Figure 4.
Apoptosis in mouse kidneys at age 20 weeks. A: TUNEL (green fluorescence). Original magnification ×200. The arrowheads indicate apoptotic cells in the proximal tubules (P). Immunostaining of Bax (B) and A-Csp3 (C) in kidney sections from db/m, db/m hnRNP F–Tg, db/db, and db/db hnRNP F–Tg mice. G, glomerulus. Scale bars = 50 μm. Semiquantitation of apoptotic RPTCs in mouse kidneys (D), Csp3 activity (E), real-time qPCR of Bax/Bcl-2 mRNA ratio (F), and WB of Csp3 and A-Csp3 (G), Bax (H), and Bcl-2 (I) in freshly isolated RPTs from db/m, db/m hnRNP F–Tg, db/db, and db/db hnRNP F–Tg mice. Values are means ± SEM, n = 6. *P < 0.05; **P < 0.01; ***P < 0.005. NS, not significant.
hnRNP F Overexpression Stimulates Sirtuin-1 and Foxo3α and Inhibits Acetylated p53 Expression in db/db Mouse Kidneys
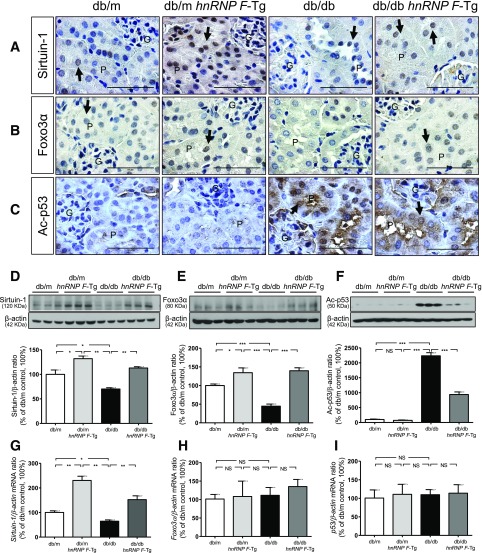
To investigate the mechanism of hnRNP F action on tubulointerstitial fibrosis and apoptosis in db/db mice, we explored the expression of Sirtuin-1 and its downstream target proteins, Foxo3α and acetylated (Ac)-p53. Sirtuin-1 and Foxo3α expression was significantly decreased in RPTCs of db/db compared with db/m and db/m hnRNP F–Tg mice (Fig. 5A and B). hnRNP F overexpression increased Sirtuin-1 and Foxo3α immunostaining in RPTCs from db/m hnRNP F–Tg and db/db hnRNP F–Tg compared with db/m and db/db mice. In contrast, Ac-p53 immunostaining was stronger in RPTCs from db/db versus db/m and db/m hnRNP F–Tg mice (Fig. 5C). hnRNP F overexpression attenuated Ac-p53 expression in RPTCs. Quantitation of Sirtuin-1, Foxo3α, and Ac-p53 (Fig. 5D–F, respectively) expression by WB confirmed these findings. hnRNP F overexpression stimulated Sirtuin-1 mRNA expression in db/m hnRNP F–Tg and db/db hnRNP F–Tg compared with db/m and db/db mice, respectively (Fig. 5G). No differences were detected in Foxo3α and p53 mRNA expression (Fig. 5H and I).
Figure 5.
Sirtuin-1, Foxo3α, and Ac-p53 expression in mouse kidneys at age 20 weeks. Immunohistochemical staining of Sirtuin-1 (A), Foxo3α (B), and Ac-p53 (C) in kidney sections from db/m, db/m hnRNP F–Tg, db/db, and db/db hnRNP F–Tg mice. Original magnification ×600. G, glomerulus; P, proximal tubule. The arrows indicate the immunostained nuclei. Scale bars = 50 μm. WB of Sirtuin-1 (D), Foxo3α (E), and Ac-p53 (F). Real-time qPCR of mRNA for Sirtuin-1 (G), Foxo3α (H), and p53 (I) in freshly isolated RPTs from db/m, db/m hnRNP F–Tg, db/db, and db/db hnRNP F–Tg mice. Values are means ± SEM, n = 6. *P < 0.05; **P < 0.01; ***P < 0.005. NS, not significant.
hnRNP F Overexpression Stimulates Sirtuin-1 and Prevents Downregulation of Sirtuin-1 Expression by HG and Palmitate in Rat IRPTCs In Vitro
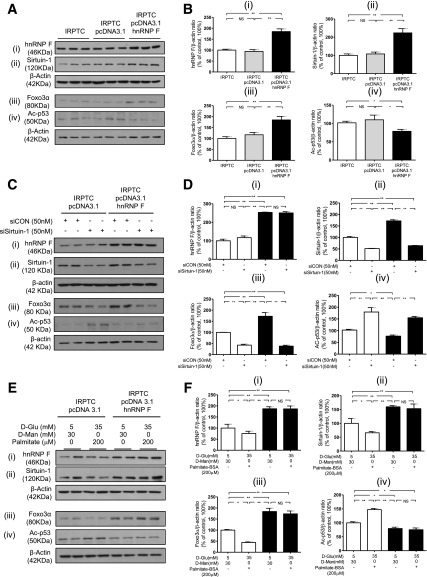
To validate our findings in vivo, IRPTCs were stably transfected with hnRNP F cDNA and cultured in NG medium. IRPTCs stably transfected with pcDNA 3.1/hnRNP F (designated as IRPTC–pcDNA 3.1/hnRNP F) exhibited considerably higher levels of hnRNP F (Fig. 6Ai and Bi), Sirtuin-1 (Fig. 6Aii and Bii), and Foxo3α (Fig. 6Aiii and Biii), but lower levels of Ac-p53 (Fig. 6Aiv and Biv) compared with nontransfected IRPTCs or IRPTCs stably transfected with pcDNA 3.1 (designated as IRPTC–pcDNA 3.1). Real-time qPCR of hnRNP F, Sirtuin-1, Foxo3α, and p53 mRNA levels revealed that hnRNP F overexpression stimulated Sirtuin-1 but not Foxo3α and p53 mRNA expression compared with nontransfected IRPTCs and IRPTC–pcDNA 3.1 (Supplementary Fig. 1).
Figure 6.
hnRNP F overexpression stimulates Sirtuin-1 expression in IRPTCs. A: WB of hnRNP F (i), Sirtuin-1 (ii), Foxo3α (iii), and Ac-p53 (iv). B: Immunoblotting analysis of hnRNP F (i), Sirtuin-1 (ii), Foxo3α (iii), and Ac-p53 (iv) in naïve IRPTCs, IRPTC–pcDNA 3.1, or IRPTC–pcDNA 3.1/hnRNP F stable transformants after 24-h culture. C: WB of hnRNP F (i), Sirtuin-1 (ii), Foxo3α (iii), and Ac-p53 (iv) in IRPTC–pcDNA 3.1 and IRPTC–pcDNA 3.1/hnRNP F transfected with control (CON) siRNA or Sirtuin-1 siRNA. D: Quantitation of hnRNP F (i), Sirtuin-1 (ii), Foxo3α (iii), and Ac-p53 (iv) after 24-h culture in NG medium. E: WB of hnRNP F (i), Sirtuin-1 (ii), Foxo3α (iii), and Ac-p53 (iv). F: Quantitation of hnRNP F (i), Sirtuin-1 (ii), Foxo3α (iii), and Ac-p53 (iv) in IRPTC–pcDNA 3.1 and IRPTC–pcDNA 3.1/hnRNP F after 24-h culture with or without HG/palmitate. Values, corrected to β-actin protein levels, are means ± SEM, n = 3. The experiments were repeated twice. *P < 0.05; **P < 0.01. NS, not significant.
Next, we investigated whether knockdown of Sirtuin-1 could prevent hnRNP F effect on Foxo3α and Ac-p53 expression. Transfection with Sirtuin-1 siRNA had no effect on hnRNP F expression (Fig. 6Ci and Di) but reduced endogenous Sirtuin-1 protein expression, whereas scrambled siRNA had no effect (Fig. 6Cii and Dii and Supplementary Fig. 2A). Transfection with Sirtuin-1 siRNA attenuated hnRNP F stimulation of Foxo3α (Fig. 6Ciii and Diii) and hnRNP F inhibition of Ac-p53 (Fig. 6Civ and Div) expression in IRPTC–pcDNA 3.1/hnRNP F.
To explore whether HG and free fatty acids affect Sirtuin-1 expression, IRPTCs were cultured in the absence or presence of d-glucose or palmitate or a combination of HG and palmitate. d-glucose and palmitate alone inhibited Sirtuin-1 expression in a concentration-dependent manner (Supplementary Fig. 2B and C), and their combination was more effective in suppressing Sirtuin-1 expression in nontransfected IRPTCs (Supplementary Fig. 2D). HG and palmitate were also effective in inhibiting hnRNP F (Fig. 6Ei and Fi), Sirtuin-1 (Fig. 6Eii and Fii), and Foxo3α (Fig. 6Eiii and Fiii) expression and augmenting Ac-p53 (Fig. 6Eiv and Fiv) expression in IRPTC–pcDNA 3.1, but these changes were prevented in IRPTC–pcDNA 3.1/hnRNP F.
hnRNP F–RE Localization in Rat Sirtuin-1 Gene Promoter
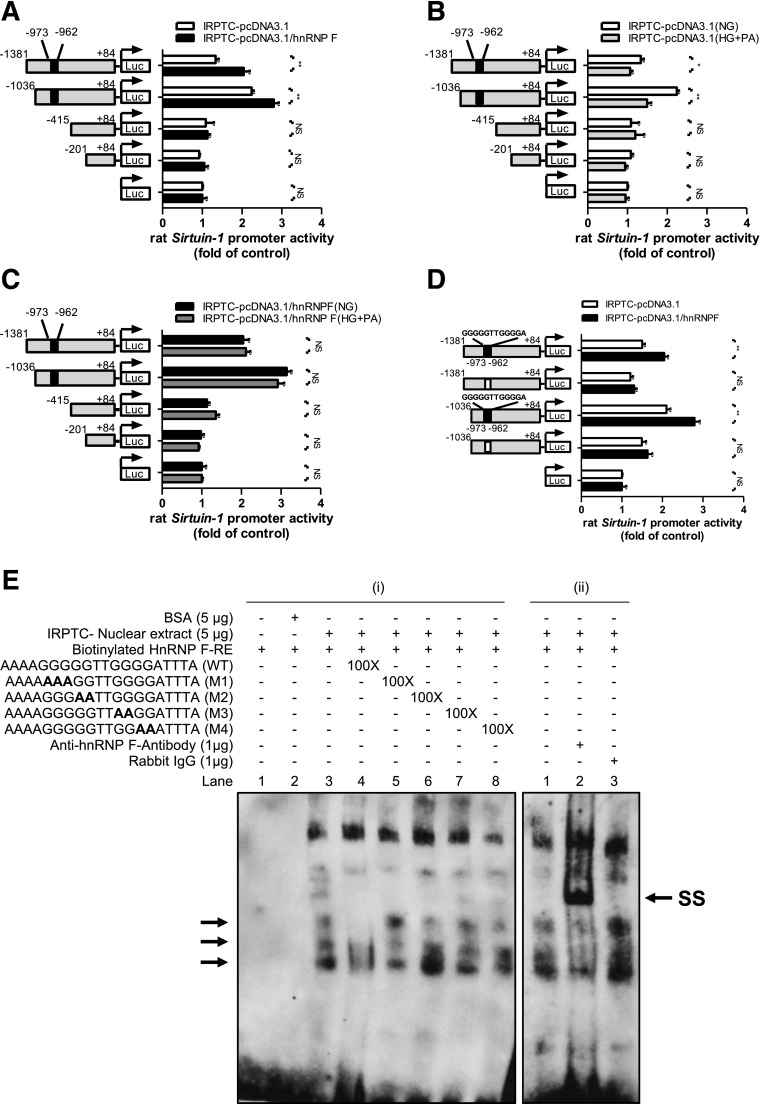
To localize putative hnRNP F–RE that mediates the action of hnRNP F on Sirtuin-1 gene promoter activity, pGL4.20 plasmid containing various lengths of the rat Sirtuin-1 promoter were transiently transfected into IRPTC–pcDNA 3.1 or IRPTC–pcDNA 3.1/HnRNP F and cultured in NG medium. pGL4.20–Sirtuin-1 promoter (N-1,381/+84) and pGL4.20–Sirtuin-1 promoter (N-1,036/+84) activity respectively exhibited 1.5-fold and 2.5-fold increases compared with control plasmid pGL4.20 in IRPTC–pcDNA 3.1 (Fig. 7A). Deletion of nucleotides N-1,036 to N-415 or N-201 (pGL4.20–Sirtuin-1 promoter [N-415/+84] and pGL4.20–Sirtuin-1 promoter [N-201/+84], respectively) reduced the Sirtuin-1 promoter activity to baseline as pGL4.20 vector. Interestingly, pGL4.20–Sirtuin-1 promoter (N-1,381/+84) and pGL4.20–Sirtuin-1 promoter (N-1,036/+84) activity was further increased by 1.5- to 2.0-fold in IRPTC–pcDNA 3.1/hnRNP F, whereas the promoter activity of other fusion genes did not increase in IRPTC–pcDNA 3.1/hnRNP F compared with IRPTC–pcDNA 3.1 (Fig. 7A). HG plus palmitate inhibited pGL4.20–Sirtuin-1 promoter (N-1,381/+84) and pGL4.20–Sirtuin-1 promoter (N-1,036/+84) activity without affecting other fusion genes in IRPTC–pcDNA 3.1 (Fig. 7B). Moreover, hnRNP F overexpression prevented the inhibitory effect of HG plus palmitate (Fig. 7C).
Figure 7.
Identification of hnRNP F–RE in the Sirtuin-1 gene promoter. A: Luciferase (Luc) activity of plasmids containing various lengths of the Sirtuin-1 gene promoter in IRPTC–pcDNA 3.1 or IRPTC–pcDNA 3.1/hnRNP F after 24-h culture in NG medium. Luciferase activities were normalized by cotransfecting the pRC/RSV vector containing β-galactosidase cDNA. B: Luciferase activity of plasmids containing various lengths of the Sirtuin-1 gene promoter in IRPTC–pcDNA 3.1 after 24-h culture in NG or HG/palmitate. C: Luciferase activity of plasmids containing various lengths of Sirtuin-1 gene promoter in IRPTC–pcDNA 3.1/hnRNP F after 24-h culture in NG or HG/palmitate. D: pGL4.20–Sirtuin-1 promoter (N-1,381/+84) and pGL4.20–Sirtuin-1 promoter (N-1,036/+84) activity, with or without deletion of hnRNP F–RE (N-973 to N-962; 5′-GGGGGTTGGGGA-3′), in IRPTC–pcDNA 3.1 or IRPTC–pcDNA 3.1/hnRNP F after 24-h culture in NG medium. Values are means ± SEM, n = 3. All experiments were repeated twice. *P < 0.05; **P < 0.01. NS, not significant. E: (i) EMSA of putative biotinylated hnRNP F–RE with IRPTC nuclear proteins with or without excess unlabeled WT hnRNP F–RE or mutated hnRNP F–RE and (ii) supershift EMSA with anti-hnRNP F or rabbit IgG. Rabbit anti-hnRNP F or rabbit IgG was added to the reaction mixture and incubated for 30 min on ice before incubation with the biotinylated probe. The results are representative of three independent experiments. SS, supershift band.
Transient transfection of hnRNP F cDNA stimulated pGL4.20–Sirtuin-1 promoter (N-1,081/+84) and pGL4.20–Sirtuin-1 promoter (N-1,036/+84) activity by 1.5- to 2.0-fold, whereas deletion of nucleotides N-973 to N-962 (5′-GGGGGTTGGGGA-3′) in the Sirtuin-1 gene promoter prevented the stimulatory effect of hnRNP F (Fig. 7D).
Electrophoretic mobility shift assay (EMSA) revealed that the double-strand DNA fragment nucleotides N-977 to N-958 (putative hnRNP F–RE) bind to nuclear proteins from IRPTCs, which can be displaced by respective WT DNA but not by mutated DNA fragments (Fig. 7Ei). The addition of anti-hnRNP F antibody induced hnRNP F–RE supershift with nuclear proteins but not by rabbit IgG (Fig. 7Eii).
AGT, hnRNP F, SIRTUIN-1, FOXO3α, and Ac-p53 Expression in Diabetic Human Kidneys
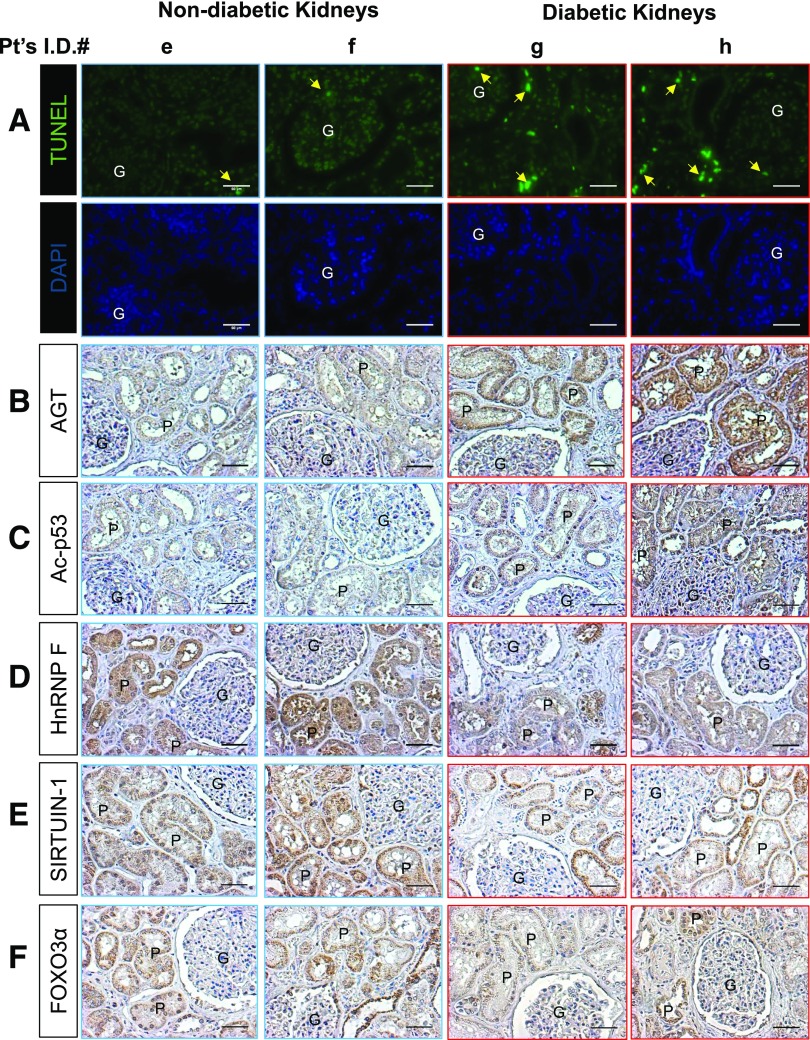
The clinical characteristics of eight patients (four without type 2 diabetes [T2D] and four with T2D) are summarized in Supplementary Tables 4 and 5. All patients underwent nephrectomy due to kidney cancer. The number of TUNEL-positive nuclei in RPTCs from apparently healthy sections of nephrectomy specimens from patients with T2D was significantly higher than those in patients without T2D (Fig. 8A). Immunohistochemical staining for AGT and Ac-p53 was higher in diabetic than in nondiabetic human kidneys (Fig. 8B and C and Supplementary Fig. 4B and C). Decreased immunostaining for hnRNP F, SIRTUIN-1, and FOXO3α was detected in RPTCs from patients with T2D compared with RPTCs from patients without T2D (Fig. 8D–F and Supplementary Fig. 4D–F). These observations are consistent with the changes observed in RPTCs of db/db mice.
Figure 8.
Apoptosis and gene expression in human kidneys from patients with or without diabetes. A: TUNEL assay and DAPI staining. The arrows indicate cells that stained positive for TUNEL. Immunostaining of AGT (B), Ac-p53 (C), hnRNP F (D), SIRTUIN-1 (E), and FOXO3α (F) in kidney sections from two representative cancer patients without diabetes (e and f, patients with clear cell carcinoma) and two representative cancer patients with diabetes (g, patient with clear cell carcinoma; h, patient with oncocytoma). Original magnification ×200. P, proximal tubule; G, glomerulus. Scale bars = 50 μm.
Discussion
The present report identifies a novel mechanism of hnRNP F action on kidney protection via stimulation of RPTC Sirtuin-1 gene transcription in diabetic db/db mice.
We reported previously that hnRNP F overexpression in RPTCs attenuates systemic hypertension and RPTC hypertrophy in Akita mice, inhibits RPTC Agt, and stimulates Ace2 transcription via binding to hnRNP F–RE in Agt and Ace2 promoters, respectively (15,16,19,22). Our present study shows a novel finding that hnRNP F stimulates Sirtuin-1 transcription via binding of hnRNP F to the hnRNP F–RE in the Sirtuin-1 promoter, which, in turn, augments Foxo3α and Cat, decreases Ac-p53 expression, and subsequently attenuates RPTC oxidative stress, tubulointerstitial fibrosis, and apoptosis in db/db mice.
hnRNP F, a member of the premRNA-binding protein family (28), regulates gene expression at transcriptional and posttranscriptional levels. hnRNP F engages in alternative splicing of various genes (29,30) and associates with TATA-binding protein, RNA polymerase II, nuclear cap–binding protein complex, and various transcription factors (31,32). The molecular mechanisms underlying hnRNP F regulation of gene transcription are still incompletely understood.
The db/db mouse (LepRdb/db) on a C57BLKS background (33,34) is a useful animal model to investigate many features of T2D in humans, including albuminuria, kidney injury, obesity, blood glucose, insulin resistance, and β-cell failure.
Our data show that hnRNP F overexpression in RPTCs from db/db hnRNP F–Tg mice exhibited lower oxidative stress, SBP, and albuminuria compared with db/db mice. However, the underlying molecular mechanisms remain to be investigated. One possibility is that hnRNP F decreases intrarenal Ang II formation via inhibition of Agt expression and, therefore, prevents Ang II stimulation of NADPH oxidase activity, Nox4 expression, and oxidative stress. This possibility is supported by our previous observations (18,22) and the current results that hnRNP F overexpression inhibited Agt and upregulated Ace2 and MasR expression in RPTCs from db/db hnRNP F–Tg mice (Supplementary Fig. 3) while lowering urinary Agt and Ang II and increasing urinary Ang 1-7. Thus, decreasing the intrarenal Ang II–to–Ang 1-7 ratio would lessen efferent constriction and subsequently reduce SBP and albuminuria. Another possibility is that hnRNP F stimulates Cat expression via enhanced Sirtuin-1 and Foxo3α expression, leading to decreased ROS generation (35). Thus, reduction of oxidative stress would decrease Agt/Ang II expression and reduce SBP and urinary albumin secretion as well as inhibit RPTC apoptosis, as we previously reported (11). This possibility is supported by elevated Foxo3α expression and increased Cat expression in db/db hnRNP F–Tg compared with db/db mice. Clearly, additional studies are needed to elucidate the molecular mechanisms by which hnRNP F reduced oxidative stress, SBP, and albuminuria in diabetes.
Our study clearly demonstrates that hnRNP F overexpression attenuates tubulointerstitial fibrosis and RPTC apoptosis in db/db mice. Although the molecular mechanisms of hnRNP F action have not been fully elucidated, reduced fibrosis and RPTC apoptosis can at least partly be explained by suppression of profibrotic and proapoptotic gene expression in RPTCs. Indeed, hnRNP F overexpression suppressed TGF-β1, FN1, and Col I expression and downregulated Bax and A-Csp3 expression in db/db hnRNP F–Tg compared with db/db mice. Furthermore, Sirtuin-1 and Foxo3α were suppressed and Ac-p53 expression was enhanced in the RPTCs of db/db mice and normalized by hnRNP F overexpression in db/db hnRNP F–Tg mice. These would indicate that the beneficial actions of hnRNP F in db/db mice are partly mediated via enhanced Sirtuin-1 expression, with subsequent increases in Foxo3α and decreases in Ac-p53 expression.
To demonstrate that hnRNP F can directly stimulate Sirtuin-1 expression and subsequently modulate its downstream targets, we stably overexpressed hnRNP F in IRPTCs. hnRNP F overexpression resulted in increased Sirtuin-1 mRNA and protein expression and elevated Foxo3α and downregulated Ac-p53 protein levels without affecting their mRNA expression. We also observed that knockdown of Sirtuin-1 by siRNA prevented hnRNP F stimulation of Foxo3α and inhibition of Ac-p53 expression in IRPTCs. These findings clearly indicate an involvement of Sirtuin-1 in mediating hnRNP F stimulation of Foxo3α and inhibition of Ac-p53 expression in diabetic mouse kidney. Furthermore, hnRNP F overexpression prevented HG plus palmitate-evoked changes of Sirtuin-1, Foxo3, and Ac-p53 expression. These findings would indicate that hnRNP F overexpression prevented not only HG-evoked oxidative stress but also palmitate-induced oxidative stress in RPTCs via stimulation of Sirtuin-1 expression with subsequent Cat upregulation and Nox4 downregulation. Finally, we found that knockdown with hnRNP F siRNA reduced Sirtuin-1 expression without affecting Foxo3α and p53 expression and increased Agt expression and oxidative stress but not cell proliferation or hnRNP K expression in IRPTCs in NG (Supplementary Fig. 5). These data would link hnRNP F, oxidative stress, and Sirtuin-1 expression in RPTCs. Nevertheless, additional studies using RPTC-specific hnRNP F knockout mice are needed to firmly establish the action of hnRNP F.
The precise mechanism by which hnRNP F upregulates Sirtuin-1 expression remains unclear. One possibility is that hnRNP F binds to putative hnRNP F–RE in the Sirtuin-1 promoter, subsequently enhancing Sirtuin-1 transcription. Indeed, we found that hnRNP F overexpression considerably augmented Sirtuin-1 promoter activity and that deletion of putative hnRNP F–RE (N-973 to N-962; 5′-GGGGGTTGGGGA-3′) markedly reduced the Sirtuin-1 promoter activity in IRPTCs. Furthermore, biotinylated-labeled hnRNP F–RE specifically bound to IRPTC nuclear proteins, and the addition of anti-hnRNP F antibody yielded supershift of biotinylated-labeled hnRNP F–RE binding with nuclear proteins on EMSA. Notably, hnRNP F is not specific to Sirtuin-1, and it also affects the expression of Agt (16), Ace2 (22), and other genes (36,37).
Our results may have clinical implications. Because tubulointerstitial fibrosis and tubular apoptosis are characteristic features of human diabetic kidneys (38,39) and tubular atrophy appears to be a better indicator of disease progression than glomerular pathology (40–42), we suggest that RPTC apoptosis may be an initial event leading to tubular atrophy. Our data from human kidneys imply downregulation of hnRNP F and SIRTUIN-1 expression as a trigger for apoptosis in the diabetic kidney. Whether enhanced hnRNP F expression directly or indirectly reduces tubulointerstitial fibrosis and RPTC apoptosis in human diabetes remains to be investigated.
In summary, the current study reveals an important and novel role for hnRNP F in preventing oxidative stress, tubulointerstitial fibrosis, and RPTC apoptosis in diabetic mice and likely in human kidneys via stimulation of Sirtuin-1 gene transcription. Our observations raise the possibility that selective targeting of hnRNP F may be a novel approach to preventing or reversing the manifestations of nephropathy in diabetes.
Supplementary Material
Article Information
Acknowledgments. The authors thank Dr. R. Wayne Alexander (Division of Cardiology, Emory University Hospital, Atlanta, GA) for the rat Sirtuin-1 gene promoter.
Funding. C.-S.L. was the recipient of a fellowship from the Montreal Diabetes Research Centre of the CRCHUM. This work was supported, in part, by grants from the Canadian Institutes of Health Research (MOP-97742 to J.G.F., MOP-86450 to S.-L.Z., and MOP-93650, MOP-106688 and MOP-84363 to J.S.D.C.), the U.S. National Institutes of Health (HL-48455 to J.R.I.), the Kidney Foundation of Canada (KFOC120008 to J.S.D.C.), and the Canadian Diabetes Association (NOD_OG-3-14-4472-JC to J.S.D.C.). Editorial assistance was provided by the CRCHUM Research Support Office and Ovid M. Da Silva (irtc.inc@hotmail.com).
Duality of Interest. No potential conflicts of interest relevant to this article were reported.
Author Contributions. C.-S.L. contributed to data research and discussion and drafted the manuscript. Y.S., I.C., A.G., C.-H.W., J.F.C., J.E., and J.-B.L. contributed to the in vivo and in vitro experiments and data collection. J.G.F. and J.R.I. contributed to the discussion and reviewed and edited the manuscript. S.-L.Z. and J.S.D.C. were the principal investigators and were responsible for study conception and design. All authors approved the final version for publication. S.-L.Z. and J.S.D.C. are the guarantors of this work and, as such, had full access to all the data in the study and take responsibility for the integrity of the data and the accuracy of the data analysis.
Prior Presentation. Parts of this study were presented as a poster at the American Society of Nephrology–ASN Kidney Week 2015, San Diego, CA, 3–8 November 2015.
Footnotes
This article contains Supplementary Data online at http://diabetes.diabetesjournals.org/lookup/suppl/doi:10.2337/db16-1588/-/DC1.
S.-L.Z. and J.S.D.C. are joint senior authors.
References
- 1.Michishita E, Park JY, Burneskis JM, Barrett JC, Horikawa I. Evolutionarily conserved and nonconserved cellular localizations and functions of human SIRT proteins. Mol Biol Cell 2005;16:4623–4635 [DOI] [PMC free article] [PubMed] [Google Scholar]
- 2.Elbe H, Vardi N, Esrefoglu M, Ates B, Yologlu S, Taskapan C. Amelioration of streptozotocin-induced diabetic nephropathy by melatonin, quercetin, and resveratrol in rats. Hum Exp Toxicol 2015;34:100–113 [DOI] [PubMed] [Google Scholar]
- 3.Gao R, Chen J, Hu Y, et al. . Sirt1 deletion leads to enhanced inflammation and aggravates endotoxin-induced acute kidney injury. PLoS One 2014;9:e98909. [DOI] [PMC free article] [PubMed] [Google Scholar]
- 4.Huang K, Huang J, Xie X, et al. . Sirt1 resists advanced glycation end products-induced expressions of fibronectin and TGF-β1 by activating the Nrf2/ARE pathway in glomerular mesangial cells. Free Radic Biol Med 2013;65:528–540 [DOI] [PubMed] [Google Scholar]
- 5.Wen D, Huang X, Zhang M, et al. . Resveratrol attenuates diabetic nephropathy via modulating angiogenesis. PLoS One 2013;8:e82336. [DOI] [PMC free article] [PubMed] [Google Scholar]
- 6.Xu F, Wang Y, Cui W, et al. Resveratrol prevention of diabetic nephropathy is associated with the suppression of renal inflammation and mesangial cell proliferation: possible roles of Akt/NF-kappaB pathway. Int J Endocrinol 2014;2014:289327 [DOI] [PMC free article] [PubMed]
- 7.Hasegawa K, Wakino S, Simic P, et al. . Renal tubular Sirt1 attenuates diabetic albuminuria by epigenetically suppressing Claudin-1 overexpression in podocytes. Nat Med 2013;19:1496–1504 [DOI] [PMC free article] [PubMed] [Google Scholar]
- 8.Hsieh TJ, Fustier P, Zhang SL, et al. . High glucose stimulates angiotensinogen gene expression and cell hypertrophy via activation of the hexosamine biosynthesis pathway in rat kidney proximal tubular cells. Endocrinology 2003;144:4338–4349 [DOI] [PubMed] [Google Scholar]
- 9.Hsieh TJ, Zhang SL, Filep JG, Tang SS, Ingelfinger JR, Chan JS. High glucose stimulates angiotensinogen gene expression via reactive oxygen species generation in rat kidney proximal tubular cells. Endocrinology 2002;143:2975–2985 [DOI] [PubMed] [Google Scholar]
- 10.Liu F, Brezniceanu ML, Wei CC, et al. . Overexpression of angiotensinogen increases tubular apoptosis in diabetes. J Am Soc Nephrol 2008;19:269–280 [DOI] [PMC free article] [PubMed] [Google Scholar]
- 11.Brezniceanu ML, Liu F, Wei CC, et al. . Attenuation of interstitial fibrosis and tubular apoptosis in db/db transgenic mice overexpressing catalase in renal proximal tubular cells. Diabetes 2008;57:451–459 [DOI] [PubMed] [Google Scholar]
- 12.Brezniceanu ML, Liu F, Wei CC, et al. . Catalase overexpression attenuates angiotensinogen expression and apoptosis in diabetic mice. Kidney Int 2007;71:912–923 [DOI] [PubMed] [Google Scholar]
- 13.Godin N, Liu F, Lau GJ, et al. . Catalase overexpression prevents hypertension and tubular apoptosis in angiotensinogen transgenic mice. Kidney Int 2010;77:1086–1097 [DOI] [PubMed] [Google Scholar]
- 14.Shi Y, Lo CS, Chenier I, et al. . Overexpression of catalase prevents hypertension and tubulointerstitial fibrosis and normalization of renal angiotensin-converting enzyme-2 expression in Akita mice. Am J Physiol Renal Physiol 2013;304:F1335–F1346 [DOI] [PMC free article] [PubMed] [Google Scholar]
- 15.Chen X, Zhang SL, Pang L, et al. . Characterization of a putative insulin-responsive element and its binding protein(s) in rat angiotensinogen gene promoter: regulation by glucose and insulin. Endocrinology 2001;142:2577–2585 [DOI] [PubMed] [Google Scholar]
- 16.Wei CC, Guo DF, Zhang SL, Ingelfinger JR, Chan JS. Heterogenous nuclear ribonucleoprotein F modulates angiotensinogen gene expression in rat kidney proximal tubular cells. J Am Soc Nephrol 2005;16:616–628 [DOI] [PubMed] [Google Scholar]
- 17.Wei CC, Zhang SL, Chen YW, et al. . Heterogeneous nuclear ribonucleoprotein K modulates angiotensinogen gene expression in kidney cells. J Biol Chem 2006;281:25344–25355 [DOI] [PubMed] [Google Scholar]
- 18.Lo CS, Chang SY, Chenier I, et al. . Heterogeneous nuclear ribonucleoprotein F suppresses angiotensinogen gene expression and attenuates hypertension and kidney injury in diabetic mice. Diabetes 2012;61:2597–2608 [DOI] [PMC free article] [PubMed] [Google Scholar]
- 19.Abdo S, Lo CS, Chenier I, et al. . Heterogeneous nuclear ribonucleoproteins F and K mediate insulin inhibition of renal angiotensinogen gene expression and prevention of hypertension and kidney injury in diabetic mice. Diabetologia 2013;56:1649–1660 [DOI] [PubMed] [Google Scholar]
- 20.Xiong S, Salazar G, Patrushev N, Alexander RW. FoxO1 mediates an autofeedback loop regulating SIRT1 expression. J Biol Chem 2011;286:5289–5299 [DOI] [PMC free article] [PubMed] [Google Scholar]
- 21.Ding Y, Sigmund CD. Androgen-dependent regulation of human angiotensinogen expression in KAP-hAGT transgenic mice. Am J Physiol Renal Physiol 2001;280:F54–F60 [DOI] [PubMed] [Google Scholar]
- 22.Lo CS, Shi Y, Chang SY, et al. . Overexpression of heterogeneous nuclear ribonucleoprotein F stimulates renal Ace-2 gene expression and prevents TGF-β1-induced kidney injury in a mouse model of diabetes. Diabetologia 2015;58:2443–2454 [DOI] [PMC free article] [PubMed] [Google Scholar]
- 23.Abdo S, Shi Y, Otoukesh A, et al. . Catalase overexpression prevents nuclear factor erythroid 2-related factor 2 stimulation of renal angiotensinogen gene expression, hypertension, and kidney injury in diabetic mice. Diabetes 2014;63:3483–3496 [DOI] [PMC free article] [PubMed] [Google Scholar]
- 24.Lau GJ, Godin N, Maachi H, et al. . Bcl-2-modifying factor induces renal proximal tubular cell apoptosis in diabetic mice. Diabetes 2012;61:474–484 [DOI] [PMC free article] [PubMed] [Google Scholar]
- 25.Shi Y, Lo CS, Padda R, et al. Angiotensin-(1-7) prevents systemic hypertension, attenuates oxidative stress and tubulointerstitial fibrosis, and normalizes renal angiotensin-converting enzyme 2 and Mas receptor expression in diabetic mice. Clin Sci (Lond) 2015;128:649–663 [DOI] [PubMed]
- 26.Tang SS, Jung F, Diamant D, et al. . Temperature-sensitive SV40 immortalized rat proximal tubule cell line has functional renin-angiotensin system. Am J Physiol 1995;268:F435–F446 [DOI] [PubMed] [Google Scholar]
- 27.Roche E, Buteau J, Aniento I, Reig JA, Soria B, Prentki M. Palmitate and oleate induce the immediate-early response genes c-fos and nur-77 in the pancreatic beta-cell line INS-1. Diabetes 1999;48:2007–2014 [DOI] [PubMed] [Google Scholar]
- 28.Han SP, Tang YH, Smith R. Functional diversity of the hnRNPs: past, present and perspectives. Biochem J 2010;430:379–392 [DOI] [PubMed] [Google Scholar]
- 29.Decorsière A, Cayrel A, Vagner S, Millevoi S. Essential role for the interaction between hnRNP H/F and a G quadruplex in maintaining p53 pre-mRNA 3′-end processing and function during DNA damage. Genes Dev 2011;25:220–225 [DOI] [PMC free article] [PubMed] [Google Scholar]
- 30.Talukdar I, Sen S, Urbano R, Thompson J, Yates JR 3rd, Webster NJ. hnRNP A1 and hnRNP F modulate the alternative splicing of exon 11 of the insulin receptor gene. PLoS One 2011;6:e27869. [DOI] [PMC free article] [PubMed] [Google Scholar]
- 31.Gamberi C, Izaurralde E, Beisel C, Mattaj IW. Interaction between the human nuclear cap-binding protein complex and hnRNP F. Mol Cell Biol 1997;17:2587–2597 [DOI] [PMC free article] [PubMed] [Google Scholar]
- 32.Yoshida T, Makino Y, Tamura T. Association of the rat heterogeneous nuclear RNA-ribonucleoprotein F with TATA-binding protein. FEBS Lett 1999;457:251–254 [DOI] [PubMed] [Google Scholar]
- 33.Sharma K, McCue P, Dunn SR. Diabetic kidney disease in the db/db mouse. Am J Physiol Renal Physiol 2003;284:F1138–F1144 [DOI] [PubMed] [Google Scholar]
- 34.Sugaru E, Nakagawa T, Ono-Kishino M, et al. . Amelioration of established diabetic nephropathy by combined treatment with SMP-534 (antifibrotic agent) and losartan in db/db mice. Nephron, Exp Nephrol 2007;105:e45–e52 [DOI] [PubMed] [Google Scholar]
- 35.Hasegawa K, Wakino S, Yoshioka K, et al. . Sirt1 protects against oxidative stress-induced renal tubular cell apoptosis by the bidirectional regulation of catalase expression. Biochem Biophys Res Commun 2008;372:51–56 [DOI] [PubMed] [Google Scholar]
- 36.Chen Y, Schnetz MP, Irarrazabal CE, et al. . Proteomic identification of proteins associated with the osmoregulatory transcription factor TonEBP/OREBP: functional effects of Hsp90 and PARP-1. Am J Physiol Renal Physiol 2007;292:F981–F992 [DOI] [PubMed] [Google Scholar]
- 37.Wang E, Aslanzadeh V, Papa F, Zhu H, de la Grange P, Cambi F. Global profiling of alternative splicing events and gene expression regulated by hnRNPH/F. PLoS One 2012;7:e51266. [DOI] [PMC free article] [PubMed] [Google Scholar]
- 38.Kumar D, Robertson S, Burns KD. Evidence of apoptosis in human diabetic kidney. Mol Cell Biochem 2004;259:67–70 [DOI] [PubMed] [Google Scholar]
- 39.Susztak K, Ciccone E, McCue P, Sharma K, Böttinger EP. Multiple metabolic hits converge on CD36 as novel mediator of tubular epithelial apoptosis in diabetic nephropathy. PLoS Med 2005;2:e45. [DOI] [PMC free article] [PubMed] [Google Scholar]
- 40.Eddy AA. Molecular basis of renal fibrosis. Pediatr Nephrol 2000;15:290–301 [DOI] [PubMed] [Google Scholar]
- 41.Gilbert RE, Cooper ME. The tubulointerstitium in progressive diabetic kidney disease: more than an aftermath of glomerular injury? Kidney Int 1999;56:1627–1637 [DOI] [PubMed] [Google Scholar]
- 42.Marcussen N. Tubulointerstitial damage leads to atubular glomeruli: significance and possible role in progression. Nephrol Dial Transplant 2000;15(Suppl. 6):74–75 [DOI] [PubMed] [Google Scholar]
Associated Data
This section collects any data citations, data availability statements, or supplementary materials included in this article.


