

Abstract
The progression of glioblastoma (GBM) is driven by dynamic alterations in the activity and connectivity of gene pathways. Revealing these dynamic events is necessary in order to understand the pathological mechanisms of, and develop effective treatments for, GBM. The present study aimed to investigate dynamic alterations in pathway activity and connectivity across radiotherapy and chemoradiation conditions in GBM, and to give system-level insights into molecular mechanisms for GBM therapy. A total of two differential co-expression networks (DCNs) were constructed using Pearson correlation coefficient analysis and one sided t-tests, based on gene expression profiles and protein-protein interaction networks, one for each condition. Subsequently, shared differential modules across DCNs were detected via significance analysis for candidate modules, which were obtained according to seed selection, module search by seed expansion and refinement of searched modules. As condition-specific differential modules mediate differential biological processes, the module connectivity dynamic score (MCDS) was implemented to explore dynamic alterations among them. Based on DCNs with 287 nodes and 1,052 edges, a total of 28 seed genes and seven candidate modules were identified. Following significance analysis, five shared differential modules were identified in total. Dynamic alterations among these differential modules were identified using the MCDS, and one module with significant dynamic alterations was identified, termed the dynamic module. The present study revealed the dynamic alterations of shared differential modules, identified one dynamic module between the radiotherapy and chemoradiation conditions, and demonstrated that pathway dynamics may applied to the study of the pathogenesis and therapy of GBM.
Keywords: Glioblastoma, radiotherapy, chemoradiation, differential co-expression network, pathway dynamics
Introduction
Glioblastoma (GBM) is the most common and aggressive form of human primary brain malignancy, with ~17,000 diagnoses/year (1). GBM is associated with poor prognosis and a lack of effective therapeutic options, due to the impracticality of extensive tumor resection and poor drug delivery in the brain (2). Recently, combined chemoradiation, using concomitant and adjuvant temozolomide and radiotherapy, has been used with a modest degree of efficacy (3). High-throughput genomic data derived from patients with GBM are readily-available for analyses aiming to identify biomarkers for measuring therapeutic efficacy (4).
Identification of a target gene in tumors is often complicated by broad genomic copy number aberrations, multiple mechanisms of activating and inactivating genetic and epigenetic alterations, and the complexity of pathway regulation (5). Target-gene identification may be confounded by contaminating non-tumor cells or the molecular heterogeneity of the tumor (6). Genes do not act in isolation; it is necessary to elucidate and annotate all functional interactions among genes in the cell to understand cellular functions (7). Therefore, identifying pathways or modules may be a useful and reliable approach, and is a good choice to elucidate the pathological mechanism of GBM. As genes in the same pathway tend to exhibit correlated expression, analyzing the co-expression network is an effective strategy. In the present study, multiple differential co-expression networks (DCN) were applied to investigate multiple differential modules of GBM in radiotherapy and chemoradiation conditions.
Pathway dynamics may be attributed to alterations in gene expression and connectivity among genes (i.e. pathway rewiring). The latter has previously been demonstrated to serve a role in disease progression and treatment responses (8,9). However, few studies have focused on pathway dynamics in the treatment of GBM. Therefore, the present study aimed to detect dynamic differential modules across radiotherapy and chemoradiation conditions in GBM. Dynamic alterations and connectivity were evaluated using the module connectivity dynamic score (MCDS). Dynamic modules were identified, which provided insights into the molecular mechanisms of treatment for GBM.
Materials and methods
Gene expression profile
In the present study, the gene expression profile E-GEOD-7696 (4,10) for GBM and normal samples was obtained from the ArrayExpress database (ebi.ac.uk/arrayexpress). E-GEOD-7696 was composed of four healthy samples, 28 GBM samples treated with radiotherapy, and 52 GBM samples treated with chemoradiation. In order to control the quality of the data, standard data preprocessing was performed, consisting of background correction using the Robust Multi-array Average algorithm (11), normalization based on the quantiles method (12) and probe match using the Micro Array Suite algorithm (13). Each probe ID was mapped to the gene symbol using the annotate package (14) and screened using the feature filter method to discard duplicated genes (15). A total of 20,545 genes were identified for subsequent analysis.
Construction of multiple DCNs
For each condition, DCN construction consisted of two steps: Constructing a binary co-expression network (BCN), and assigning a weight to each edge in the BCN based on differential gene expression between each treatment condition and normal condition.
BCN
A protein-protein interaction (PPI) network was extracted from the human STRING database (16), which was composed of 787,896 interactions among 16,730 genes. By taking intersections with the gene expression data, a sub-PPI network was generated, including 15,130 genes and 725,216 interactions. In order to evaluate the co-expression probability of gene pairs, the Pearson correlation coefficient (PCC) (17) was implemented to assess the edge scores in the PPI network, and the absolute value of PCC for an interaction was denoted to be Δ. Genes with interactions of Δ≥0.8 were selected to build the BCN. In order to facilitate the analysis and comparison among different conditions, the intersected interactions with Δ≥0.8 in the different conditions were selected. For the BCNs in different conditions, the genes were the same although the number of edges and their scores were different.
Weight assignments
A weight value was assigned to each edge in the BCN based on the differential gene expression between each treatment and the normal condition. Prior to weight assignment, the q value of differential gene expression between each treatment condition (radiotherapy and chemoradiation) and the normal condition was calculated using a one-sided t-test (18). A weight was subsequently assigned to each edge based on the q value. The weight Wi,j on edge (i, j) in the co-expression network was defined as follows:
Where qi and qj stood for the q value for genes i and j, respectively; S was the node set of the co-expression network; and PCC (i, j) represented the absolute value of the PCC between genes i and j based on their expression profiles.
Following the BCN and weight assignment steps, higher weight values were assigned to the co-expressed and significantly differentially-expressed genes. A total of two specific DCNs were identified in GBM, one for the radiotherapy condition and one for the chemoradiation condition. Mathematically, for the two DCNs, the node sets were the same, although the edge sets were different due to the different weights.
Extraction of multiple differential modules from multiple DCNs
The multiple differential module algorithm was based on seed gene expansion and significance analysis, consistent with a previous study identifying gene modules across multiple co-expression networks (19). The schema consisted of four steps: Seed selection; module search by seed expansion; refinement of candidate modules; and significance analysis for candidate modules.
Seed selection
The seed selection step ranked genes in two specific DCNs according to the topological feature of the gene in the network. For each DCN, G=(S,T), the adjacency matrix was expressed as A=(aij). A function, g, was used and the importance of gene i in the corresponding network was assessed, g(i) (20).
And
Where Aij stood for the degree normalized weighted adjacency matrix; D was a diagonal matrix with element , j belonging to N(i), which was the set of neighbors of i in G. The equation indicated that the importance of a node depended on the number of neighbors, the strength of the connections and the importance of the neighbors. Subsequent to calculating the ranks of a node in two individual networks, a z-score for each rank was computed (21). The gene rank was obtained by averaging the z-scores across two DCNs and the top 10% of genes were selected as seed genes.
Module search by seed expansion
A graph entropy-based objective function (Δ E) was used to assess the scale of a module search starting with a seed gene (22). The seed gene (x) was taken as a module O={ x}, and the new candidate module as O'= O ∪{ y}. For each vertex y in its neighborhood in all networks, N(x) =U iNi(x), y є N(x) was defined, in which N i (x) was the neighbor set in Gi as the candidate for M. The entropy decrease between O and O' was evaluated as follows:
of which
Where was the sum of all the vertices in O and network k; and Oi (1≤ i≤τ) was the group of modules being sought where τ was the number of modules. E(O') was calculated similarly. Δ E(O', O)>0 indicated that the addition of vertex y improved the connectivity of the former candidate modules. The vertex y whose addition maximized Δ E was added to O. The searching process was not terminated until there was no decrease subsequent to adding genes iteratively, leading to the maximum decrease in Δ E. Following this process, candidate modules were identified in two DCNs.
Refinement of candidate modules
During this step, candidate modules with a gene size of <5 were removed due to poor connectivity. In addition, the large number of candidate modules may have led to overlap between them; the Jaccard index (23) was used to refine the overlap between candidate modules. In the present study, a Jaccard index of 0.5 was utilized.
Significance analysis for candidate modules
The statistical significance of candidate modules from two specific DCNs was computed on the basis of the null score distribution of the candidate modules, generated using randomized networks. Each randomized network was composed of edges captured from the specific PPI network, and the number of edges was the same in the randomized network and the DCN. Using degree-preserved edge shuffling, each network was completely randomized 100 times. A module search was performed for the randomized networks in order to identify the module scores. Subsequently, the empirical P-value of a module was defined as the probability of the module exhibiting the observed score or less by chance. P-values were corrected using the Benjamini-Hochberg method (24), and candidate modules with P<0.05 were considered to be differential modules between each of the treatment and normal conditions.
Connectivity dynamics of shared differential modules
Due to condition-specific differential modules exhibiting differential activities and mediating differential biological processes, the module connectivity dynamic score (MCDS) was implemented to explore dynamic alterations among them (25). The overall MCDS of a differential module was defined as the average MCDS of all pairwise comparisons. The statistical significance of MCDS for a differential module was computed in a similar way as that for candidate modules. If the MCDS for a differential module had P<0.05, it was denoted to be a dynamic module with increased dynamic alterations.
Results
Analysis of pathway dynamics is a novel approach in GBM
An important innovation in the present method was the ability to identify shared differential modules from two specific DCNs, each of which represented a different perturbation condition. There were two conditions of GBM (radiotherapy and chemoradiation) in the present study. Therefore, two DCNs and two group differential modules were obtained for the two conditions, compared with the normal condition.
Construction of DCNs
For each treatment condition, the gene co-expression for the PPI (including 15,130 genes and 725,216 interactions) was calculated based on the PCC, and gene pairs with Δ≥0.8 were considered significantly co-expressed and used to build the BCN. A weight value was assigned to each edge in the BCN based on differential gene expression between radiotherapy/chemoradiation and the normal condition. A total of two condition-specific DCNs with 287 nodes and 1,052 edges were constructed in GBM, one for the radiotherapy condition (Fig. 1A) and one for the chemoradiation condition (Fig. 1B). These DCNs exhibited the same node sets, although the weights of edges were different. The frequency distribution of edge weights between the two conditions is presented in Fig. 2. In the chemoradiation-specific DCN, the average weight (0.0801) was decreased compared with the radiotherapy condition (0.0997). Out of 1,052 edges, 89 exhibited increased weight values and 956 exhibited decreased weights in the chemoradiation condition compared with the radiotherapy condition, and the weights of seven edges were the same in the two conditions.
Figure 1.

Graphical representation of differential co-expression networks in glioblastoma. (A) Radiotherapy condition and (B) chemoradiation condition. Nodes represent genes and edges represent interactions between them. The width of an edge represents the weight between two genes.
Figure 2.

Weight frequency distribution of gene physical interactions in radiotherapy- and chemoradiation-specific differential co-expression networks in glioblastoma.
Identification of shared differential modules
In the present study, a systemic differential module algorithm was employed to identify the shared differential modules across radiotherapy and chemoradiation conditions in GBM. According to the topological properties of the importance of genes and the rank of genes across two DCNs (calculated by averaging the z-scores), a total of 28 seed genes were obtained and are presented in Table I. The top rank seed gene was solute carrier family 17 member 7 (z-score=21.797). A module search by seed expansion was carried out based on the entropy decrease Δ E (O, O) between O and O, and a total of seven shared candidate modules were detected following refinement with the Jaccard index ≥0.5 in the two conditions.
Table I.
Seed genes and their average z-scores in differential co-expression networks.
| No. | Seed gene | Average z-score |
|---|---|---|
| 1 | SLC17A7 | 21.797 |
| 2 | GAD2 | 21.693 |
| 3 | CPLX2 | 18.762 |
| 4 | CCK | 17.799 |
| 5 | SLC12A5 | 14.862 |
| 6 | PACSIN1 | 11.924 |
| 7 | SYN1 | 11.897 |
| 8 | CHGA | 11.799 |
| 9 | GABRA1 | 10.869 |
| 10 | CORO1A | 6.718 |
| 11 | CD53 | 6.685 |
| 12 | TYROBP | 6.253 |
| 13 | UNC13C | 5.989 |
| 14 | PDYN | 5.701 |
| 15 | STX1A | 4.964 |
| 16 | CACNG3 | 3.985 |
| 17 | LAPTM5 | 3.973 |
| 18 | LY86 | 3.935 |
| 19 | ARHGAP9 | 3.593 |
| 20 | C3AR1 | 3.448 |
| 21 | GMFG | 3.164 |
| 22 | HCK | 3.091 |
| 23 | CYBA | 3.036 |
| 24 | DPT | 3.026 |
| 25 | DNAAF1 | 2.959 |
| 26 | HCLS1 | 2.771 |
| 27 | PSMD10 | 2.750 |
| 28 | ZMYND10 | 2.737 |
In order to calculate the statistical significance of the seven shared candidate modules across the two conditions, the null score distribution analysis was performed. A randomized network with 1,052 edges was constructed in order to examine the modules, and a total of 1,846 modules were obtained. Candidate modules which met the threshold of P<0.05 were regarded as differential modules, and five shared differential modules were identified (Fig. 3). It was observed that the weights of the five shared differential modules in the two conditions were different. The properties of the five differential modules are presented in Table II.
Figure 3.

Shared differential modules in the radiotherapy and chemoradiation conditions. (A-a) Module 1 radiotherapy condition, (A-b) module 1 chemoradiation condition, (B-a) module 2 radiotherapy condition, (B-b) module 2 chemoradiation condition, (C-a) module 3 radiotherapy condition, (C-b) module 3 chemoradiation condition, (D-a) module 4 radiotherapy condition, (D-b) module 4 chemoradiation condition, (E-a) module 5 radiotherapy condition and (E-b) module 5 chemoradiation condition. Nodes represent genes and edges represent interactions between them. Yellow nodes represent seed genes. The width of an edge represents the weight between two genes.
Table II.
Properties of the five shared differential modules.
| Module | Nodes | Edges | No. of seed genes | Start seed gene | P-value |
|---|---|---|---|---|---|
| 1 | 29 | 88 | 11 | CORO1A | 0.0376 |
| 2 | 44 | 125 | 11 | TYROBP | 0.0451 |
| 3 | 22 | 66 | 9 | LY86 | 0.0259 |
| 4 | 9 | 13 | 2 | DNAAF1 | 0.0436 |
| 5 | 11 | 15 | 1 | PSMD10 | 0.0038 |
CORO1A, coronin 1A; TYROBP, TYRO protein tyrosine kinase binding protein; LY86, lymphocyte antigen 86; DNAAF1, dynein axonemal assembly factor 1; PSMD10, proteasome 26S subunit, non-ATPase 10.
Connectivity dynamics of shared differential modules
As component modules share the same set of genes between two DCNs, although they may differ in their connectivity, MCDS was used to capture dynamic alterations in the shared differential modules and the significance of the MCDS was calculated. Among the five shared differential modules, only one exhibited a significant dynamic alteration between the radiotherapy and chemoradiation conditions (P=0.0436; Fig. 4). Consequently, this module was denoted to be a dynamic module.
Figure 4.
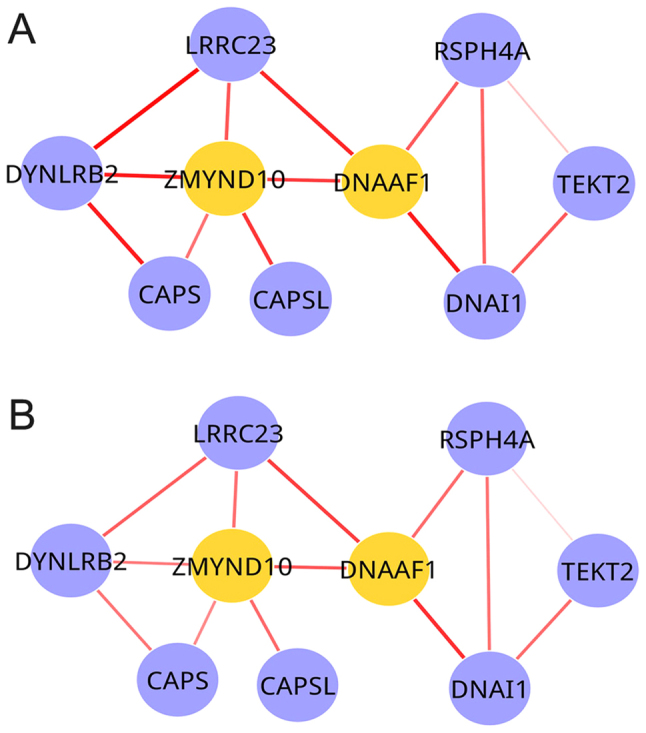
Dynamic module across radiotherapy and chemoradiation conditions in glioblastoma. (A) Radiotherapy condition and (B) chemoradiation condition. Nodes represent genes and edges represent interactions between them. Yellow nodes represent seed genes. The width of an edge represents the weight between two genes.
Discussion
Networking is able to provide significant instructions for mining unknown connections in incomplete networks. Although the availability of data on large-scale protein interactions is increasing with the development of high throughput testing technology, certain important interactions are rarely studied, including significant pathways (26). This may be resolved to some extent by utilizing modules of the complex network (27). However, from a systems biology outlook, diseases are caused by perturbations of the gene network and such perturbations dynamically alter the disease process (25). Therefore, the present study investigated dynamic alterations in module activity and connectivity across the radiotherapy and chemoradiation conditions of GBM.
The present method presents an opportunity to study the dynamics of gene modules in ≥2 conditions, and the MCDS metric is able to distinguish between dynamic and static shared differential modules. The dynamic module identified in the present study differed from the others in multiple aspects, including their topological properties. In particular, the activity and connectivity of the dynamic module was correlated with alterations in the different tumor conditions, suggesting that dynamic modules may serve a more important role during the treatment of tumor progression. Therefore, the study of pathway dynamics may lead to novel insights into tumor pathogenesis and therapy.
In the present study, two DCNs were constructed, five shared differential modules identified, and one dynamic module identified with increased dynamic alterations in activity and connectivity, across the radiotherapy and chemoradiation conditions in GBM. In the two DCNs, the number of nodes and edges were the same, although the weights were different; this was additionally observed in the shared differential modules across the radiotherapy and chemoradiation conditions. By applying MCDS and the significance analyses, one dynamic module with nine nodes and 13 edges was identified, of which dynein axonemal assembly factor 1 (DNAAF1) and zinc finger MYND type-containing 10 (ZMYND10) were the seed genes. DNAAF1 was the start seed gene and ZMYND10 exhibited the highest degree. ZMYND domain-containing proteins are a protein family whose members are associated with transcriptional regulators and may modulate the process of malignant transformation (28). As a member of the ZMYND family, ZMYND10 has been demonstrated to localize to the cytoplasmic puncta in respiratory epithelial cells and to regulate transcription of dynein proteins (29). In addition, ZMYND10 has been demonstrated to act as a tumor suppressor, arresting the cell cycle at the G1 phase, downregulating cyclin D1 promoter activity and inhibiting the clonogenic growth of nasopharyngeal carcinoma cells (30). It has been reported that methylation of β-catenin in lung cancer/ZMYND10 was detected in >95% of primary glioma tumors (28). Therefore, it is hypothesized that ZMYND10 may be associated with the treatment of GBM. Future studies will investigate the association of the dynamic module identified in the present study with the treatment of GBM.
In conclusion, the present study investigated the dynamic alterations of module activity and connectivity, and identified 1 dynamic module across the radiotherapy and chemoradiation conditions in GBM, which provides insights into the molecular mechanism of GBM treatment and potential biomarkers for the therapy of GBM.
References
- 1.Omuro A, DeAngelis LM. Glioblastoma and other malignant gliomas: A clinical review. JAMA. 2013;310:1842–1850. doi: 10.1001/jama.2013.280319. [DOI] [PubMed] [Google Scholar]
- 2.Sottoriva A, Spiteri I, Piccirillo SG, Touloumis A, Collins VP, Marioni JC, Curtis C, Watts C, Tavaré S. Intratumor heterogeneity in human glioblastoma reflects cancer evolutionary dynamics. Proc Natl Acad Sci USA. 2013;110:4009–4014. doi: 10.1073/pnas.1219747110. [DOI] [PMC free article] [PubMed] [Google Scholar]
- 3.Stupp R, Mason WP, Van Den Bent MJ, Weller M, Fisher B, Taphoorn MJ, Belanger K, Brandes AA, Marosi C, Bogdahn U, et al. Radiotherapy plus concomitant and adjuvant temozolomide for glioblastoma. N Engl J Med. 2005;352:987–996. doi: 10.1056/NEJMoa043330. [DOI] [PubMed] [Google Scholar]
- 4.Lambiv WL, Vassallo I, Delorenzi M, Shay T, Diserens AC, Misra A, Feuerstein B, Murat A, Migliavacca E, Hamou MF, et al. The Wnt inhibitory factor 1 (WIF1) is targeted in glioblastoma and has a tumor suppressing function potentially by induction of senescence. Neuro Oncol. 2011;13:736–747. doi: 10.1093/neuonc/nor036. [DOI] [PMC free article] [PubMed] [Google Scholar]
- 5.Werner T. Target gene identification from expression array data by promoter analysis. Biomol Eng. 2001;17:87–94. doi: 10.1016/S1389-0344(00)00071-X. [DOI] [PubMed] [Google Scholar]
- 6.Liu T, Reinhart BJ, Magnani E, Huang T, Kerstetter R, Barton M. Of blades and branches: Understanding and expanding the Arabidopsis Ad/Abaxial regulatory network through target gene identification. Cold Spring Harb Symp Quant Biol. 2012;77:31–45. doi: 10.1101/sqb.2013.77.014480. [DOI] [PubMed] [Google Scholar]
- 7.Szklarczyk D, Franceschini A, Kuhn M, Simonovic M, Roth A, Minguez P, Doerks T, Stark M, Muller J, Bork P, et al. The STRING database in: Functional interaction networks of proteins, globally integrated and scored. Nucleic Acids Res. 2011;39:D561–D568. doi: 10.1093/nar/gkq973. (Database issue) [DOI] [PMC free article] [PubMed] [Google Scholar]
- 8.Taylor IW, Linding R, Warde-Farley D, Liu Y, Pesquita C, Faria D, Bull S, Pawson T, Morris Q, Wrana JL. Dynamic modularity in protein interaction networks predicts breast cancer outcome. Nat Biotechnol. 2009;27:199–204. doi: 10.1038/nbt.1522. [DOI] [PubMed] [Google Scholar]
- 9.Lee MJ, Ye AS, Gardino AK, Heijink AM, Sorger PK, MacBeath G, Yaffe MB. Sequential application of anticancer drugs enhances cell death by rewiring apoptotic signaling networks. Cell. 2012;149:780–794. doi: 10.1016/j.cell.2012.03.031. [DOI] [PMC free article] [PubMed] [Google Scholar]
- 10.Murat A, Migliavacca E, Gorlia T, Lambiv WL, Shay T, Hamou MF, de Tribolet N, Regli L, Wick W, Kouwenhoven MC, et al. Stem cell-related ‘self-renewal’ signature and high epidermal growth factor receptor expression associated with resistance to concomitant chemoradiotherapy in glioblastoma. J Clin Oncol. 2008;26:3015–3024. doi: 10.1200/JCO.2007.15.7164. [DOI] [PubMed] [Google Scholar]
- 11.Irizarry RA, Bolstad BM, Collin F, Cope LM, Hobbs B, Speed TP. Summaries of Affymetrix GeneChip probe level data. Nucleic Acids Res. 2003;31:e15. doi: 10.1093/nar/gng015. [DOI] [PMC free article] [PubMed] [Google Scholar]
- 12.Bolstad BM, Irizarry RA, Astrand M, Speed TP. A comparison of normalization methods for high density oligonucleotide array data based on variance and bias. Bioinformatics. 2003;19:185–193. doi: 10.1093/bioinformatics/19.2.185. [DOI] [PubMed] [Google Scholar]
- 13.Bolstad B. http://120.52.72.36/www.bioconductor.org/c3pr90ntcsf0/packages/release/bioc/vignettes/affy/inst/doc/builtinMethods.pdf Affy: Built-in Processing Methods. 2015 [Google Scholar]
- 14.Zhu LJ, Gazin C, Lawson ND, Pagès H, Lin SM, Lapointe DS, Green MR. ChIPpeakAnno: A Bioconductor package to annotate ChIP-seq and ChIP-chip data. BMC Bioinformatics. 2010;11:237. doi: 10.1186/1471-2105-11-237. [DOI] [PMC free article] [PubMed] [Google Scholar]
- 15.Gentleman R, Carey V, Huber W, Hahne F. Genefilter: Methods for filtering genes from microarray experiments. http://www.bioconductor.org/packages/2.3/bioc/html/genefilter.html R package. 2011 [Google Scholar]
- 16.Szklarczyk D, Franceschini A, Wyder S, Forslund K, Heller D, Huerta-Cepas J, Simonovic M, Roth A, Santos A, Tsafou KP, et al. STRING v10: Protein-protein interaction networks, integrated over the tree of life. Nucleic Acids Res. 2015;43:D447–D452. doi: 10.1093/nar/gku1003. (Database issue) [DOI] [PMC free article] [PubMed] [Google Scholar]
- 17.Benesty J, Chen J, Huang Y, Cohen I. Noise reduction in speech processing. Berlin Heidelberg: Springer; 2009. Pearson correlation coefficient; pp. 1–4. [DOI] [Google Scholar]
- 18.Cohen J, Cohen P, West SG, Aiken LS. Applied multiple regression/correlation analysis for the behavioral sciences. 3rd. Hoboken: Taylor and Francis; 2013. [Google Scholar]
- 19.Ma X, Gao L, Tan K. Modeling disease progression using dynamics of pathway connectivity. Bioinformatics. 2014;30:2343–2350. doi: 10.1093/bioinformatics/btu298. [DOI] [PMC free article] [PubMed] [Google Scholar]
- 20.Vanunu O, Magger O, Ruppin E, Shlomi T, Sharan R. Associating genes and protein complexes with disease via network propagation. PLoS Comput Biol. 2010;6:e1000641. doi: 10.1371/journal.pcbi.1000641. [DOI] [PMC free article] [PubMed] [Google Scholar]
- 21.Zhou D, Bousquet O, Lal TN, Weston J, Schölkopf B. Learning with local and global consistency. Adv Neural Inform Pro Systems. 2004;16:321–328. [Google Scholar]
- 22.Fortunato S, Barthélemy M. Resolution limit in community detection. Proc Natl Acad Sci USA. 2007;104:36–41. doi: 10.1073/pnas.0605965104. [DOI] [PMC free article] [PubMed] [Google Scholar]
- 23.Bouchard M, Jousselme A-L, Doré P-E. A proof for the positive definiteness of the Jaccard index matrix. Int J Approximate Reasoning. 2013;54:615–626. doi: 10.1016/j.ijar.2013.01.006. [DOI] [Google Scholar]
- 24.Benjamini Y, Hochberg Y. Controlling the false discovery rate: A practical and powerful approach to multiple testing. J Royal Stat Soc Series B (Methodological) 1995;57:289–300. [Google Scholar]
- 25.Ma X, Gao L, Karamanlidis G, Gao P, Lee CF, Garcia-Menendez L, Tian R, Tan K. Revealing pathway dynamics in heart diseases by analyzing multiple differential networks. PLoS Comput Biol. 2015;11:e1004332. doi: 10.1371/journal.pcbi.1004332. [DOI] [PMC free article] [PubMed] [Google Scholar]
- 26.Nibbe RK, Chowdhury SA, Koyutürk M, Ewing R, Chance MR. Protein-protein interaction networks and subnetworks in the biology of disease. Wiley Interdiscip Rev Syst Biol Med. 2011;3:357–367. doi: 10.1002/wsbm.121. [DOI] [PubMed] [Google Scholar]
- 27.Wu Y, Jing R, Jiang L, Jiang Y, Kuang Q, Ye L, Yang L, Li Y, Li M. Combination use of protein-protein interaction network topological features improves the predictive scores of deleterious non-synonymous single-nucleotide polymorphisms. Amino Acids. 2014;46:2025–2035. doi: 10.1007/s00726-014-1760-9. [DOI] [PubMed] [Google Scholar]
- 28.Hesson LB, Cooper WN, Latif F. Evaluation of the 3p21. 3 tumour-suppressor gene cluster. Oncogene. 2007;26:7283–7301. doi: 10.1038/sj.onc.1210547. [DOI] [PubMed] [Google Scholar]
- 29.Zariwala MA, Gee HY, Kurkowiak M, Al-Mutairi DA, Leigh MW, Hurd TW, Hjeij R, Dell SD, Chaki M, Dougherty GW, et al. ZMYND10 is mutated in primary ciliary dyskinesia and interacts with LRRC6. Am J Hum Genet. 2013;93:336–345. doi: 10.1016/j.ajhg.2013.06.007. [DOI] [PMC free article] [PubMed] [Google Scholar]
- 30.Zhang X, Liu H, Li B, Huang P, Shao J, He Z. Tumor suppressor BLU inhibits proliferation of nasopharyngeal carcinoma cells by regulation of cell cycle, c-Jun N-terminal kinase and the cyclin D1 promoter. BMC Cancer. 2012;12:267. doi: 10.1186/1471-2407-12-267. [DOI] [PMC free article] [PubMed] [Google Scholar]