

Abstract
PIK3CA mutations are associated with resistance to HER2-targeted therapies. We previously showed that HER2+/PIK3CAH1047R transgenic mammary tumors are resistant to the HER2 antibodies trastuzumab and pertuzumab but respond to PI3K inhibitor buparlisib (TPB). In this study, we identified mechanisms of resistance to combined inhibition of HER2 and PI3K. TPB-resistant tumors were generated by treating HER2+/PIK3CAH1047R mice long-term with the drug combination. RNA-sequencing of TPB-resistant tumors revealed that extracellular matrix (ECM) and cell adhesion genes, including collagen II (Col2a1), were markedly upregulated, accompanied by activation of integrin β1/Src. Cells derived from drug-resistant tumors were sensitive to TBP when grown in vitro, but exhibited resistance when plated on collagen or when re-introduced into mice. Drug resistance was partially reversed by the collagen synthesis inhibitor ethyl-3,4-dihydroxybenzoate (DHB). Inhibition of integrin β1/Src blocked collagen-induced resistance to TPB and inhibited growth of drug-resistant tumors. High collagen II expression was associated with significantly lower clinical response to neoadjuvant anti-HER2 therapy in HER2+ breast cancer patients. Overall, these data suggest that upregulation of collagen/integrin/Src signaling contributes to resistance to combinatorial HER2 and PI3K inhibition.
Keywords: HER2, PI3K, trastuzumab, pertuzumab, breast cancer, tumor microenvironment
Introduction
The HER2 (ERBB2) gene is amplified in approximately 20% of breast cancers (1). HER2-targeted therapies such as trastuzumab, lapatinib, pertuzumab and trastuzumab-DM1 (T-DM1) have changed the natural history of HER2-positive (HER2+) breast cancers and, as such, significantly improved patient survival (1,2). Dual blockade of HER2, such as with the combinations of trastuzumab and lapatinib or trastuzumab and pertuzumab, has been shown to be more effective than single-agent therapy (3-6). Despite these recent advances, most patients with advanced HER2+ breast cancer are not cured of their disease, and acquired resistance to dual blockade of HER2 remains a problem in the clinic.
Activating mutations in PIK3CA, the gene encoding the p110α catalytic subunit of phosphoinositide 3-kinase (PI3K), are found in ∼30% of HER2+ breast cancers (7,8). We previously reported that HER2+/PIK3CAH1047R transgenic tumors in genetically engineered mice are completely resistant to the combinations of trastuzumab + lapatinib (T + L) and trastuzumab + pertuzumab (T + P) (9). In agreement with these data, results from the CLEOPATRA clinical trial showed that progression-free survival following T + P + docetaxel is shorter in patients with HER2+/PIK3CA-mutant breast cancer compared to those with wild-type PIK3CA (10). In addition, the pathological complete response rate (pCR) to T + L is lower in patients with PIK3CA mutations (11,12). These data suggest that dual HER2 blockade is not sufficient to eradicate HER2+/PIK3CA-mutant breast tumors. Addition of a PI3K inhibitor to trastuzumab/lapatinib or trastuzumab/pertuzumab reversed the resistance to the anti-HER2 combinations resulting in growth inhibition of HER2+/PIK3CA mutant transgenic tumors (9,13). Therefore, this subset of HER2+/PIK3CA-mutant tumors will likely need to be treated with a combination of HER2 and PI3K inhibitors; such combinations are currently being tested in clinical trials (14,15). However, we speculate that, with time, patients with advanced breast cancer may also develop resistance to this combination therapy.
In order to identify mechanisms of resistance to combined inhibition of HER2 and PI3K, we generated transgenic HER2+/PIK3CAH1047Rmammary tumors resistant to the combination of trastuzumab/pertuzumab plus the pan-PI3K inhibitor buparlisib (BKM120) (16) (herein referred to as TPB). We found that ECM and cell adhesion genes were highly upregulated in TPB-resistant tumors, coinciding with activation of Integrin β1 and Src. ECM components, such as collagens, promoted resistance to TPB in vitro and this resistance was reversed by inhibition of either collagen secretion or Integrin/Src signaling. We further show that high expression of collagen II, an ECM gene that was upregulated in the TPB-resistant mouse tumors, correlated with a lower response rate to neoadjuvant anti-HER2 therapy in patients with early HER2+ breast cancer. These data suggest that collagen/Integrin/Src signaling promotes resistance to combined inhibition of HER2 and PI3K, which can be overcome by Integrin β1 or Src inhibitors.
Materials and Methods
Generation and treatment of drug-resistant tumors
HER2+/PIK3CAH1047R transgenic mice were described previously (9). Beginning at 4 weeks of age, mice were administered 2 mg/mL doxycycline (DOX) in 5% sucrose water; fresh DOX water was replaced twice weekly. For tumor allografts, mouse mammary tumors were harvested, minced, and homogenized in serum-free DMEM + 1× antibiotic/antimycotic (Gibco) using the GentleMACS dissociator (Miltenyi Biotec). Homogenized tumor cells were mixed 1:1 with growth-factor reduced Matrigel (BD Biosciences) and 200-300 μL were injected into the inguinal mammary fat pads of 5- to 7-week-old athymic female mice (Envigo or the Jackson Laboratory) using a 25-gauge needle. Recipient mice were maintained on 2 mg/mL DOX. Luciferase gene expression (a reporter for the PIK3CAH1047R transgene) in tumor allografts was monitored as described (9).
To generate TPB-resistant tumors, tumor allografts from HER2+/PIK3CAH1047R mouse #564 (n=11) or from HER2+/PIK3CAH1047R mouse #635 (n=10) were treated with trastuzumab (30 mg/kg in sterile PBS) and pertuzumab (30 mg/kg in sterile PBS; both from the Vanderbilt University Medical Center Pharmacy) i.p. twice weekly along with buparlisib (30 mg/kg; Novartis) daily by oral gavage in 0.5% hydroxypropylmethylcellulose, 0.1% Tween-80. Tumor diameters were serially measured with calipers and tumor volumes were calculated by the formula: volume = width2 × length/2. Tumors that reached >1000 mm3 during treatment were designated TPB-resistant. For the #635 line, treatment was stopped when tumors regressed to a volume of <50 mm3 and resumed when tumors reached >200 mm3. TPB-resistant tumors (3 from the #564 line and 2 from the #635 line) were then re-transplanted (n=4-5 allografts per resistant tumor) and re-treated with TPB or T + P + the PI3Kα inhibitor alpelisib (BYL719; 30 mg/kg; Novartis) when tumors reached >200 mm3.
For therapeutic studies, TPB-resistant tumor #564-14-23 was grafted into treatment-naïve mice following the same protocol. Once tumors reached a volume >200 mm3, mice were randomized 1:1 to receive trastuzumab + pertuzumab + buparlisib (as above) or TPB + saracatinib (AstraZeneca; 50 mg/kg by oral gavage daily). Ethyl-3,4-dihydroxybenzoate (DHB; Sigma Aldrich) treatment (40 mg/kg in 95% saline/5% ethanol i.p. daily) was initiated one day after tumor cell injection. Tumors were harvested 24 h after the last dose of trastuzumab/pertuzumab and 1 h after the last dose of buparlisib, saracatinib, or DHB. Animal experiments were conducted in a controlled and non-blinded manner. All animal experiments were approved by the Vanderbilt Institutional Animal Care and Use Committee (IACUC protocol M/10/347 and M/14/107).
Generation of primary mouse tumor cells (PTCs) and PTC allografts
PTCs were isolated as described in Supplementary Materials and Methods. All experiments were performed on cells that were maintained in culture for less than 3 months.
Approximately 5×10⁶ PTCs derived from parental tumor #564 or TPB-resistant tumor #564-14-23 were mixed 1:1 with Matrigel; 250 μl of the cells:Matrigel mixture were injected into the inguinal mammary fat pads of 6- to 7-week-old athymic female mice using a 25-gauge needle. Recipient mice were maintained on 2 mg/mL DOX. Once tumors reached >200 mm3, all mice were treated with 30 mg/kg trastuzumab, 30 mg/kg pertuzumab and 30 mg/kg buparlisib for 4 weeks.
Breast cancer cell lines
MDA-MB 453 (ATCC® HTB-131™) and HCC1954 (ATCC® CRL-2338™) human breast cancer cells were obtained from the American Type Culture Collection (ATCC) within the past 10 years and maintained in ATCC-recommended media supplemented with 10% FBS (Gibco) and 1× antibiotic/antimycotic (Gibco). All experiments were performed less than 2 months after thawing early-passage cells. MDA-MB 453 and HCC1954 cells were authenticated by ATCC using the STR method in January 2017. Mycoplasma testing was conducted for each cell line before use.
Whole exome and RNA sequencing
Whole exome sequencing is described in Supplementary Materials and Methods. RNA was isolated from 5-30 mg of snap-frozen tissue from untreated parental (n=3) and TPB-resistant (n=6) tumors using the RNeasy Tissue Kit (Qiagen) according to the manufacturer's instructions. Tumors were lysed in RLT buffer containing β-mercaptoethanol using the Tissue Lyser (Qiagen) followed by on-column DNase digestion. Library preparation and analysis are described in Supplementary Materials and Methods. P-values were corrected for multiple hypothesis testing using q-value; a FDR of <0.05 was used to define differentially expressed genes. Pathway analysis on differentially expressed genes was performed using DAVID functional annotation clustering.
qRT-PCR
RNA isolation was performed using the Maxwell LEV simplyRNA Purification Kit (Promega) on the Maxwell 16 Instrument (Promega). RNA was reverse-transcribed using the iScript cDNA Synthesis Kit (Bio-Rad). Gene expression was quantified by qPCR with RT2 qPCR primer assays for human ACTB, COL2A1, TNXB, THBS3, and THBS4 or mouse Col2a1, Tnxb, Thbs3, Thbs4, and Gapdh (Qiagen) and SsoAdvanced SYBR Green Supermix (Bio-Rad) using a CFX qPCR machine (Bio-Rad).
Immunoblot analysis
Snap-frozen tumor fragments were homogenized using the TissueLyser (Qiagen) and lysed in buffer containing 50 mM Tris-HCl pH 8.0, 150 mM NaCl, 2 mM EDTA pH 8.0, 10 mM NaF, 20% glycerol, 1% Nonidet P-40 plus protease and phosphatase inhibitors. Cells grown in culture were washed with ice-cold PBS and lysed on ice in buffer containing 20 mM Tris pH 7.4, 150 mM NaCl, 1% Nonidet P-40, 0.1 mM EDTA plus protease and phosphatase inhibitors. After centrifugation, protein concentration in supernatants was measured using the BCA protein assay reagent (Pierce). Lysates were mixed with β-mercaptoethanol-containing sample buffer, heated to 95°C for 5 min, resolved on SDS-PAGE gels, and then transferred to nitrocellulose membranes (Bio-Rad). Primary antibodies included P-HER3 Y1289, P-HER2 Y1221/2, P-HER2 Y1248, HA tag, P-Akt S473, P-Akt T308, total Akt, P-Erk-T202/Y204, total Erk, P-S6 S240/244, P-4EBP1 T37/46, P-Src Y416, Integrin β1, and β-actin (Cell Signaling), active Integrin β1 (Millipore; sample run in non-reducing conditions without β-mercaptoethanol in sample buffer and heated at 70°C for 10 min), mouse THBS4 (R&D systems), and HER2/ERBB2 (Neomarkers). Antibody dilutions are described in Supplementary Table 1. Immuno-reactive bands were detected by enhanced chemiluminescence (Thermo Fisher Scientific) following incubation with horseradish peroxidase-conjugated secondary antibodies (Promega). Membranes were cut horizontally to probe with multiple antibodies. Immunoblot bands were quantified from inverted images using ImageJ software.
Histochemical staining and immunohistochemistry (IHC)
Tumor fragments were harvested and immediately fixed in 10% buffered neutral formalin for 24 h at room temperature, then dehydrated and paraffin-embedded. Five-μm sections were subjected to H&E staining and IHC using antibodies against P-Src Y416 (Cell Signaling), Tenascin C (Sigma-Aldrich), and Collagen II (Abcam). Trichrome staining (Sigma-Aldrich) was performed according to the manufacturer's instructions. Picrosirius red staining was performed by the Vanderbilt Translational Pathology Shared Resource. Images were captured using Olympus DP2 software on an Olympus light microscope. Quantification of histochemistry and IHC is described in Supplementary Materials and Methods.
Cell viability and proliferation assays
To determine cell viability in the presence of drugs cells were seeded in 96-well plates at a density of 2,500-5,000 cells per well. The next day, media was replaced with 100 μl of EGF-free media containing 1% charcoal-stripped serum (CSS) ± inhibitors. After 3-5 days, 10 μl of Alamar Blue reagent (Invitrogen) was added to each well and incubated at 37°C for 3-4 h. Fluorescence was measured using the Glomax plate reader (Promega). Alternatively, cells were stained with ReadyProbes Cell Viability Imaging Kit (Thermo Fisher Scientific) and viable cells were quantified using the Cellavista cell imager (Synentec Bioservices). Collagen I-coated 96-well plates were purchased from Corning.
For proliferation assays, cells (5,000-20,000/well) were seeded in 24-well plates (Corning). Where indicated, wells were pre-coated with 10% growth factor-reduced Matrigel (BD Biosciences) in PBS. Collagen I-coated plates were purchased from Corning. Collagen II-coated 24-well plates were generated by coating wells with 350 μL of 0.05 mg/mL Collagen II (Sigma-Aldrich). Wells were allowed to air dry and rinsed with 70% ethanol and PBS prior to seeding cells. The next day, media was replaced with 500 μl of EGF-free media containing 1% charcoal-stripped serum (CSS) and inhibitors in triplicate. Media was replaced twice weekly. After 6-10 days, cells were fixed and stained with PBS containing 2% formaldehyde, 1% methanol, and 0.05% crystal violet, rinsed with water 3 times, allowed to air dry, and then imaged with a flatbed scanner. Crystal violet staining was quantified using ImageJ software or an Odyssey scanner. To measure cell number, cells were trypsinized after 4-5 days, diluted 1:40 in filtered isoton buffer, and counted using a Coulter Counter (Beckman Coulter).
Gene expression analysis—NeoSphere trial
The results of the NeoSphere trial were previously published (5). All tumors were centrally confirmed to be HER2-positive operable or locally advanced breast cancer and were randomized into four different neoadjuvant therapies including the two treatment arms considered in this study: trastuzumab plus pertuzumab (HP) and pertuzumab and trastuzumab plus docetaxel (THP). The primary endpoint of the study was pathological complete response (pCR) in the breast. RNA was extracted from formalin-fixed paraffin-embedded (FFPE) core biopsies as previously reported (17). Gene expression analysis is described in Supplementary Materials and Methods.
Patients' tumors
FFPE tumor sections of pre-treatment biopsies from a cohort of 30 de-identified patients with operable HER2+ breast cancer (Supplementary Table 2) at Vanderbilt University Medical Center were stained with collagen II. One sample was not available for analysis. Patients had been treated with standard of care neoadjuvant chemotherapy/trastuzumab ± pertuzumab. Following neoadjuvant therapy, 13 tumors (43.3%) achieved a pathological complete response whereas 17 tumors (56.7%) did not and were still detectable in the mastectomy specimen. All patient studies were conducted in accordance with the Declaration of Helsinki.
Pre-treatment biopsies and post-treatment surgical samples from the 17 patients with residual disease following neoadjuvant chemotherapy + trastuzumab ± pertuzumab were stained with Trichrome. Informed consent was obtained from all patients. Use of patient samples was supported by Vanderbilt-approved IRB protocol #151068.
Statistical analysis
Unless otherwise indicated, the student's t-test was used. T-tests, ANOVA, and multiple comparisons tests were conducted using GraphPad Prism (GraphPad Software). Results are represented as mean ± SD unless noted otherwise. Power calculations were performed using PS: Power and Sample Size Calculation software (http://biostat.mc.vanderbilt.edu/wiki/Main/PowerSampleSize). Animal experiments were conducted in a controlled and non-blinded manner. In vitro experiments were performed at least two times and at least in triplicate each time.
Data availability
The whole exome and RNA-sequencing data is available at the Sequence Read Archive at NCBI, BioProject ID PRJNA380823. The authors declare that all other data supporting the findings of this study are available within the article and its supplementary files or from the authors upon a reasonable request.
Results
Generation of HER2+/PIK3CAH1047R mammary tumors resistant to trastuzumab + pertuzumab + PI3K inhibitors
We previously showed that transgenic HER2+/PIK3CA mouse mammary tumors responded to the combination of TPB (9). To generate tumors resistant to TPB, spontaneous mammary tumors from HER2+/PIK3CAH1047R mice (transgenic mouse #564 and #635) were minced, homogenized, and transplanted into recipient nude mice. A subset of transplanted tumors was left untreated, whereas 10-11 tumors were treated with TPB for >3 weeks (Fig. 1A and Supplementary Fig. 1A). While the majority of #564 tumors responded, 3 tumors (#2, 7, and 14) resumed growth in the presence of TPB. Tumors that reached >1500 mm3 in the presence of continuous therapy were deemed TPB-resistant (Fig. 1B). The majority of the treated #635 tumors regressed to <50 mm3. Treatment was stopped and then resumed when tumors reached 200 mm3. Two of 5 retreated tumors continued to grow in the presence of therapy (Supplementary Fig. 1B). These TPB-resistant tumors were then harvested, transplanted into nude mice, and re-treated with TPB. All tumor transplants maintained expression of the TetOp-PIK3CAH1047R-IRES-Luciferase transgene by bioluminescent imaging. In addition, immunoblot analysis confirmed that HER2 and HA-p110α expression was maintained (Fig. 1C). TPB resistance was maintained in all tumor transplants (Fig. 1D and Supplementary Fig. 1C,D).
Fig. 1. HER2+/PIK3CAH1047R mammary tumors acquire resistance to trastuzumab + pertuzumab + BKM120.

(A) A spontaneous mammary tumor from HER2/PIK3CAH1047R transgenic mouse (#564) was harvested, homogenized, and injected into the mammary fat pads of recipient nude mice. Six recipient nude mice were left untreated, whereas the remaining 9 mice were treated with trastuzumab (30 mg/kg i.p. twice/week), pertuzumab (30 mg/kg i.p. twice/week), and BKM120 (30 mg/kg p.o. daily) for 4-7 weeks. Resistant tumors were defined as tumors that reached a volume of >1500 mm3 during treatment. (B) HER2/PIK3CAH1047R tumor allografts (>200 mm3) from mouse #564 were treated with trastuzumab + pertuzumab + BKM120 (TPB). Each line represents an individual tumor. Untreated control tumors are shown in black (*, TPB-resistant). (C) Lysates from parental tumors ± TPB (treated for 96 h) and drug-resistant tumors grown continuously in TPB were subjected to immunoblot analysis with the indicated antibodies. Tumor #2-9 refers to a transplanted tumor derived from TPB-resistant tumor #2, tumor #7-16 is derived from resistant tumor #7, etc. (D) TPB-resistant tumor #564-2 was harvested, homogenized, and injected into the mammary fat pads of recipient nude mice. When tumors reached >200 mm3, mice were treated with trastuzumab, pertuzumab, and either BKM120 (30 mg/kg p.o. daily) or BYL719 (30 mg/kg p.o. daily) for 2 weeks. Each data point represents the mean tumor volume in mm3 ± S.E.M.
Short-term treatment (96-h) with TPB inhibited P-AKT and P-S6 in drug-sensitive parental tumors (Fig. 1C). P-AKT remained suppressed in drug-resistant tumors grown in the presence of TPB, suggesting that PI3K was still inhibited. A reduction in total AKT levels was also observed in a subset of TPB-resistant tumors. In contrast, P-S6 was partially restored in TPB-resistant tumors, suggesting that the mTOR pathway had been reactivated by a PI3K-independent mechanism. Finally, TPB-resistant tumors were cross-resistant to the combination of T + P + alpelisib (BYL719), a p110α-specific inhibitor (18) (Fig. 1D), suggesting that the mechanisms of resistance are not inhibitor-specific but rather confer resistance to the combination of HER2 and PI3K inhibitors in general.
ECM/cell adhesion genes are upregulated in TPB-resistant tumors
In order to identify the mechanisms of TPB resistance in the transgenic tumors, we first performed whole exome sequencing (WES) on genomic DNA isolated from untreated parental (n=4) and TPB-resistant (n=4) tumors from the #564 line. DNA from a HER2+/PIK3CAH1047R mouse liver was used as germline control. We did not identify any alterations in the MMTV-HER2 or TetOp-PIK3CA transgenes, nor in wild-type mouse Erbb2 and Pik3ca alleles (data not shown). In fact, the vast majority of alterations identified were found to be nude mouse SNPs. No recurrent genomic alterations were found in TPB-resistant tumors, suggesting the drug resistance was not due to acquired mutations.
Next, we performed RNA-seq on untreated parental tumors (n=3) and drug-resistant tumors (grown continuously in TPB; n=6; all from the #564 line) to examine changes in gene expression; 592 genes were upregulated >2.8-fold (adjusted p value [q] <0.05) in drug-resistant relative to parental drug-sensitive tumors (Supplementary Table 3). Functional annotation clustering on this list of genes using the DAVID bioinformatics resource found highly significant upregulation of genes encoding glycoproteins (280 genes; Benjamini P = 9.5 × 10-56), extracellular matrix (ECM) proteins (56 genes; Benjamini P = 5.8 × 10⁻²²), and cell adhesion proteins (59 genes; Benjamini P = 1.8 × 10⁻¹²) in TPB-resistant tumors (Fig. 2A). Since many of the glycoproteins overlapped with the ECM and cell adhesion genes, we narrowed our focus to the latter two gene lists. Changes in these genes were consistent across the majority of TPB-resistant tumors (Fig. 2B). ECM and cell adhesion genes that were significantly upregulated in drug-resistant tumors included 6 collagens, 4 integrins, the laminin Lama2, vitronectin (Vtn), 2 thrombospondins (Thbs3 and Thbs4), and the tenascin Tnxb (Supplementary Table 3). Immunoblots of tumor lysates confirmed upregulation of the mouse Thbs4 protein in TPB-resistant grafts (Fig. 2C) and IHC analysis revealed upregulation of stromal Tenascin C (Fig. 2D,E) as well as a drastic increase in fibrillar collagens by trichrome and picrosirius red staining (Fig. 2D,F).
Fig. 2. RNA Sequencing of TPB-resistant tumors reveals upregulation of ECM/cell adhesion pathways.

(A) RNA was isolated from snap-frozen untreated parental (n=3) and TPB-resistant tumors treated with TPB (n=6) and subjected to RNA sequencing. A list of 592 mouse genes that were upregulated >2.8-fold in TPB-resistant tumors was submitted for functional annotation clustering using the DAVID bioinformatics resource. (B) Normalized gene expression is shown for 86 differentially expressed genes in the DAVID extracellular matrix/extracellular region cluster. Three untreated parental tumors and two samples from each TPB-resistant tumor line (564-2, 564-7, and 564-14) were analyzed. (C) Lysates from parental tumors (#564 model) ± TPB (treated for 96 h) and drug-resistant tumors grown continuously in TPB were subjected to immunoblot analysis with the indicated antibodies. (D) FFPE sections from untreated parental (n=4) and TPB-resistant (n=7) tumors were subjected to histochemical staining or IHC with the indicated stains or antibodies, respectively. Representative images are shown. (E) Tenascin C (TNSC) stromal staining was quantified as described in Methods. (F) Picrosirius Red was quantified using ImageJ as described in Methods. Values are presented as mean ± S.E.M (*p<0.05, student's t-test).
To determine if these findings were consistent in the #635 line, we also performed RNA-seq on untreated parental tumors (n=3) and drug-resistant tumors (n=6) from this independent cohort (Supplementary Fig. 1B). Supplementary table 3 lists the genes that were significantly upregulated in both lines (q<0.05). Of the ECM genes, Col2a1, the gene encoding Collagen II, was the most highly upregulated in both TPB-resistant lines (upregulated 10.2-fold in #564 and 9.6-fold in #635 TPB-resistant tumors, respectively). Increased expression of Col2a1 in TPB-resistant tumors was confirmed by qRT-PCR (Supplementary Fig. 1E).
The integrin family of receptors mediates the interaction between ECM components such as collagens and the cellular cytoskeleton (19). In particular, integrin α2β1 and α10β1 bind to collagen II (20). Furthermore, integrin β1 is involved in breast cancer progression and drug resistance (21,22). We found that the activated form of integrin β1, detected by western blot with an antibody specific to the activated form, is induced 96 h after TPB treatment initiation and remains active in TPB-resistant tumors (Fig. 2C). In addition, phosphorylation of Src, a kinase downstream of integrin β1, was markedly upregulated in TPB-resistant tumors (Fig. 2C,D). Together, these data point to a stromal response and activation of the integrin β1/Src pathway upon acquisition of drug resistance.
The increase in ECM-related gene expression in TPB-resistant tumors could be due to tumor cell-autonomous upregulation of these genes and/or due to a general increase in stromal content in TPB-resistant tumors. Thus, we examined whether TPB treatment induced expression of the ECM genes identified by the RNA-seq data in tumor cells in vitro. We found that a 24-h treatment with TPB significantly increased Col2a1, Tnxb, and Thbs3 mRNA expression in primary tumor cells (PTCs) derived from parental HER2+/PIK3CAH1047R tumors (Fig. 3), suggesting that, at least in part, the induced expression of these genes is tumor cell autonomous. We extended these findings to HER2+, PIK3CAH1047R human breast cancer cell lines MDA-MB 453 and HCC1954. Treatment for 24 h with T + P + buparlisib (HCC1954) or T + P + alpelisib (MDA-MB 453) also increased expression of COL2A1, TNXB, THBS3, and THBS4 as measured by qRT-PCR.
Fig. 3. Short-term inhibition of HER2 and PI3K induces expression of ECM genes in HER2+ breast cancer cells.

MDA-MB 453 and HCC1954 cells, and HER2/PIK3CAH1047R primary tumor cells (PTCs) were treated with 10 μg/mL trastuzumab, 10 μg/mL pertuzumab and 1 μM BYL719 (MDA-MB 453) or 1 μM BKM120 (HCC1954, PTCs) for 24 h. RNA was isolated, reverse transcribed, and subjected to qPCR with the indicated primers. Expression levels were normalized to human ACTB (MDA-MB 453, HCC1954) or mouse Gapdh (PTCs). The fold change in expression levels from TPB-treated compared to control cells are presented as mean ± S.D. of 3 technical replicates (**p<0.01, ***p<0.001, ****p<0.0001, student's t-test).
ECM/integrin/Src signaling promotes resistance to HER2 and PI3K inhibitors
We isolated primary tumor cells from parental and TPB-resistant mouse tumors. All cells retained luciferase (Supplementary Fig. 2A), HER2 and HA-p110α expression (Fig. 4A). P-SrcY416 was elevated in tumor cells from TPB-resistant tumors. Of note, cells from drug-resistant tumors were inhibited by TPB to the same degree as cells from parental tumors in an in vitro alamar blue assay (Fig. 4B). Similar results were obtained when cells were grown in low serum and viable nuclei were quantified (Supplementary Fig. 2B). These data suggest that a component of the in vivo tumor microenvironment that is absent in vitro contributes to drug resistance. Finally, we maintained these same cells in culture for >1 month and then injected them into nude mice. Tumors resulting from parental cancer cells retained sensitivity to TPB, whereas tumors from cells derived from the TPB-resistant tumors were once again highly resistant to therapy (Fig. 4C).
Fig. 4. Primary tumor cells derived from TPB-resistant tumors lose resistance in vitro.
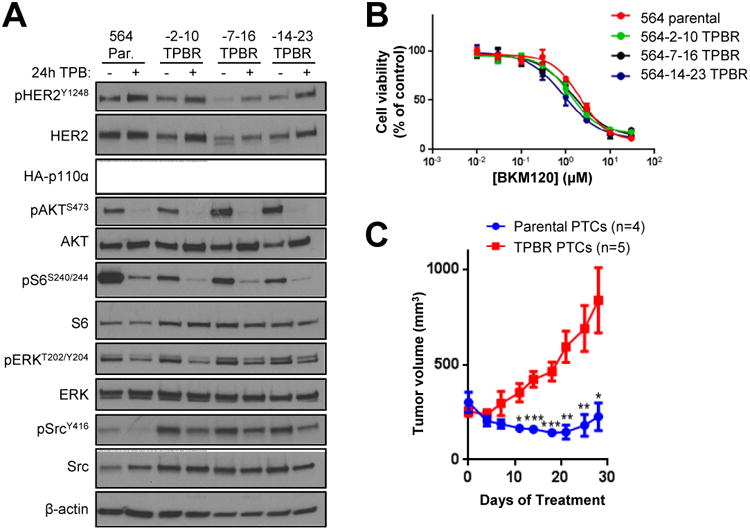
(A) Primary tumor cells were derived from HER2/PIK3CAH1047R parental and TPB-resistant tumors. Cells were treated ± 10 μg/ml trastuzumab, 10 μg/ml pertuzumab, and 1 μM BKM120 for 24 h. Cell lysates were analyzed with the indicated antibodies. (B) Primary tumor cells were treated with trastuzumab, pertuzumab, and increasing concentrations of BKM120 for 3 days. Cell viability was measured using the alamar blue assay. Values represent the mean ± S.D. of at least 4 technical replicates. Results are representative of at least 2 independent experiments. (C) Primary tumor cells grown in culture for >1 month were injected subcutaneously in nude mice. When tumors reached >200 mm3, mice were treated with trastuzumab + pertuzumab + BKM120 for 4 weeks. Each data point represents the mean tumor volume in mm3 ± S.E.M. (*p<0.05, **p<0.01, ***p<0.001, student's t-test).
To determine whether components of the ECM are causal to TPB resistance, we seeded tumor cells on either uncoated 24-well tissue culture plates or on plates coated with growth factor-reduced Matrigel, a basement membrane matrix primarily composed of laminin and collagen IV. We treated cells ± TPB for 6 days and then stained the monolayers with crystal violet. Cells grown on Matrigel were significantly less sensitive to TPB compared to cells grown in the absence of Matrigel (Fig. 5A,B). Furthermore, P-SrcY416 was increased in tumor cells grown on Matrigel (Fig. 5C). Likewise, we found that cells grown on Collagen I or II were less sensitive to trastuzumab + pertuzumab + buparlisib or alpelisib (Fig. 5D,E). Collagen I increased phosphorylation of the FAK and paxillin, downstream targets of Src (Fig. 5F). In addition, plating MDA-MB 453 HER2+ breast cancer cells on a collagen I-coated surface reduced their sensitivity to trastuzumab + pertuzumab + buparlisib or alpelisib (Supplementary Fig. 3). Taken together, these data suggest that ECM components, such as collagens, can activate downstream targets of Src and induce resistance to combined inhibition of HER2 and PI3K.
Fig. 5. ECM components promote resistance to HER2 and PI3K inhibition.

(A) Primary tumor cells were seeded on 24-well plates coated ± 10% growth factor-reduced Matrigel and treated with 10 μg/ml trastuzumab, 10 μg/ml pertuzumab and 2 μM BKM120 (TPB) for 6 days. Cell monolayers were stained with crystal violet. (B) Quantification of (A) using ImageJ software; % survival of TPB-treated cells compared to untreated controls is shown. Each bar represents the mean image intensity ± S.D. of at least 3 replicates. (C) Cells derived from parental tumors were seeded on plates coated ± Matrigel and treated as in (A). (D) #564 parental and (E) TPB-resistant cells were plated on uncoated or Collagen I- or II-coated 24-well plates and treated with trastuzumab, pertuzumab, and 1-2 μM BKM120 or 1 μM BYL719 for 4 days. Cells were trypsinized and counted using a Coulter counter. Each bar represents the mean cell number ± S.D. of at least 3 replicates. (*p<0.01, **p<0.01, ***p<0.001, ****p<0.0001, 2-way ANOVA followed by Bonferroni's multiple comparison test). All experiments were performed in media containing 1% FBS. (F) Parental HER2+/PIK3CAH1047R tumor cells were seeded on uncoated or Collagen I-coated plates and treated as in (D). Cell lysates were subjected to immunoblot analysis with the indicated antibodies. Bar graphs represent quantification of immunoblot bands using ImageJ software.
Given that collagens, in particular collagen II, were upregulated in TPB-resistant tumors and promoted resistance to TPB in vitro, we asked whether collagen secretion is required for TPB resistance in vivo. We used the prolyl hydroxylase inhibitor DHB, known to compromise collagen processing and thus prevent collagen I and II secretion in vivo (23,24). DHB treatment had no effect on parental HER2+/PIK3CAH1047R tumor growth (Fig. 6A). In contrast, DHB significantly attenuated growth and reduced collagen II and pSrcY416 levels of TPB-resistant tumors (Fig. 6B-D). These results suggest that collagens are a key ECM component responsible for mediating TPB resistance.
Fig. 6. Enhanced collagen secretion promotes TPB resistance through integrin β1 and Src.

(A) #564 parental tumor transplants were treated ± 40 mg/kg DHB daily beginning the day after tumor cell injection (arrow). Each data point represents mean tumor volume in mm3 ± S.E.M. (n=10 per arm). (B) #564-14 TPB-resistant tumor transplants were treated 40 mg/kg DHB daily beginning the day after tumor cell injection (arrow). All mice received trastuzumab + pertuzumab + buparlisib beginning 13 days after tumor cell injection. Each data point represents mean tumor volume in mm3 ± S.E.M. (n=10 and 7, respectively; *p<0.05; **p<0.01, student's t-test). (C) FFPE sections TPB-resistant tumors in (B) were subjected to Collagen II IHC. Representative images are shown. (D) Lysates from the TPB-resistant tumors in (B) were subjected to immunoblot analysis with the indicated antibodies (n=4 per arm). (E) Tumor cells derived from parental tumors were seeded on collagen I-coated plates and treated with 10 μg/ml Ha2/5 (Integrin β1 inhibitor), 1 μM saracatinib (Src inhibitor), or 1 μM dasatinib (Src inhibitor) ± TPB (10 μg/ml trastuzumab + 10 μg/ml pertuzumab + 1 μM BKM120) for 4 days. Cells were trypsinized and counted using a Coulter counter. Each bar represents the mean cell number ± S.D. of at least 3 replicates (**p<0.01, 2-way ANOVA followed by Bonferroni's test). (F) Tumor cells were treated as in (A) for 24 h. Lysates were subjected to immunoblot analysis with the indicated antibodies. (G) #564-14 TPB-resistant tumor allografts were treated with trastuzumab, pertuzumab, and BKM120 ± saracatinib (50 mg/kg daily) for 2 weeks. Each data point represents mean tumor volume in mm3 ± S.E.M. (n=11 and 13, respectively; *p<0.05, student's t-test).
We next tested whether the integrin β1/Src pathway mediates collagen-induced TPB resistance. We plated cells from parental drug-sensitive tumors on collagen-coated plates and treated them with TPB ± the mouse integrin β1 blocking antibody Ha2/5 or each of the Src inhibitors saracatinib and dasatinib. Treatment with Ha2/5 modestly sensitized to TPB, whereas treatment with each Src inhibitor markedly increased TPB sensitivity, suggesting that collagen-induced activation of the integrin β1/Src pathway can induce resistance to TBP (Fig. 6E). Consistent with the cell proliferation data, treatment with dasatinib and saracatinib inhibited phosphorylated Src, FAK, paxillin, and HER2Y877, a putative Src substrate, more potently than Ha2/5 (Fig. 6F). Finally, treatment with TPB + saracatinib delayed TPB-resistant tumor growth in vivo (Fig. 6G). Together, these results suggest that the Src pathway mediates collagen-induced resistance to combined inhibition of HER2 and PI3K.
We have reported that TGFβ induces integrin/HER2 clustering through Src and FAK (25). To determine if the TGFβ pathway is involved in collagen-induced Src activation and TPB resistance, we plated cells from parental drug-sensitive tumors on collagen-coated plates and treated them with TPB ± the TβR1 inhibitor LY2157299 (LY99) (26). Treatment with LY99 did not affect Collagen-induced TPB resistance in this assay (Supplementary Fig. 4A), nor did it affect collagen-induced Src activation (Supplementary Fig. 4B), suggesting that TGFβ is not involved in collagen-induced TPB resistance.
High collagen II expression correlates with a lesser clinical response to neoadjuvant anti-HER2 therapy in patients
We next investigated whether any of the ECM/cell adhesion genes that were upregulated in the TPB-resistant tumors are associated with response to neoadjuvant anti-HER2 therapy. To this end, we interrogated gene expression data from patients in the NeoSphere trial (5,17), a randomized phase II trial in which 417 patients with operable or locally advanced HER2+ breast cancer were treated with neoadjuvant docetaxel/trastuzumab (TH), docetaxel/pertuzumab (TP), docetaxel/trastuzumab/pertuzumab (THP), or trastuzumab/pertuzumab (HP). For this analysis and in line with the work shown above, we focused on the two treatment arms containing both HER2 antibodies, THP (n=107) and HP (n=107). The rate of pathologic complete response (pCR) was 45.8% in the THP arm and 16.8% in the HP arm. We asked whether the 98 ECM or cell adhesion genes (the colored genes in Supplementary Table 3) that were upregulated in the TPB-resistant mouse tumors were associated with a reduced rate of pCR in these datasets. Of these 98 genes, 93 had corresponding probe sets in the gene expression arrays. Only 2 of these genes in the THP arm (COL2A1 and PODXL2, which encodes a CD34 family transmembrane protein) and 1 gene (the cadherin CELSR1) in the HP arm were significantly higher in tumors that did not achieve a pCR compared to those that did (parametric p values <0.05; Supplementary Table 4). In particular, COL2A1 was the most highly upregulated gene in tumors without a pCR in the THP arm (fold change in no pCR/pCR=1.61, p=0.0055), also exhibiting a trend in the HP arm (fold change=1.58, p=0.12; Fig. 7A).
Fig. 7. High collagen II correlates with lack of pathological complete response after anti-HER2 therapy.

(A) Gene expression of COL2A1 according to response to neoadjuvant therapy was interrogated in pre-treatment biopsies from the NeoSphere dataset. P-values were determined by the Wilcoxon test. (B) FFPE tumor sections of pre-treatment biopsies of 29 primary HER2+ breast cancers were subjected to IHC with an antibody to Collagen II as indicated in Methods. Patients underwent neoadjuvant treatment with chemotherapy/trastuzumab ± pertuzumab. Bars represent the mean staining score ± S.E.M. (**p=0.0011, student's t-test). (C) Representative collagen II staining grades of 1, 2, 3 or 4 (top left boxes) are shown.
We next extended these findings to a second clinical cohort. Col2a1, the gene encoding collagen II, was strongly induced in TPB-resistant tumors (increased ∼10-fold in TPB-resistant tumors from #564 and #635 lines; Supplementary Table 3). Further, plating cells on collagen II decreased sensitivity to TPB (Supplementary Fig. 3A). Thus, we performed IHC for collagen II on 29 available pre-treatment biopsies from a cohort of 30 patients with HER2+ breast cancer treated with neoadjuvant anti-HER2 therapy + chemotherapy at Vanderbilt University Medical Center, where the pCR rate was 43.3% or 13/30 patients (Supplementary Table 2). Pre-treatment Collagen II staining was significantly higher (p=0.0011) in the 16 available pre-treatment biopsies (one sample was not available) from tumors that did not have a pCR to neoadjuvant therapy (Fig. 7B,C).
Finally, we asked whether treatment with neoadjuvant anti-HER2 therapy increased collagen deposition in the 17 drug-resistant HER2+ breast cancers that remained after treatment. We stained pre- and post- chemotherapy/trastuzumab ± pertuzumab sections of tumors with trichrome. The degree of fibrosis measured by trichrome staining was significantly increased in the post-treatment residual tumor sections (Supplementary Fig. 5A-C). Consistent with these data, trichrome staining was also increased in primary HER2/PIK3CAH1047R transgenic mouse tumors, reported as intrinsically resistant to anti-HER2 therapy (9), treated with trastuzumab/pertuzumab without chemotherapy (Supplementary Fig. 5D).
Discussion
Activating mutations in the PI3K pathway are associated with resistance to therapies targeted to the HER2 oncogene (9-11,27). In addition, the catalytic subunit of PI3K, p110α, is required for HER2/Neu-induced mammary tumorigenesis and mutational activation of p110α enhances HER2-driven cancer progression (9,28). Therefore, combinations of HER2 and PI3K inhibitors are in early clinical trials in patients with HER2+ breast cancer. In this study, we generated a mouse model of acquired resistance to combined HER2 and PI3K inhibition in HER2+, PIK3CA-mutant mammary tumors by prolonged treatment with HER2 and PI3K inhibitors. We found that expression of ECM and cell adhesion genes were highly upregulated in TPB-resistant tumors, accompanied by increased trichrome staining and activation of integrin β1/Src signaling. Primary tumor cells derived from resistant tumors required collagens to maintain resistance in vitro and TPB resistance was abrogated by integrin β1/Src inhibition, suggesting that enhanced ECM/integrin β1/Src signaling is causal to the resistance to the combination of HER2 and PI3K inhibitors.
Several studies suggest that tumor microenvironment contributes to drug resistance in part through ECM and integrin signaling. Increased ECM deposition may impede drug delivery by restricting blood flow through the tumor (19). However, in our model, TPB treatment continued to block pAKT in resistant tumors (Fig. 1C), suggesting that ECM components promote resistance through alternative mechanisms. Microenvironment rigidity was shown to promote lapatinib resistance via YAP and TAZ transcription factors (29). Whether YAP and TAZ are involved in TPB resistance in our model has not been addressed. We showed that collagen I and II directly promote resistance to TPB treatment in vitro at least in part through integrin β1/Src signaling. Similarly, ECM/Integrin β1/Src/FAK signaling was shown to maintain a drug-tolerant microenvironment supporting ERK re-activation and resistance to BRAF inhibition in BRAF-mutant melanoma (30). In this study, treatment with saracatinib blocked pERK in TPB-resistant primary tumor cells (Fig. 6F), suggesting that integrin β1/Src signaling promotes activation of the MEK/ERK pathway in these cells. In addition, ALK inhibition was shown to increase ECM gene expression and phospho-paxillin in ALK-mutant lung cancer, with Src inhibition restoring sensitivity to ALK inhibitors (31). In breast cancer, integrin β1 was shown to promote resistance to chemotherapy and tamoxifen via activation of PI3K/Akt (32,33). Integrin β1 was also shown to promote resistance to trastuzumab + lapatinib by maintaining PI3K and ERK signaling; resistance was abrogated by an integrin β1-blocking antibody (22). Finally, Brugge and colleagues found that matrix-attached cells in ovarian cancer spheroids grown in Matrigel were resistant to apoptosis induced by the PI3K/mTOR inhibitor BEZ235, whereas matrix-deprived inner cells were sensitive (34). However, ours is the first study to show that ECM/collagen/integrin signaling promotes resistance to inhibition of HER2/PI3K in HER2+ breast cancer. While collagens are known to be involved in tumor progression (35), the role of collagen II in particular has been less studied. Recently, secretion of collagen II was shown to drive tumor growth and angiogenesis, which was blocked by an inhibitor of collagen synthesis (23). We further found that high collagen II expression correlated with a poor response to neoadjuvant anti-HER2 therapy in patients with early HER2+ breast cancer (Fig. 7). We recognize that treatment of the patient cohort analyzed did not include PI3K inhibitors, which are part of the combination studied herein. However, at this time and to the best of our knowledge, tumor collections from patients treated with the combination of HER2 and PI3K inhibitors are not available, as these trials are in early phases of development.
Although stromal ECM secretion is traditionally thought to be driven by fibroblasts, we found that short-term TPB treatment also increased autocrine production of several ECM genes in tumor cells (Fig. 3). The mechanism by which HER2/PI3K inhibition promotes expression of these genes is currently not known. Future studies will investigate whether these genes are targets of FOXO transcription factors, which are upregulated following PI3K inhibition (36). It is unclear whether the increase in collagen and other ECM genes in TPB-resistant tumors originated primarily from the tumor stroma or the tumor cells themselves. Although we observed an increase in autocrine expression of Col2a1 and other ECM genes, we cannot rule out a role for stromal cells in the increased expression of ECM components and ultimate drug resistance. We found that inhibition of collagen secretion in vivo reduces, but does not completely reverse, drug resistance (Fig. 6), suggesting that either 1) DHB treatment did not sufficiently block TPB-induced Collagen II secretion, or 2) other factors, potentially other components of the ECM, contribute to this resistance.
Our laboratory previously reported that Src activation promotes resistance to the HER2/EGFR tyrosine kinase inhibitor lapatinib (37), but whether Src activation was due to enhanced ECM/integrin signaling was not investigated. Recently, knockdown of Src was found to sensitize ER+ breast cancer cells to the PI3Kα inhibitor alpelisib in a large-scale screen (38). However, the role of Src in resistance to PI3K inhibitors was not pursued further. Our data further show that activation of the Src pathway promotes resistance to combined inhibition of HER2 and PI3K. Increased expression of soluble factors such as HGF and IGF1 has also been shown to contribute to resistance to PI3K inhibitors (39). We note that the Igf1 and Hgf genes were also significantly increased (7.3-fold and 4.1-fold respectively) in the TPB-resistant tumors (Supplementary Table 3) and may contribute to the observed maintenance of pS6 (Fig. 1C). Finally, we found marked upregulation of Fgf10 and Fgf9 in resistant tumors. Notably, FGF10 knockdown was shown to sensitize breast cancer cells to alpelisib (38). Future studies will determine whether upregulation of these growth factors further contribute to resistance to HER2 and PI3K inhibitors in primary tumors.
In conclusion, we show that HER2+/PIK3CA-mutant mammary tumors with acquired resistance to HER2/PI3K inhibitors significantly upregulate ECM genes such as collagens, integrins, laminin, vitronectin, thrombospondins and tenascin. Primary tumor cells derived from resistant tumors required collagens to maintain resistance in vitro. In addition, inhibition of integrin β1/Src reversed ECM-induced TPB resistance in vitro and in vivo. Finally, elevated collagen II expression correlated with a diminished response to neoadjuvant anti-HER2 therapy in patients with operable HER2+ breast cancer. These data support the clinical investigation of HER2 and PI3K inhibitors in combination with integrin β1 or Src inhibitors in HER2+, PI3K-mutant breast cancer.
Supplementary Material
Acknowledgments
We thank Roy Zent for the Ha2/5 antibody, David Riddle for expert technical assistance, Phil Owens for technical advice, VANTAGE for performing the next-generation sequencing, and F. Hoffmann-LaRoche for access to data from the NeoSphere study.
Financial Support: This work was supported by NIH/NCI K12 Award CA090625 (A. B. Hanker); Associazione Italiana per la Ricerca sul Cancro (AIRC) grant MFGA 13428 (G. Bianchini); NCI grant 1K08CA143153 (B. N. Rexer); NCI grant 1K08CA148912 (T. P. Stricker); NCI R01 grant CA080195 (C. L. Arteaga); ACS Clinical Research Professorship Award CRP-07-234-06-COUN (C. L. Arteaga); NIH Breast Cancer Specialized Program of Research Excellence (SPORE) grant P50 CA98131 (A. B. Hanker and C. L. Arteaga); and Vanderbilt-Ingram Cancer Center Support Grant P30 CA68485 (C. L. Arteaga).
Footnotes
Conflict of Interest: The authors disclose no potential conflicts of interest.
References
- 1.Arteaga CL, Sliwkowski MX, Osborne CK, Perez EA, Puglisi F, Gianni L. Treatment of HER2-positive breast cancer: current status and future perspectives. Nat Rev Clin Oncol. 2012;9:16–32. doi: 10.1038/nrclinonc.2011.177. [DOI] [PubMed] [Google Scholar]
- 2.Gradishar WJ. Emerging approaches for treating HER2-positive metastatic breast cancer beyond trastuzumab. Ann Oncol. 2013;24:2492–500. doi: 10.1093/annonc/mdt217. [DOI] [PubMed] [Google Scholar]
- 3.Baselga J, Bradbury I, Eidtmann H, Di Cosimo S, de Azambuja E, Aura C, et al. Lapatinib with trastuzumab for HER2-positive early breast cancer (NeoALTTO): a randomised, open-label, multicentre, phase 3 trial. Lancet. 2012;379:633–40. doi: 10.1016/S0140-6736(11)61847-3. [DOI] [PMC free article] [PubMed] [Google Scholar]
- 4.Swain SM, Kim SB, Cortes J, Ro J, Semiglazov V, Campone M, et al. Pertuzumab, trastuzumab, and docetaxel for HER2-positive metastatic breast cancer (CLEOPATRA study): overall survival results from a randomised, double-blind, placebo-controlled, phase 3 study. Lancet Oncol. 2013;14:461–71. doi: 10.1016/S1470-2045(13)70130-X. [DOI] [PMC free article] [PubMed] [Google Scholar]
- 5.Gianni L, Pienkowski T, Im YH, Roman L, Tseng LM, Liu MC, et al. Efficacy and safety of neoadjuvant pertuzumab and trastuzumab in women with locally advanced, inflammatory, or early HER2-positive breast cancer (NeoSphere): a randomised multicentre, open-label, phase 2 trial. Lancet Oncol. 2012;13:25–32. doi: 10.1016/S1470-2045(11)70336-9. [DOI] [PubMed] [Google Scholar]
- 6.Swain SM, Baselga J, Kim SB, Ro J, Semiglazov V, Campone M, et al. Pertuzumab, trastuzumab, and docetaxel in HER2-positive metastatic breast cancer. N Engl J Med. 2015;372:724–34. doi: 10.1056/NEJMoa1413513. [DOI] [PMC free article] [PubMed] [Google Scholar]
- 7.Koboldt DC, Fulton RS, McLellan MD, Schmidt H, Kalicki-Veizer J, McMichael JF, et al. Comprehensive molecular portraits of human breast tumours. Nature. 2012;490:61–70. doi: 10.1038/nature11412. [DOI] [PMC free article] [PubMed] [Google Scholar]
- 8.Saal LH, Holm K, Maurer M, Memeo L, Su T, Wang X, et al. PIK3CA mutations correlate with hormone receptors, node metastasis, and ERBB2, and are mutually exclusive with PTEN loss in human breast carcinoma. Cancer Res. 2005;65:2554–9. doi: 10.1158/0008-5472-CAN-04-3913. [DOI] [PubMed] [Google Scholar]
- 9.Hanker AB, Pfefferle AD, Balko JM, Kuba MG, Young CD, Sanchez V, et al. Mutant PIK3CA accelerates HER2-driven transgenic mammary tumors and induces resistance to combinations of anti-HER2 therapies. Proc Natl Acad Sci U S A. 2013;110:14372–7. doi: 10.1073/pnas.1303204110. [DOI] [PMC free article] [PubMed] [Google Scholar]
- 10.Baselga J, Cortes J, Im SA, Clark E, Ross G, Kiermaier A, et al. Biomarker analyses in CLEOPATRA: a phase III, placebo-controlled study of pertuzumab in human epidermal growth factor receptor 2-positive, first-line metastatic breast cancer. J Clin Oncol. 2014;32:3753–61. doi: 10.1200/JCO.2013.54.5384. [DOI] [PubMed] [Google Scholar]
- 11.Majewski IJ, Nuciforo P, Mittempergher L, Bosma AJ, Eidtmann H, Holmes E, et al. PIK3CA mutations are associated with decreased benefit to neoadjuvant human epidermal growth factor receptor 2-targeted therapies in breast cancer. J Clin Oncol. 2015;33:1334–9. doi: 10.1200/JCO.2014.55.2158. [DOI] [PMC free article] [PubMed] [Google Scholar]
- 12.Loibl S, Majewski I, Guarneri V, Nekljudova V, Holmes E, Bria E, et al. PIK3CA mutations are associated with reduced pathological complete response rates in primary HER2-positive breast cancer: pooled analysis of 967 patients from five prospective trials investigating lapatinib and trastuzumab. Ann Oncol. 2016;27:1519–25. doi: 10.1093/annonc/mdw197. [DOI] [PMC free article] [PubMed] [Google Scholar]
- 13.Rexer BN, Chanthaphaychith S, Dahlman K, Arteaga CL. Direct inhibition of PI3K in combination with dual HER2 inhibitors is required for optimal antitumor activity in HER2+ breast cancer cells. Breast Cancer Res. 2014;16:R9. doi: 10.1186/bcr3601. [DOI] [PMC free article] [PubMed] [Google Scholar]
- 14.Saura C, Bendell J, Jerusalem G, Su S, Ru Q, De Buck S, et al. Phase Ib study of Buparlisib plus Trastuzumab in patients with HER2-positive advanced or metastatic breast cancer that has progressed on Trastuzumab-based therapy. Clin Cancer Res. 2014;20:1935–45. doi: 10.1158/1078-0432.CCR-13-1070. [DOI] [PubMed] [Google Scholar]
- 15.Loibl S, de la Pena L, Nekljudova V, Zardavas D, Michiels S, Denkert C, Rezai M, Bermejo B, Chin LS, Turri S, Urban P, Kümmel S, Lux M, Piccart M, Von Minckwitz B, Baselga J, Loi S. San Antonio Breast Cancer Symposium. San Antonio, TX: 2015. Phase II, randomized, parallel-cohort study of neoadjuvant buparlisib (BKM120) in combination with trastuzumab and paclitaxel in women with HER2-positive, PIK3CA mutant and PIK3CA wild-type primary breast cancer – NeoPHOEBE. [Google Scholar]
- 16.Maira SM, Pecchi S, Huang A, Burger M, Knapp M, Sterker D, et al. Identification and characterization of NVP-BKM120, an orally available pan-class I PI3-kinase inhibitor. Mol Cancer Ther. 2012;11:317–28. doi: 10.1158/1535-7163.MCT-11-0474. [DOI] [PubMed] [Google Scholar]
- 17.Bianchini G, Pusztai L, Pienkowski T, Im YH, Bianchi GV, Tseng LM, et al. Immune modulation of pathologic complete response after neoadjuvant HER2-directed therapies in the NeoSphere trial. Ann Oncol. 2015;26:2429–36. doi: 10.1093/annonc/mdv395. [DOI] [PubMed] [Google Scholar]
- 18.Fritsch C, Huang A, Chatenay-Rivauday C, Schnell C, Reddy A, Liu M, et al. Characterization of the novel and specific PI3Kalpha inhibitor NVP-BYL719 and development of the patient stratification strategy for clinical trials. Mol Cancer Ther. 2014;13:1117–29. doi: 10.1158/1535-7163.MCT-13-0865. [DOI] [PubMed] [Google Scholar]
- 19.Dittmer J, Leyh B. The impact of tumor stroma on drug response in breast cancer. Seminars in cancer biology. 2015;31:3–15. doi: 10.1016/j.semcancer.2014.05.006. [DOI] [PubMed] [Google Scholar]
- 20.Leitinger B, Hohenester E. Mammalian collagen receptors. Matrix biology: journal of the International Society for Matrix Biology. 2007;26:146–55. doi: 10.1016/j.matbio.2006.10.007. [DOI] [PubMed] [Google Scholar]
- 21.Huck L, Pontier SM, Zuo DM, Muller WJ. beta1-integrin is dispensable for the induction of ErbB2 mammary tumors but plays a critical role in the metastatic phase of tumor progression. Proc Natl Acad Sci U S A. 2010;107:15559–64. doi: 10.1073/pnas.1003034107. [DOI] [PMC free article] [PubMed] [Google Scholar]
- 22.Huang C, Park CC, Hilsenbeck SG, Ward R, Rimawi MF, Wang YC, et al. beta1 integrin mediates an alternative survival pathway in breast cancer cells resistant to lapatinib. Breast Cancer Res. 2011;13:R84. doi: 10.1186/bcr2936. [DOI] [PMC free article] [PubMed] [Google Scholar]
- 23.Clarke CJ, Berg TJ, Birch J, Ennis D, Mitchell L, Cloix C, et al. The Initiator Methionine tRNA Drives Secretion of Type II Collagen from Stromal Fibroblasts to Promote Tumor Growth and Angiogenesis. Current biology: CB. 2016;26:755–65. doi: 10.1016/j.cub.2016.01.045. [DOI] [PMC free article] [PubMed] [Google Scholar]
- 24.Gilkes DM, Chaturvedi P, Bajpai S, Wong CC, Wei H, Pitcairn S, et al. Collagen prolyl hydroxylases are essential for breast cancer metastasis. Cancer Res. 2013;73:3285–96. doi: 10.1158/0008-5472.CAN-12-3963. [DOI] [PMC free article] [PubMed] [Google Scholar] [Retracted]
- 25.Wang SE, Xiang B, Zent R, Quaranta V, Pozzi A, Arteaga CL. Transforming growth factor beta induces clustering of HER2 and integrins by activating Src-focal adhesion kinase and receptor association to the cytoskeleton. Cancer Res. 2009;69:475–82. doi: 10.1158/0008-5472.CAN-08-2649. [DOI] [PMC free article] [PubMed] [Google Scholar]
- 26.Bhola NE, Balko JM, Dugger TC, Kuba MG, Sanchez V, Sanders M, et al. TGF-beta inhibition enhances chemotherapy action against triple-negative breast cancer. J Clin Invest. 2013;123:1348–58. doi: 10.1172/JCI65416. [DOI] [PMC free article] [PubMed] [Google Scholar]
- 27.Arteaga CL, Engelman JA. ERBB receptors: from oncogene discovery to basic science to mechanism-based cancer therapeutics. Cancer Cell. 2014;25:282–303. doi: 10.1016/j.ccr.2014.02.025. [DOI] [PMC free article] [PubMed] [Google Scholar]
- 28.Utermark T, Rao T, Cheng H, Wang Q, Lee SH, Wang ZC, et al. The p110alpha and p110beta isoforms of PI3K play divergent roles in mammary gland development and tumorigenesis. Genes & development. 2012;26:1573–86. doi: 10.1101/gad.191973.112. [DOI] [PMC free article] [PubMed] [Google Scholar]
- 29.Lin CH, Pelissier FA, Zhang H, Lakins J, Weaver VM, Park C, et al. Microenvironment rigidity modulates responses to the HER2 receptor tyrosine kinase inhibitor lapatinib via YAP and TAZ transcription factors. Mol Biol Cell. 2015;26:3946–53. doi: 10.1091/mbc.E15-07-0456. [DOI] [PMC free article] [PubMed] [Google Scholar]
- 30.Hirata E, Girotti MR, Viros A, Hooper S, Spencer-Dene B, Matsuda M, et al. Intravital imaging reveals how BRAF inhibition generates drug-tolerant microenvironments with high integrin beta1/FAK signaling. Cancer Cell. 2015;27:574–88. doi: 10.1016/j.ccell.2015.03.008. [DOI] [PMC free article] [PubMed] [Google Scholar]
- 31.Crystal AS, Shaw AT, Sequist LV, Friboulet L, Niederst MJ, Lockerman EL, et al. Patient-derived models of acquired resistance can identify effective drug combinations for cancer. Science. 2014;346:1480–6. doi: 10.1126/science.1254721. [DOI] [PMC free article] [PubMed] [Google Scholar]
- 32.Pontiggia O, Sampayo R, Raffo D, Motter A, Xu R, Bissell MJ, et al. The tumor microenvironment modulates tamoxifen resistance in breast cancer: a role for soluble stromal factors and fibronectin through beta1 integrin. Breast Cancer Res Treat. 2012;133:459–71. doi: 10.1007/s10549-011-1766-x. [DOI] [PMC free article] [PubMed] [Google Scholar]
- 33.Aoudjit F, Vuori K. Integrin signaling inhibits paclitaxel-induced apoptosis in breast cancer cells. Oncogene. 2001;20:4995–5004. doi: 10.1038/sj.onc.1204554. [DOI] [PubMed] [Google Scholar]
- 34.Muranen T, Selfors LM, Worster DT, Iwanicki MP, Song L, Morales FC, et al. Inhibition of PI3K/mTOR leads to adaptive resistance in matrix-attached cancer cells. Cancer Cell. 2012;21:227–39. doi: 10.1016/j.ccr.2011.12.024. [DOI] [PMC free article] [PubMed] [Google Scholar]
- 35.Egeblad M, Rasch MG, Weaver VM. Dynamic interplay between the collagen scaffold and tumor evolution. Curr Opin Cell Biol. 2010;22:697–706. doi: 10.1016/j.ceb.2010.08.015. [DOI] [PMC free article] [PubMed] [Google Scholar]
- 36.Garrett JT, Chakrabarty A, Arteaga CL. Will PI3K pathway inhibitors be effective as single agents in patients with cancer? Oncotarget. 2011;2:1314–21. doi: 10.18632/oncotarget.409. [DOI] [PMC free article] [PubMed] [Google Scholar]
- 37.Rexer BN, Ham AJ, Rinehart C, Hill S, Granja-Ingram Nde M, Gonzalez-Angulo AM, et al. Phosphoproteomic mass spectrometry profiling links Src family kinases to escape from HER2 tyrosine kinase inhibition. Oncogene. 2011;30:4163–74. doi: 10.1038/onc.2011.130. [DOI] [PMC free article] [PubMed] [Google Scholar]
- 38.Le X, Antony R, Razavi P, Treacy DJ, Luo F, Ghandi M, et al. Systematic Functional Characterization of Resistance to PI3K Inhibition in Breast Cancer. Cancer discovery. 2016;6:1134–47. doi: 10.1158/2159-8290.CD-16-0305. [DOI] [PMC free article] [PubMed] [Google Scholar]
- 39.Elkabets M, Vora S, Juric D, Morse N, Mino-Kenudson M, Muranen T, et al. mTORC1 inhibition is required for sensitivity to PI3K p110alpha inhibitors in PIK3CA-mutant breast cancer. Sci Transl Med. 2013;5:196ra99. doi: 10.1126/scitranslmed.3005747. [DOI] [PMC free article] [PubMed] [Google Scholar]
Associated Data
This section collects any data citations, data availability statements, or supplementary materials included in this article.
Supplementary Materials
Data Availability Statement
The whole exome and RNA-sequencing data is available at the Sequence Read Archive at NCBI, BioProject ID PRJNA380823. The authors declare that all other data supporting the findings of this study are available within the article and its supplementary files or from the authors upon a reasonable request.