

Abstract
We tested how the addition of oxaloacetate (OAA) to SH-SY5Y cells affected bioenergetic fluxes and infrastructure, and compared the effects of OAA to malate, pyruvate, and glucose deprivation. OAA displayed pro-glycolysis and pro-respiration effects. OAA pro-glycolysis effects were not a consequence of decarboxylation to pyruvate because unlike OAA, pyruvate lowered the glycolysis flux. Malate did not alter glycolysis flux and reduced mitochondrial respiration. Glucose deprivation essentially eliminated glycolysis and increased mitochondrial respiration. OAA increased, while malate decreased, the cell NAD+/NADH ratio. Cytosolic malate dehydrogenase 1 (MDH1) protein increased with OAA treatment, but not with malate or glucose deprivation. Glucose deprivation increased protein levels of ATP citrate lyase, an enzyme which produces cytosolic OAA, while OAA altered neither ATP citrate lyase mRNA nor protein levels. OAA, but not glucose deprivation, increased COX2, PGC1α, PGC1β, and PRC protein levels. OAA increased total and phosphorylated SIRT1 protein. We conclude that adding OAA to SH-SY5Y cells can support or enhance both glycolysis and respiration fluxes. These effects appear to depend, at least partly, on OAA causing a shift in the cell redox balance to a more oxidized state, that it is not a glycolysis pathway intermediate, and possibly its ability to act in an anaplerotic fashion.
Keywords: bioenergetics, glycolysis, mitochondria, oxaloacetate, respiration
Introduction
Bioenergetic fluxes change with advancing age and in various diseases, and targeting these changes could have therapeutic effects (Swerdlow 2011a, Swerdlow 2015, Swerdlow 2011b). One approach to bioenergetic flux manipulation involves the strategic introduction of bioenergetic intermediates (Swerdlow 2015, Wilkins & Swerdlow 2015). Due to our interest in exploring this approach for the treatment of neurodegenerative diseases which feature bioenergetic failure, we recently tested the effects of intraperitoneal (IP) oxaloacetate (OAA) administration on mouse brain bioenergetic infrastructures (Wilkins et al. 2014). OAA treatment appeared to have a pro-mitochondrial biogenesis effect as it increased the expression of peroxisome proliferator-activated receptor gamma α (PGC1α), PGC1 related co-activator (PRC), nuclear respiration factor 1 (NRF1), mitochondrial transcription factor A (TFAM), and cytochrome oxidase subunit 4 isoform 1 (COX4I1). OAA increased the phosphorylation of three proteins (AKT, mechanistic target of rapamycin (mTOR), and P70S6K) the phosphorylation of which are typically induced by the binding of insulin to its receptor. Inflammation signaling and inflammation-associated intermediates were altered as decreased nuclear factor kappa-light-chain-enhancer of activated B cells (NFκB) protein and C-C motif chemokine 11 (CCL11) mRNA were observed. Finally, increased doublecortin staining within the hippocampus of OAA-treated mice was indicative of enhanced neurogenesis.
To better understand the effects of OAA on bioenergetic fluxes and infrastructures, provide mechanistic insight into these effects, and define how cells handle an influx of OAA we treated SH-SY5Y neuroblastoma cells with OAA. We found that OAA can support or enhance SH-SY5Y cell glycolysis and respiration fluxes. These effects appear to depend, at least partly, on OAA causing a shift in the cell redox balance to a more oxidized state, on the fact that OAA is not a glycolysis pathway intermediate, and possibly its ability to act in an anaplerotic fashion.
Materials and Methods
Cell Culture
This study used undifferentiated SH-SY5Y cells (available through the American Type Culture Collection). While being grown for experiments cells were cultured at 5% CO2 in high glucose (25 mM) Dulbecco’s Modified Eagle Medium (DMEM) supplemented with 10% fetal bovine serum (FBS) and 1× penicillin-streptomycin.
Glycolysis Flux Assay
Approximately 60,000 SH-SY5Y cells per well were plated in an XF cell culture microplate (Seahorse Bioscience, Billerica, MA) using a standard manufacturer-recommended two-step seeding procedure. After plating cells, the microplate was kept overnight in a 37° C, 5% CO2 incubator. The following day medium was aspirated, the cells were washed, and the cells were then placed in serum-free, pyruvate-free DMEM with 5 mM glucose. The microplate was kept overnight again in a 37° C, 5% CO2 incubator. The medium was re-aspirated, cells were washed, and the cells were next placed in serum-free, pyruvate-free, glucose-free, buffer-free DMEM. By this point the monolayer occupied approximately 90% of the well bottom surfaces.
An OAA, pyruvate, or malate stock solution was then prepared in assay medium. For the malate and pyruvate solutions the pH was adjusted to approximately 7.4 using NaOH. For the OAA solution NaOH was used to adjust the pH to approximately 6.4, as OAA is relatively unstable in solution and the pH gradually increases over 2 hours, to 7.4, in a predictable fashion. OAA, pyruvate, or malate from these stocks was added to the plate to yield 2 mM OAA, pyruvate, or malate final concentrations. Control wells received vehicle.
The plate was next placed in a 37° C, non-CO2 incubator for 45 minutes and then transferred to the microplate stage of a Seahorse XF24 flux analyzer (Seahorse). When SH-SY5Y cells were analyzed, we followed the procedure described in the Seahorse Glycolysis Stress Test kit. Briefly, initial extracellular acidification rate (ECAR) measurements were taken in the absence of glucose using a 3 minute mix, 2 minute wait, and 3 minute read cycling protocol. Three separate readings were taken to ensure stability. Next, glucose was added to each well to a concentration of 10 mM, and three separate ECAR readings were taken. This was followed by an injection of oligomycin so that the final concentration of oligomycin in each well was 1 μM, and three separate ECAR readings were taken. Next, 2-deoxyglucose was injected to a final concentration of 100 mM in each well, and three separate ECAR readings were taken. Lastly, a 1 μM final concentration of rotenone and antimycin A were injected and three separate readings were taken.
To analyze these data, the area under the curve (AUC) from two readings for each condition was determined. For each well, the AUC from the pre-glucose period was used to represent the non-glycolysis ECAR from that well. The non-glycolysis ECAR from each well was subtracted from the post-glucose ECAR to provide a glycolysis ECAR. The non-glycolysis ECAR from each well was also subtracted from the post-oligomycin ECAR to indicate the maximum glycolysis flux capacity. The glycolysis ECAR was subtracted from the maximum glycolysis rate to provide the glycolysis flux spare capacity for each well. Data for each experimental condition derive from values obtained from a minimum of 6 separate wells.
During each ECAR reading period, oxygen consumption rate (OCR) measurements were also obtained, and these measurements were used to estimate the extent of the associated Crabtree effect that occurs when glucose is introduced to the medium. For this part of the analysis, the OCR from the post-glucose injection was subtracted from the OCR observed prior to the introduction of glucose.
Respiration Flux Assay
Approximately 80,000 SH-SY5Y cells per well were plated in an XF cell culture microplate using a standard manufacturer-recommended two-step seeding procedure. Relative to the glycolysis flux experiments, more cells were plated for the respiration flux experiments to ensure a similar ~90% confluence at the time of the actual Seahorse assays, as respiration measurements were acquired 1 day after cell plating whereas glycolysis measurements were acquired 2 days after cell plating (which gave cells in the glycolysis assays more time to expand).
After plating cells, the microplate was kept overnight in a 37° C, 5% CO2 incubator. The following day medium was aspirated and the cells were washed. Individual wells were next placed in serum-free, pyruvate-free, and buffer-free DMEM with (25 mM) or without (0 mM) glucose. At this time an OAA, pyruvate, or malate stock solution was prepared in assay medium. For the malate and pyruvate solution the pH was adjusted to approximately 7.4 using NaOH. For the OAA solution the pH was adjusted to approximately 6.4 using NaOH, as OAA is relatively unstable in solution and the pH gradually increases over 2 hours, to 7.4, in a predictable fashion. OAA, pyruvate, or malate from these stocks was added to the plate to yield 2 mM OAA, pyruvate, or malate final concentrations. The control wells received vehicle.
Each plate was incubated in a 37° C, non-CO2 incubator for 45 min and then transferred to the microplate stage of a Seahorse XF24 flux analyzer. We followed the procedure described in the Seahorse Mitochondrial Stress Test kit. Initial OCR measurements were taken using a 3 minute mix, 2 minute wait, and 3 minute read cycling protocol. Three separate readings were taken to ensure stability. Next, oligomycin was added to each well (1 μM final concentration) and three separate OCR readings taken, followed by an injection in each well of carbonyl cyanide-p-trifluoromethoxyphenylhydrazone (FCCP) (0.3 μM final concentration) and three separate OCR readings were taken. Lastly, a mixture of rotenone and antimycin A was injected into each well (1 μM final concentration of each inhibitor) and three separate OCR readings were taken.
For each well, the AUC from the pre-oligomycin period was used to represent the baseline OCR for the well. The post-rotenone/antimycin A OCR for each well was subtracted from the baseline OCR to provide a true mitochondrial respiration rate. To calculate the leak rate the post-rotenone/antimycin A OCR was subtracted from the post-oligomycin OCR for each well. The ATP rate was calculated by subtracting the leak for each well from the baseline OCR. The post-rotenone/antimycin A OCR was subtracted from the post-FCCP OCR for each well to determine the FCCP-induced maximum respiration rate. Data for each experimental condition derive from values obtained from a minimum of 6 separate wells.
ATP Measurements
To measure cell ATP levels, an ATP Bioluminescent Assay Kit (Sigma-Aldrich) was used according to the manufacturer’s instructions. Approximately 20,000 SH-SY5Y cells were plated into a 96 well plate. The cells were given 24 hours to attach and functionally normalize; during this time they were maintained in buffered DMEM containing 10% FBS and generated a monolayer confluence of ~90%. Cells received vehicle in the presence or absence of glucose (0 or 25 mM), 2 mM OAA, or 2 mM malate for 2 hours. Cells then received lysis buffer and were processed according to the kit protocol. The luminescence for each well was then quantified using a Tecan Infinite M200 plate reader. Data for each experimental condition derive from values obtained from 12 separate wells.
NAD+/NADH Measurements
To measure cell NAD+/NADH levels, the NAD+/NADH Glo™ Assay Kit (Promega) was used according to the manufacturer’s instructions. Approximately 20,000 SH-SY5Y cells were plated into a 96 well plate. The cells were given 24 hours to attach and functionally normalize; during this time they were maintained in buffered DMEM containing 10% FBS and reached ~90% confluence. Cells either received vehicle in the presence or absence of glucose (0 or 25 mM), 2 mM OAA, or 2 mM malate for 2 hours. Cells then received lysis buffer (1% DTAB) and were processed according to the kit protocol. The luminescence for each well was then quantified using a Tecan Infinite M200 plate reader. Data for each experimental condition derive from values obtained from 14 separate wells.
Treatments for Protein and RNA Analyses
Cells were grown in 6 well plates. Some wells received 2 mM OAA (Sigma) or 2 mM malate (Sigma) prepared in culture medium containing 25 mM glucose for 2 hours at 37° C. Control wells were maintained in culture medium containing 25 mM glucose for 2 hours at 37° C. Glucose deprivation wells were maintained in 0 mM glucose for 2 hours at 37° C. Following these incubations cells were either lysed for protein or RNA. Data for each experimental condition derive from values obtained from 12 separate wells.
Cell Lysis and Immunochemistry
Protein lysates were prepared from cells (cultured in 6-well dishes and treated as described above) using MPER Mammalian protein extraction reagents (ThermoScientific), according to the manufacturer’s instructions. Protein concentrations were measured using a BCA protein assay kit (Thermo Scientific). Protein aliquots were electrophoresed within 4–15% Criterion TGX Tris-glycine polyacrylamide gels (Bio-Rad) and transferred to nitrocellulose membranes (Invitrogen). Blots were stained with primary antibodies to PGC1α (ThermoFisher 1:500; Abcam 1:500), peroxisome proliferator-activated receptor gamma β (PGC1β) (Abcam 1:500), PRC (Santa Cruz 1:1000), COX4I1 (Cell Signaling 1:1000), cytochrome oxidase subunit 2 (COX2) (Abcam 1:1000), ATP citrate lysase (Cell Signaling 1:1000), MDH1 (Abcam 1:500), sirtuin 1 (SIRT1) (Cell Signaling 1:1000), phosphorylated SIRT1 (pSIRT1) (Ser47, Cell Signaling 1:1000), cAMP response element-binding protein (CREB) (Cell Signaling 1:1000), phosphorylated CREB (p-CREB) (Ser135, Cell Signaling 1:1000), glutamate-oxaloacetate transaminase 1 (GOT1) (Sigma 1:500), TFAM (Abcam 1:1000), actin (Cell Signaling 1:2000), and tubulin (Cell Signaling 1:2000). Actin and tubulin antibody staining was used to ensure equivalent protein loading between blot lanes. Primary antibody binding was detected using horseradish peroxidase-conjugated secondary antibodies (1: 2000 dilution; Cell Signaling Technology) and SuperSignal West Femto Maximum Sensitivity Substrate (Thermo Scientific). Densitometry was performed using a ChemiDoc XRS with Quantity One software (Bio-Rad).
mRNA Expression Measurements
Total RNA was prepared from cells treated as described above using TRI Reagent (Life Technologies). Reverse transcription was performed on total RNA (1 μg) using iScriptRT qPCR master mix (Bio-Rad). Amplifications were performed using a QuantStudio™ 7 flex qPCR system. Quantitative real-time, reverse-transcription PCR (qPCR) was performed using iTaq universal probes supermix (Bio-Rad) and TaqMan Gene Expression Assays (Applied Biosystems) to quantify mRNA levels for the following genes: PGC1α, PGC1β, PRC, COX4I1, COX2, ATP citrate lyase, MDH1, GOT1, and TFAM. The expression of these genes was normalized to actin and relative expression levels were calculated using the ΔΔCT method.
mtDNA Measurements
To quantify mtDNA, cells were grown in T25 flasks to ~90% confluence and treated as described above. Total genomic DNA was isolated and analyzed as previously described (Wilkins et al. 2014). Briefly, the quantitative PCR protocol utilized an iTaq universal probes supermix (Bio-Rad) and TaqMan Gene Expression Assays (Applied Biosystems) with primers that amplify portions of the 16S rRNA, 18S rRNA, and ND1 genes. Amplifications were performed using a QuantStudio™ 7 flex qPCR system. 16S rRNA and ND1 DNA cycle thresholds were referenced to their corresponding 18S rRNA DNA cycle thresholds and relative DNA levels were calculated using the ΔΔCT method. Data for each experimental condition derive from values obtained from 12 separate flasks.
Statistical Analysis
Data were summarized by means and standard errors. To compare means between three or more groups, we used one-way ANOVA followed by Fisher’s least significant difference (LSD) post hoc testing. To compare means between two groups we used two-way, unpaired Student’s t-tests. Statistical tests were performed using SPSS 18.0. P-values less than 0.05 were considered statistically significant.
Results
Effects of OAA, Malate, Pyruvate, and Glucose Deprivation on Glycolysis and Oxygen Consumption Rates
To determine the effects of OAA on bioenergetic fluxes, as well as generate mechanistic insight into observed effects, we treated SH-SY5Y cells with OAA, malate (which is generated via the reduction of OAA), pyruvate (which can be generated from OAA enzymatically or arise through spontaneous decarboxylation), and glucose deprivation (which unlike OAA should avoid the possible induction of an anaplerotic state). Figure 1 schematically shows relationships between OAA, malate, and pyruvate and illustrates why malate and pyruvate treatments were studied in order to gain insight into how OAA affects glucose and oxygen consumption rates.
Figure 1. Relationship of intermediates and enzymes evaluated in these studies.
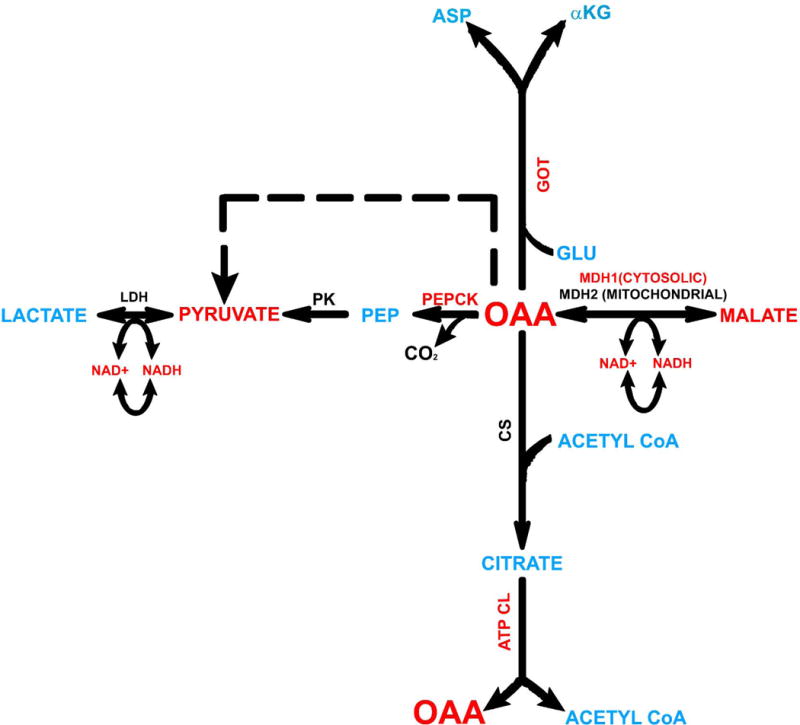
To advance an understanding of how OAA affects bioenergetic fluxes we also studied the bioenergetic flux effects of malate and pyruvate, and how OAA affects levels of enzymes that facilitate its cytosolic metabolism. Intermediates and enzymes we analyzed are shown in red. Abbreviations not defined in the text: αKG=alpha ketoglutarate, ASP=aspartate, ATP CL=ATP citrate lyase; CS=citrate synthase, GLU=glutamate, LDH=lactate dehydrogenase, PEP=phosphoenolpyruvate, PK=pyruvate kinase.
Exposure of SH-SY5Y cells to OAA enhanced glycolysis flux rates under energy stress conditions, in a dose-response manner (Figure 2). The pro-glycolysis effect of OAA generally appeared greater with 2 mM than 1 mM OAA (Figure 2a). Changes manifested as an increase in the glycolysis flux capacity (at 2 mM) after oligomycin was added to block respiration-dependent ATP production, and as an increase in the glycolysis flux spare capacity (at 1 mM and 2 mM). These appeared to represent true pro-glycolysis effects, rather than surrogate entry of OAA carbon directly into the glycolysis pathway, as OAA in the absence of glucose did not increase the ECAR. Both the 1 mM and 2 mM OAA doses robustly mitigated the decrease in oxygen consumption that occurs when glycolysis is allowed to resume following the introduction of glucose. This indicates an OAA-mediated blunting of the Crabtree effect which typically occurs when cells switch from aerobic to non-aerobic ATP production.
Figure 2. Effects of OAA, pyruvate, and malate on glycolysis flux.
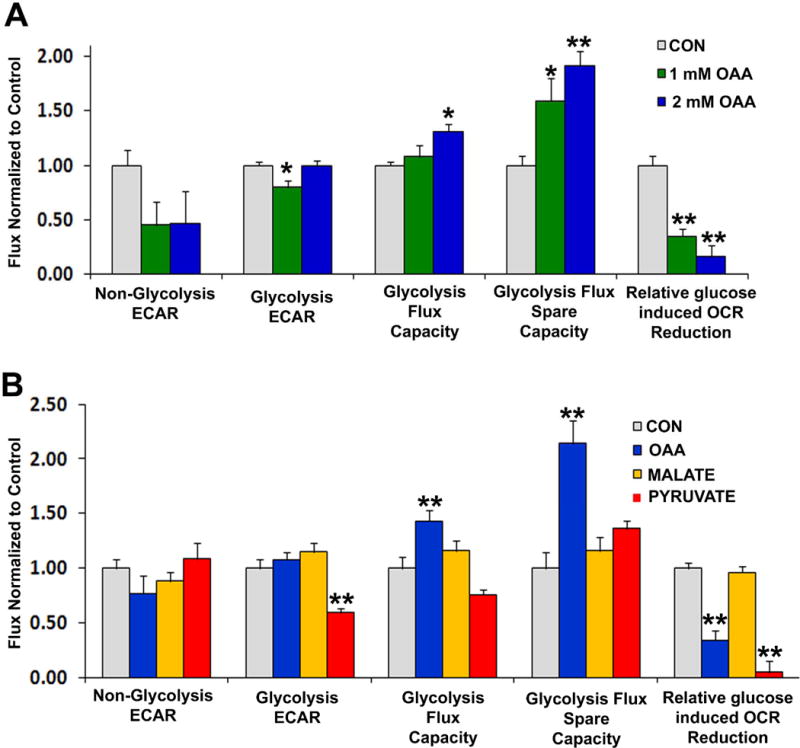
(a) AUC analysis of non-glycolysis ECAR, glycolysis ECAR, glycolysis flux capacity, and glycolysis flux spare capacity from cells treated for 1 hour with either vehicle (CON; grey bars), 1 mM OAA (green bars) or 2 mM OAA (blue bars). Results are from glycolysis stress tests performed using a Seahorse flux analyzer. (b) AUC analysis of non-glycolysis ECAR, glycolysis ECAR, glycolysis flux capacity, and glycolysis flux spare capacity from cells treated for 1 hour with either vehicle (CON; grey bars), 2 mM OAA (blue bars), 2 mM malate (yellow bars), or 2 mM pyruvate (red bars). Results are from glycolysis stress tests performed using a Seahorse flux analyzer. *p<0.05 versus CON, **p<0.01 versus CON.
To explore whether the above effects were due to a spontaneous decarboxylation of OAA to pyruvate or an enzymatic conversion of OAA to pyruvate, we directly compared the effects of these two compounds (Figure 2b). Unlike what was observed with 2 mM OAA, 2 mM pyruvate actually reduced the glycolysis flux, induced a trend towards reduced glycolysis maximum capacity (p=0.07 on posthoc analysis, pyruvate versus control), and did not significantly increase the glycolysis flux spare capacity. Similar to 2 mM OAA, though, 2 mM pyruvate did blunt the Crabtree effect. We also tested how malate, which is produced through the reduction of OAA, affected glycolysis fluxes (Figure 2b). Unlike 2 mM OAA, 2 mM malate failed to increase the maximum glycolysis capacity and the glycolysis spare capacity. 2 mM malate did not mitigate the Crabtree effect; upon restoration of glucose to the medium the OCR rate in the control and malate conditions fell to comparable degrees.
We next analyzed in greater detail the effects of OAA, pyruvate, and malate treatments on SH-SY5Y cell respiration, and further compared these effects to those caused by glucose deprivation, a previously characterized intervention that is known to increase SH-SY5Y cell respiration (Swerdlow et al. 2013). As expected, glucose deprivation robustly increased the basal OCR, the ATP production-associated OCR, and the proton leak rate (Figure 3A). Conversely, the FCCP-induced maximum OCR was lower in the absence of glucose than it was in the presence of glucose. While increased basal and ATP-linked respiration likely reflect an attempt to compensate for lost glycolysis ATP production, the basis for the reduction in the FCCP-induced maximum OCR is unclear since FCCP should not directly affect electron transport chain complex Vmax activities. The observed reduction in the FCCP-induced maximum OCR raises the question of whether the absence of glucose decreased the reducing equivalent production ability to rate-limiting levels, or if failure of FCCP to increase the OCR to or above the baseline OCR is an artifact caused by the presence of an elevated baseline OCR that better approximates the true maximum OCR.
Figure 3. Effects of OAA, pyruvate, malate, and glucose deprivation on respiration.
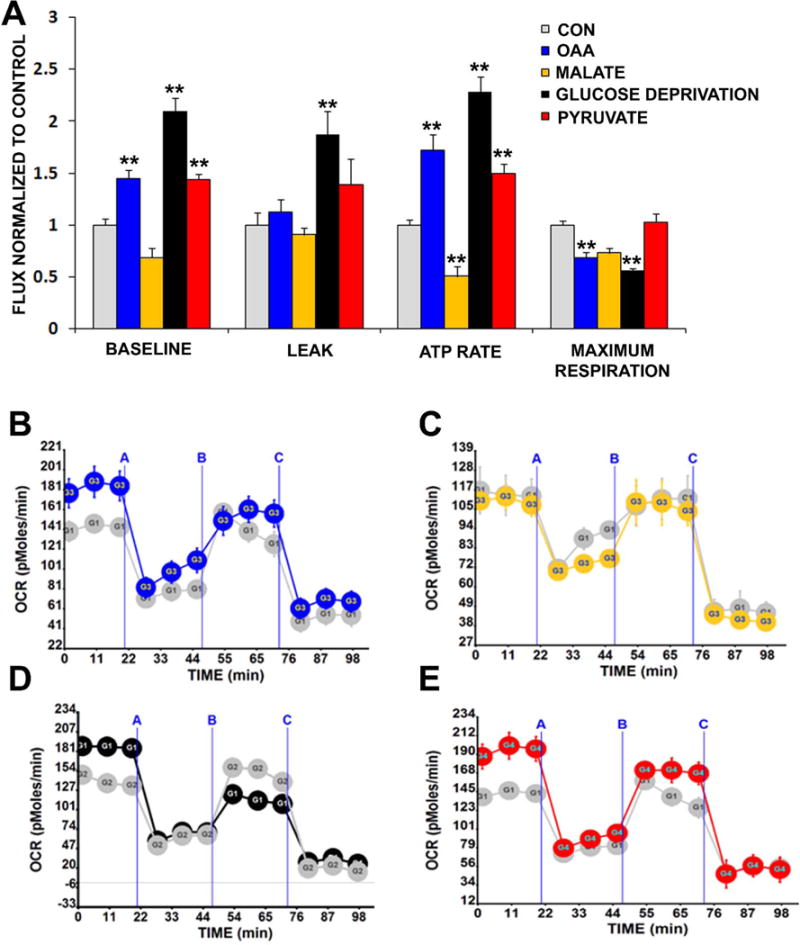
(a) AUC analysis of basal respiration, leak rate, ATP rate, and maximum respiration from cells treated for 1 hour with either vehicle (CON; grey bars), 0 mM glucose (black bars), 2 mM OAA (blue bars), 2 mM malate (yellow bars), or 2 mM pyruvate (red bars). Results are from mitochondrial stress tests performed using a Seahorse flux analyzer. Also shown are representative real-time respiration stress test tracings in which “A” indicates an injection of oligomycin, “B” indicates an injection of FCCP, and “C” indicates an injection of rotenone and antimycin. (b) OCRs obtained under control (grey) and OAA (blue) conditions. (c) OCRs obtained under control (grey) and malate (yellow) conditions. (d) OCRs obtained under control (grey) and glucose deprivation (black) conditions. (e) OCRs obtained under control (grey) and pyruvate (red) conditions. **p<0.01 versus CON.
Similar to glucose deprivation, 2 mM OAA and 2 mM pyruvate increased the basal and ATP production-related OCRs. 2 mM malate, though, actually decreased the ATP production-related OCR and with malate the basal OCR trended lower (p=0.07 on posthoc analysis, malate versus control). This suggests that factors relating to the redox state of the 4 carbon units influences, to at least some extent, their respiration effects. With OAA the FCCP-induced maximum OCR was lower, and with malate the maximum OCR trended lower but was statistically comparable to the control condition (p=0.06 on posthoc analysis, malate versus control). 2 mM pyruvate had no effect on the FCCP-induced maximum OCR. It is possible failure of FCCP to increase the OCR to (with OAA) or above (with pyruvate) the baseline OCR represents an artifact caused by the presence of an elevated baseline OCR that approximates the true maximum OCR. This would not explain, though, why the FCCP-related malate OCR trended lower (but was not significantly different from) the control FCCP OCR. In further regard to the malate FCCP OCR, it is worth noting the control condition itself did not show a particularly robust FCCP response (Figures 3B–E). With Seahorse experiments, specific assay conditions can affect maximum OCR measurements. The inclusion of small amounts of pyruvate in an assay medium, for instance, is recommended to optimize FCCP-induced maximum OCR rates. For our control, OAA, malate, and glucose deprivation interventions pyruvate was purposefully excluded from the assay mediums.
Effects of OAA, Malate, and Glucose Deprivation on ATP, NADH, and NAD+ Levels
We next examined the effects of OAA, malate, and glucose deprivation on cell ATP, NADH, and NAD+ levels. ATP levels did not change with any of these treatments (data not shown). 2 mM OAA did not significantly alter NADH levels, but did increase NAD+ and the NAD+/NADH ratio (Figure 4). Although relative NAD+ and NADH levels were not statistically altered by glucose deprivation, glucose deprivation perhaps induced an upward trend in the cell NAD+/NADH ratio (p=0.1 on posthoc analysis, glucose deprivation versus control). 2 mM malate increased the NADH level, decreased the NAD+ level, and reduced the NAD+/NADH ratio.
Figure 4. Effects of OAA, malate, and glucose deprivation on NAD+ and NADH.
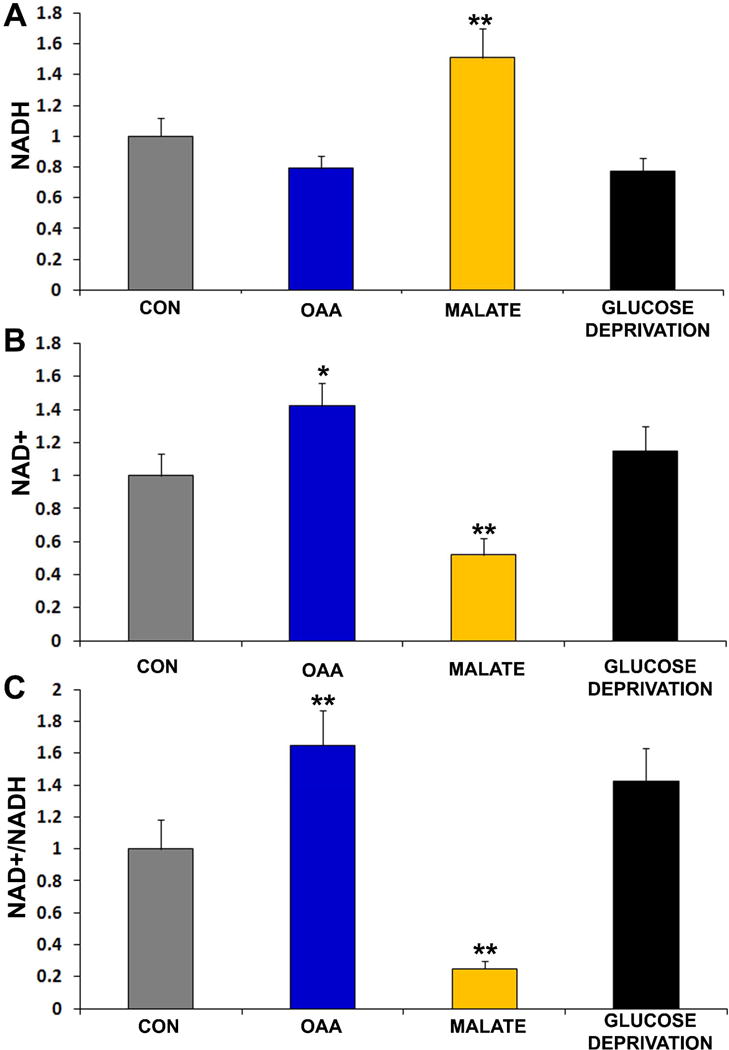
(a) NAD+ normalized to control cell levels. (b) NADH normalized to control cell levels. (d) NAD+/NADH normalized to control cell levels. Cells were treated with either vehicle (CON), 2 mM OAA, 2 mM malate, or 0 mM glucose for 2 hours. *p<0.05 versus CON, **p<0.01 versus CON.
Effects of OAA, Malate, and Glucose Deprivation on Enzyme Protein and mRNA Levels
OAA is not known to directly access the mitochondrial matrix, so upon entry into cells OAA is presumably first metabolized in the cytoplasm. We therefore considered the status of cytosolic enzymes that directly mediate the production or consumption of OAA (see Figure 1, which shows relationships for these enzymatic reactions). We also evaluated the effects of glucose deprivation on these enzymes, and for one case where malate is also a substrate of the enzyme (MDH1) we evaluated the effects of malate.
In gluconeogenic tissues cytosolic OAA is converted to phosphoenolpyruvate by the enzyme phosphoenolpyruvate carboxykinase (PEPCK). We tested for the presence of PEPCK in OAA treated and untreated SH-SY5Y cells, but could not reliably detect either PEPCK mRNA or PEPCK protein (data not shown).
Cytosolic OAA is converted by the cytosolic MDH1 to malate in a reaction that oxidizes NADH to NAD+. 2 mM OAA, but not glucose deprivation or malate, increased the MDH1 protein level (Figure 5). MDH1 mRNA was not significantly increased by 2 mM OAA, although the MDH1 mRNA level did increase in the absence of glucose and in the presence of malate (Figure 5).
Figure 5. Effects of interventions on cytosolic enzymes that mediate OAA metabolism.
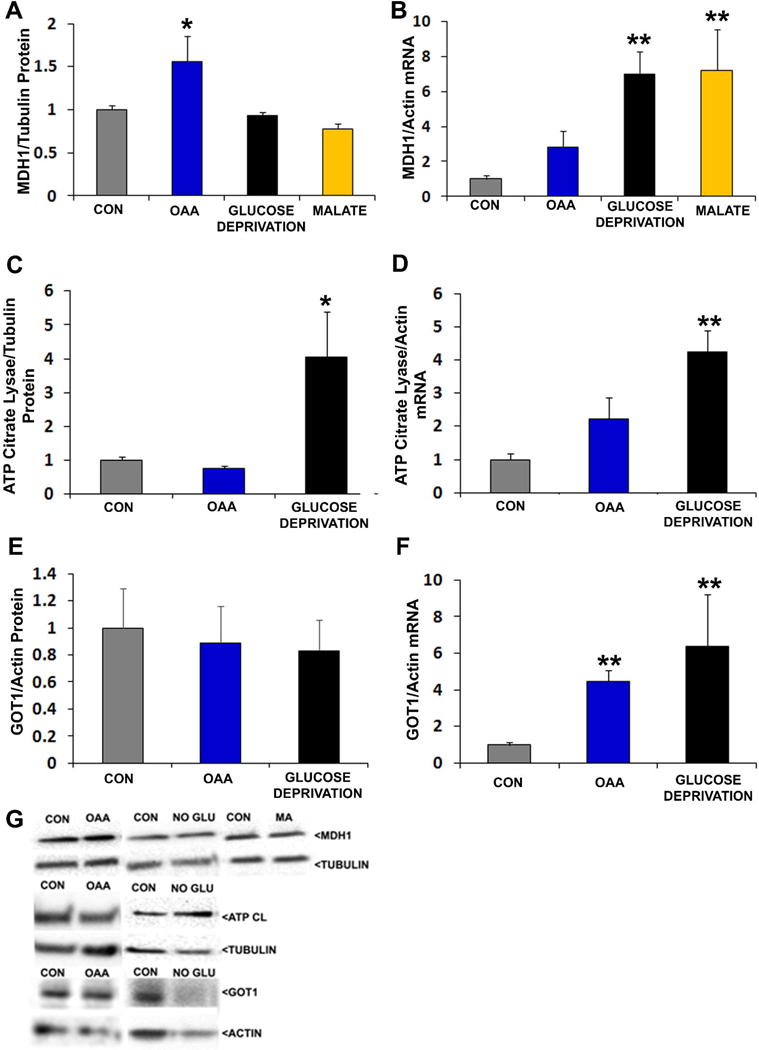
Interventions were for 2 hours. For protein analyses, protein-of-interest densitometry readings from individual lanes were first corrected to a loading control densitometry value from the lane to minimize the effects of inter-lane differences in protein loading. In all analyses data from the active conditions were normalized to the control (CON) condition. (a) Relative MDH1 protein levels. (b) Relative MDH1 mRNA levels. (c) Relative ATP citrate lyase protein levels. (d) Relative ATP citrate lyase mRNA levels. (e) Relative GOT1 protein levels. (f) Relative GOT1 mRNA levels. (g) Representative Western blots. *p<0.05 versus CON, **p<0.01 versus CON.
Cytosolic OAA is a product of the ATP citrate lyase-catalyzed reaction that converts citrate to OAA and acetyl CoA. 2 mM OAA altered neither ATP citrate lyase protein nor mRNA levels, while glucose deprivation increased both of these ATP citrate lyase parameters (Figure 5). Cytosolic OAA and glutamate are also converted by GOT1 to aspartate and α-ketoglutarate. OAA and glucose deprivation increased GOT1 mRNA, although corresponding changes in GOT1 protein levels were not observed.
Effects of OAA and Glucose Deprivation on Mitochondrial Infrastructure
We evaluated the effects of 2 mM OAA and glucose deprivation on markers of mitochondrial mass, transcription, and translation. mtDNA content was not significantly altered by either OAA or glucose deprivation (data not shown). Despite this, 2 mM OAA increased COX2 mRNA and protein levels (Figure 6). Glucose deprivation also increased COX2 mRNA but unlike OAA did not increase COX2 protein. Glucose deprivation increased COX4I1 mRNA expression, which was accompanied by a non-significant trend towards increased COX4I1 protein expression (p=0.19 on posthoc analysis, glucose deprivation versus control). OAA did not significantly alter either COX4I1 mRNA or protein levels, although an upward trend was perhaps observed for mRNA expression (p=0.07 on posthoc analysis, OAA versus control). TFAM mRNA was increased by OAA and glucose deprivation, although TFAM protein did not increase.
Figure 6. Effects of OAA and glucose deprivation on COX2, COX4I1, and TFAM protein and mRNA levels.
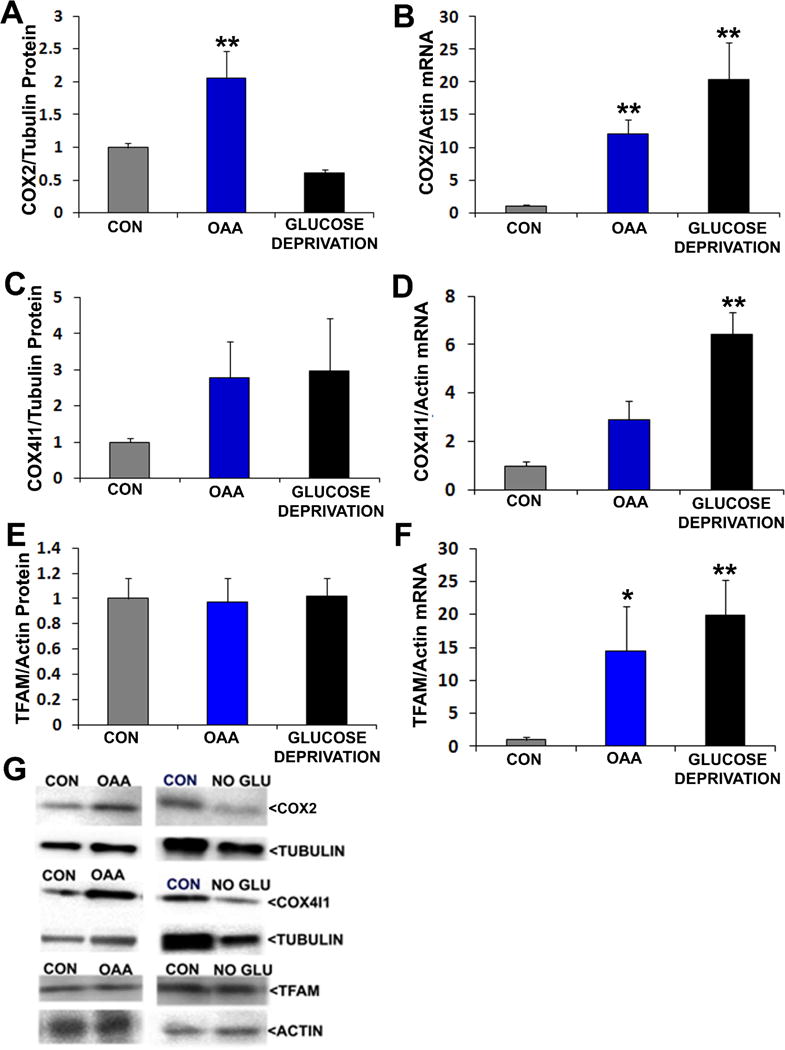
Interventions were for 2 hours. For protein analyses, protein-of-interest densitometry readings from individual lanes were first corrected to a loading control densitometry value from the lane to minimize the effects of inter-lane differences in protein loading. In all analyses data from the active conditions were normalized to the control (CON) condition. (a) Relative COX2 protein levels. (b) Relative COX2 mRNA levels. (c) Relative COX4I1 protein levels. (e) Relative COX4I1 mRNA levels. (e) Relative TFAM protein levels. (f) Relative TFAM mRNA levels. (g) Representative Western blots. *p<0.05 versus CON, **p<0.01 versus CON.
The expression of TFAM and other mitochondrial-localized proteins is coordinated by the PGC1 family of transcriptional co-activators. 2 mM OAA, but not glucose deprivation, increased PGC1α, PGC1β, and PRC protein levels (Figure 7). PGC1α and PRC mRNA were also increased in OAA-treated cells, and a trend towards increased PGC1β mRNA was observed (p=0.12 on posthoc analysis, OAA versus control). Glucose deprivation increased PGC1α mRNA, but did not appreciably alter PGC1β or PRC mRNA levels.
Figure 7. Effects of OAA and glucose deprivation on PGC1 family protein and Mrna levels.
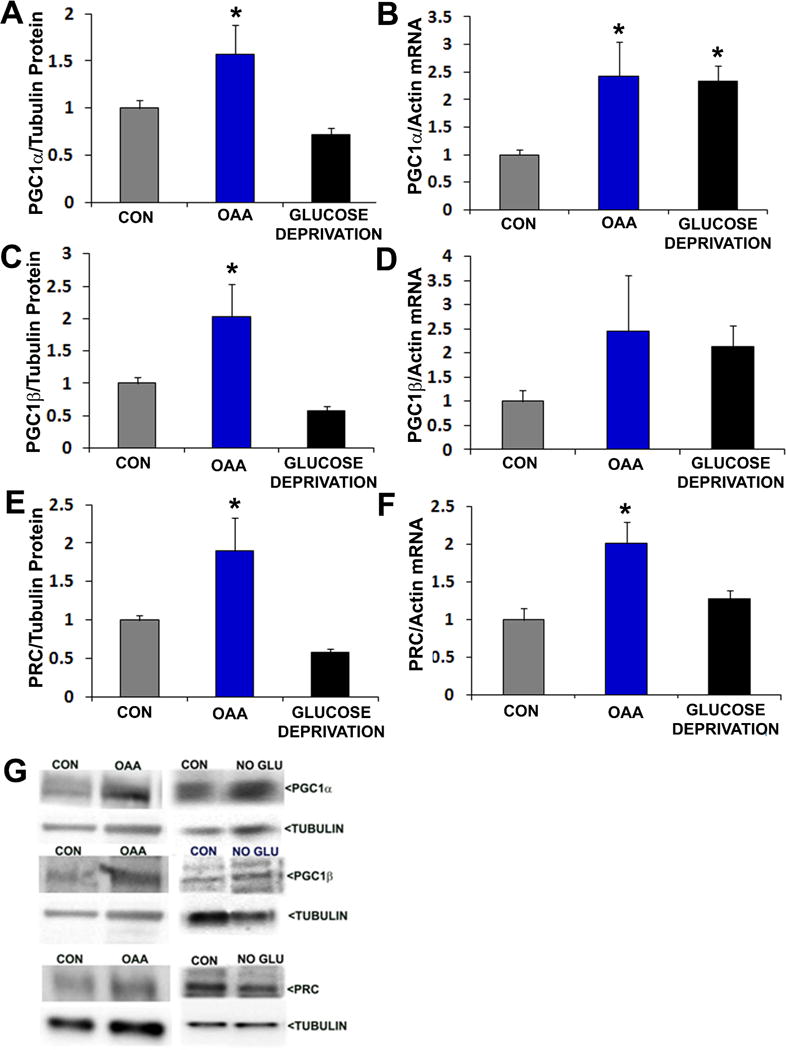
Interventions were for 2 hours. For protein analyses, protein-of-interest densitometry readings from individual lanes were first corrected to a loading control densitometry value from the lane to minimize the effects of inter-lane differences in protein loading. In all analyses data from the active conditions were normalized to the control (CON) condition. (a) Relative PGC1α protein levels. (b) Relative PGC1α mRNA levels. (c) Relative PGC1β protein levels. (d) Relative PGC1β mRNA levels. (e) Relative PRC protein levels. (f) Relative PRC mRNA levels. (g) Representative Western blots. *p<0.05 versus CON.
Expression and phosphorylation levels of CREB, a transcription factor that activates PGC1α expression, was not altered by either OAA or glucose deprivation, and its phosphorylation state was unchanged (data not shown) (Herzig et al. 2001, Scarpulla 2011). The status of SIRT1, an NAD+-dependent deacetylase that activates PGC1α by removing inhibitory acetyl groups (Nemoto et al. 2005), however, was affected by OAA (Figure 8). OAA-treated cells had higher levels of total SIRT1 protein and phosphorylated SIRT1 protein. In the OAA-treated cells the observed SIRT1 total and phosphorylated protein increases were likely proportional, as the relative percentage of SIRT1 that was phosphorylated did not change. SIRT1 phosphorylation, when corrected to actin, was also higher with glucose deprivation. The total SIRT1 protein level, however, unlike the case with OAA, did not increase with glucose deprivation and because of this the phosphorylated SIRT1/total SIRT1 ratio trended higher with glucose deprivation (ANOVA p=0.07, on posthoc LSD testing p<0.05 for the control versus glucose deprivation conditions). Finally, because we previously found malate lowers the NAD+/NADH ratio, and SIRT1 activity is NAD+-dependent, we evaluated malate’s effect on SIRT1. Malate did not significantly alter the level of SIRT1 total protein, phosphorylated SIRT1 protein, or the phosphorylated SIRT1/SIRT1 ratio.
Figure 8. Effects of OAA, glucose deprivation, and malate on SIRT1.
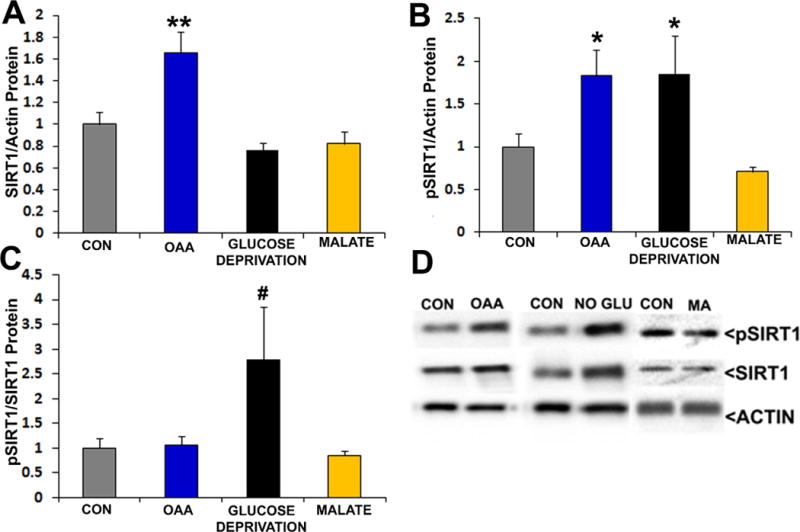
Interventions were for 2 hours. In all analyses data from the active conditions were normalized to the control (CON) condition. (a) Relative total SIRT1 protein levels after SIRT1 densitometry values from each lane were corrected using the actin loading control densitometry value from the lane. (b) Relative pSIRT1 protein levels after pSIRT1 densitometry values from each lane were corrected using the actin loading control densitometry value from the lane. (c) Relative pSIRT1 protein levels when pSIRT1 protein densitometry readings from each lane were first corrected using the total SIRT1 densitometry value from the lane. (d) Representative Western blots. *p<0.05 versus CON, **p<0.01 versus CON, #ANOVA not significant, but p<0.05 versus CON on post hoc LSD analysis.
Discussion
We systematically examined the effects of OAA on human SH-SY5Y neuronal cell bioenergetic fluxes and infrastructure. OAA increased glycolytic capacity and spare capacity, blunted the Crabtree effect, and increased oxygen consumption. These effects appeared to depend, at least to some extent, on OAA-induced increases in the cell NAD+/NADH ratio since malate, the redox couple of OAA, decreased the cell NAD+/NADH ratio and either did not induce similar changes or caused opposite changes in cell bioenergetics. We further showed these effects were not exclusively due to the spontaneous decarboxylation of OAA to pyruvate. Finally, OAA treatment of cells led to increases in protein levels of a cytosolic enzyme involved in OAA metabolism (MDH1), co-transcriptional activators of mitochondrial biogenesis (PGC1α, PGC1β, and PRC), an mtDNA-encoded enzyme (COX2), and a deacetylation enzyme (SIRT1).
The ability of OAA to enhance MDH1 protein levels and the NAD+/NADH ratio suggests OAA is taken up by cells and reduced (at the expense of NADH) to generate malate. We suspect the pro-glycolysis effects of OAA directly reflect its ability to increase the cytosolic NAD+/NADH balance, as NAD+ is consumed during glycolysis and a higher NAD+/NADH ratio would predictably promote a glycolysis flux (Fernie et al. 2004). The pro-glycolysis effects of OAA also appear to depend on the fact that it is not itself a glycolysis intermediate since pyruvate, whose reduction to lactate should also increase NAD+/NADH ratios, slowed the glycolysis flux. This pyruvate-related effect is consistent with a prior report that found pyruvate suppresses glycolysis through the negative allosteric regulation of upstream glycolysis enzymes (Williamson & Jones 1964, Fernie et al. 2004). It should also be considered that increasing pyruvate levels might suppress glycolysis flux through mass action effects (Williamson & Jones 1964, Swerdlow 2014).
Because NADH provides electrons to the respiratory chain, in some ways it seems counter-intuitive that increasing the cell NAD+/NADH ratio would increase the respiratory flux. It is important to note however, that we measured total cell NAD+ and NADH levels and the NAD+/NADH ratio within mitochondria may have differed from the cytosolic ratio. It may also be the case that a specific increase in glycolysis-derived NADH production, or the accession of malate carbon to the mitochondria (via the malate-aspartate shuttle) in the setting of a relatively oxidized environment, may ultimately have supported a respiratory flux (LaNoue & Williamson 1971, Fernie et al. 2004). Consistent with this latter possibility is the observation that pyruvate, which also accesses the mitochondrial matrix and which should predictably give rise to a more oxidized cytosolic environment, also supported the respiratory flux (LaNoue & Williamson 1971, Fernie et al. 2004).
Increasing OAA levels can theoretically contribute carbon to the Krebs cycle and in this respect OAA is recognized to have anaplerotic properties (Owen et al. 2002). Glucose deprivation, on the other hand, precludes the addition of glucose-derived carbon to the cell and should therefore have a predictable cataplerotic effect. The possibility that glucose deprivation induces a cataplerotic state is supported by the observation that this intervention increased the ATP citrate lyase protein level.
When considering the redox and anaplerotic/cataplerotic effects of the manipulations we studied, it is possible to define four conditions (Table 1). Based on this heuristic construct, manipulations that are anaplerotic and that increase the cytosolic NAD+/NADH ratio would predictably promote glycolysis and respiration fluxes to the greatest extent. Manipulations that decrease the cytosolic NAD+/NADH ratio would predictably decrease glycolysis and, potentially, carbohydrate metabolism-supported respiration.
Table 1. Treatments by category.
The matrix summarizes which conditions were oxidizing vs. reducing, and cataplerotic vs. anaplerotic.
| Cataplerotic | Anaplerotic | |
|---|---|---|
| Oxidizing | Glucose Deprivation | OAA |
| Reducing | Not Evaluated | Malate |
The amount of NAD+ present within a cell influences the function of its NAD+-dependent sirtuin enzymes, and SIRT1 activity positively correlates with NAD+ levels (Hisahara et al. 2005, Nemoto et al. 2005). We found that in the presence of OAA, SIRT1 protein levels increased, as did the total amount of phosphorylated SIRT1. The SIRT1 phosphorylation modification we assessed (Ser47) reportedly promotes enzyme activity (Rodgers et al. 2005). SIRT1-mediated deacetylation of PGC1α in turn activates PGC1α, which promotes mitochondrial biogenesis (Nemoto et al. 2005, Picard et al. 2004, Scarpulla 2011). The OAA-induced NAD+/NADH increase we observed, therefore, may activate mitochondrial biogenesis pathways through SIRT1 activation and lead to an upregulation of respiratory infrastructure and mitochondrial mass. The fact that malate decreased the NAD+/NADH ratio and decreased SIRT1 phosphorylation is at least partly consistent with this possible event sequence.
Increased levels of total SIRT1 protein, phosphorylated SIRT1 protein, and PGC1-family proteins suggest OAA at least partly activated mitochondrial biogenesis pathways. We did generate additional data that relate to the question of whether mitochondrial biogenesis, either in part or in full, was actually achieved and these data are mixed. The increase in COX2 protein we observed could be consistent with actual mitochondrial biogenesis. On the other hand, a statistically clear-cut increase in COX4I1 protein was not observed and mtDNA levels did not increase. These findings do not support the view that OAA treatment induced a full, functional mitochondrial biogenesis. When considering the question of mitochondrial biogenesis, though, it is important to consider that COX2 mRNA was increased, which is consistent with the possibility that increased mtDNA transcription precluded any need to increase the mtDNA copy number. Also, mtDNA copy numbers were only evaluated after a 2 hour OAA treatment. Perhaps longer durations would have produced different results. Division amongst SH-SY5Y cells, or the fact that these are tumor cells, possibly also reduced our ability to demonstrate a cell population-level accumulation of mtDNA. Additional studies will be needed to resolve these questions.
The SH-SY5Y cell line derives from a human neuroblastoma tumor (Pahlman et al. 1990). Undifferentiated SH-SY5Y cells have neuronal features but exhibit metabolism characteristics typical of tumor cells (Pahlman et al. 1990, Swerdlow et al. 2013). In this respect important differences between neurons and undifferentiated SH-SY5Y cells certainly exist. Our intent, though, was not to faithfully model brain metabolism (keep in mind the ability of primary cultured neurons to model brain metabolism is also limited), but instead gain fundamental insight into how OAA treatment might affect bioenergetic fluxes and infrastructure. In this respect the results of this study are relevant to a recent study in which we tested the effects of OAA on mouse brain bioenergetic infrastructures (Wilkins et al. 2014). That study also showed evidence of pro-mitochondrial biogenesis and pro-glycolysis effects. Our SH-SY5Y study is important in that it suggests the changes observed in the mouse study may have been mediated by an OAA-induced increase in brain cell NAD+/NADH ratios, and may have benefited from Krebs cycle anaplerosis. Our current data, therefore, argue that to concomitantly enhance respiratory and glycolytic fluxes, optimal interventions should increase the cytosolic NAD+/NADH ratio, provide carbon to the mitochondria, and avoid glycolysis feed-back inhibition.
Acknowledgments
This project was supported by NS077852, Alzheimer’s Association PCTR-15-330495, the Kansas Board of Regents EPSCOR Program, the University of Kansas Alzheimer’s Disease Center (P30 AG035982), the Frank and Evangeline Thompson Alzheimer’s Treatment Program fund, the Kansas IDeA Network for Biomedical Research Excellence (KINBRE), the University of Kansas Alzheimer’s Disease Center Pilot Program, the University of Kansas Landon Center on Aging, the University of Kansas Frontiers Heartland Institute for Clinical and Translational Research, University of Kansas Medical Center’s Biomedical Research Training Program, and a Mabel Woodyard Fellowship award.
Abbreviations
- ATP
adenosine triphosphate
- AUC
area under the curve
- CCL11
C-C motif chemokine 11
- COX4I1
cytochrome oxidase subunit 4 isoform 1, COX2, cytochrome oxidase subunit 2, CREB, cAMP response element-binding protein
- Dulbecco’s Modified Eagle Medium
DMEM
- DTAB
dodecyltrimethylammonium bromide
- ECAR
extra-cellular acidification rate
- FBS
fetal bovine serum
- FCCP
Carbonyl cyanide-p-trifluoromethoxyphenylhydrazone
- GOT1
glutamate oxaloacetate transaminase 1 (cytosolic)
- IP
intraperitoneal
- MDH1
malate dehydrogenase 1 (cytosolic)
- mRNA
messenger RNA
- mtDNA
mitochondrial DNA
- mTOR
mechanistic target of rapamycin
- NAD+
nicotinamide adenine dinucleotide (oxidized)
- NADH
nicotinamide adenine dinucleotide (reduced)
- NaOH
sodium hydroxide
- nuclear factor kappa-light-chain-enhancer of activated B cells
NFκB
- NRF1
nuclear respiratory factor 1
- OAA
oxaloacetate
- OCR
oxygen consumption rate
- PEPCK
phosphoenolpyruvate carboxykinase
- PGC1α
peroxisome proliferator-activated receptor gamma α
- PGC1β
peroxisome proliferator-activated receptor gamma β
- PRC
PGC1 related co-activator
- SIRT1
sirtuin 1
- TFAM
mitochondrial transcription factor A
Footnotes
No conflicts of interest, financial or otherwise, are declared by the authors.
References
- Fernie AR, Carrari F, Sweetlove LJ. Respiratory metabolism: glycolysis, the TCA cycle and mitochondrial electron transport. Current opinion in plant biology. 2004;7:254–261. doi: 10.1016/j.pbi.2004.03.007. [DOI] [PubMed] [Google Scholar]
- Herzig S, Long F, Jhala US, et al. CREB regulates hepatic gluconeogenesis through the coactivator PGC-1. Nature. 2001;413:179–183. doi: 10.1038/35093131. [DOI] [PubMed] [Google Scholar]
- Hisahara S, Chiba S, Matsumoto H, Horio Y. Transcriptional regulation of neuronal genes and its effect on neural functions: NAD-dependent histone deacetylase SIRT1 (Sir2alpha) Journal of pharmacological sciences. 2005;98:200–204. doi: 10.1254/jphs.fmj05001x2. [DOI] [PubMed] [Google Scholar]
- LaNoue KF, Williamson JR. Interrelationships between malate-aspartate shuttle and citric acid cycle in rat heart mitochondria. Metabolism: clinical and experimental. 1971;20:119–140. doi: 10.1016/0026-0495(71)90087-4. [DOI] [PubMed] [Google Scholar]
- Nemoto S, Fergusson MM, Finkel T. SIRT1 functionally interacts with the metabolic regulator and transcriptional coactivator PGC-1{alpha} J Biol Chem. 2005;280:16456–16460. doi: 10.1074/jbc.M501485200. [DOI] [PubMed] [Google Scholar]
- Owen OE, Kalhan SC, Hanson RW. The key role of anaplerosis and cataplerosis for citric acid cycle function. J Biol Chem. 2002;277:30409–30412. doi: 10.1074/jbc.R200006200. [DOI] [PubMed] [Google Scholar]
- Pahlman S, Mamaeva S, Meyerson G, Mattsson ME, Bjelfman C, Ortoft E, Hammerling U. Human neuroblastoma cells in culture: a model for neuronal cell differentiation and function. Acta physiologica Scandinavica. Supplementum. 1990;592:25–37. [PubMed] [Google Scholar]
- Picard F, Kurtev M, Chung N, Topark-Ngarm A, Senawong T, Machado De Oliveira R, Leid M, McBurney MW, Guarente L. Sirt1 promotes fat mobilization in white adipocytes by repressing PPAR-gamma. Nature. 2004;429:771–776. doi: 10.1038/nature02583. [DOI] [PMC free article] [PubMed] [Google Scholar]
- Rodgers JT, Lerin C, Haas W, Gygi SP, Spiegelman BM, Puigserver P. Nutrient control of glucose homeostasis through a complex of PGC-1alpha and SIRT1. Nature. 2005;434:113–118. doi: 10.1038/nature03354. [DOI] [PubMed] [Google Scholar]
- Scarpulla RC. Metabolic control of mitochondrial biogenesis through the PGC-1 family regulatory network. Biochimica et biophysica acta. 2011;1813:1269–1278. doi: 10.1016/j.bbamcr.2010.09.019. [DOI] [PMC free article] [PubMed] [Google Scholar]
- Swerdlow RH. Brain aging, Alzheimer’s disease, and mitochondria. Biochimica et biophysica acta. 2011a;1812:1630–1639. doi: 10.1016/j.bbadis.2011.08.012. [DOI] [PMC free article] [PubMed] [Google Scholar]
- Swerdlow RH. Role and treatment of mitochondrial DNA-related mitochondrial dysfunction in sporadic neurodegenerative diseases. Current pharmaceutical design. 2011b;17:3356–3373. doi: 10.2174/138161211798072535. [DOI] [PMC free article] [PubMed] [Google Scholar]
- Swerdlow RH. Bioenergetic medicine. British journal of pharmacology. 2014;171:1854–1869. doi: 10.1111/bph.12394. [DOI] [PMC free article] [PubMed] [Google Scholar]
- Swerdlow RH. Mitochondrial Manipulation and the Quest for Alzheimer’s Treatments. EBio Medicine. 2015;2:276–277. doi: 10.1016/j.ebiom.2015.03.017. [DOI] [PMC free article] [PubMed] [Google Scholar]
- Swerdlow RH, E L, Aires D, Lu J. Glycolysis-respiration relationships in a neuroblastoma cell line. Biochimica et biophysica acta. 2013;1830:2891–2898. doi: 10.1016/j.bbagen.2013.01.002. [DOI] [PMC free article] [PubMed] [Google Scholar]
- Wilkins HM, Harris JL, Carl SM, et al. Oxaloacetate activates brain mitochondrial biogenesis, enhances the insulin pathway, reduces inflammation and stimulates neurogenesis. Human molecular genetics. 2014;23:6528–6541. doi: 10.1093/hmg/ddu371. [DOI] [PMC free article] [PubMed] [Google Scholar]
- Wilkins HM, Swerdlow RH. Relationships Between Mitochondria and Neuroinflammation: Implications for Alzheimer’s Disease. Current topics in medicinal chemistry. 2015 doi: 10.2174/1568026615666150827095102. [DOI] [PMC free article] [PubMed] [Google Scholar]
- Williamson JR, Jones EA. Inhibition of Glycolysis by Pyruvate in Relation to the Accumulation of Citric Acid Cycle Intermediates in the Perfused Rat Heart. Nature. 1964;203:1171–1173. doi: 10.1038/2031171a0. [DOI] [PubMed] [Google Scholar]