Abstract
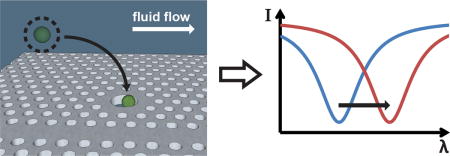
Label-free biodetection schemes compatible with standard CMOS fabrication methods constitute an important goal, as these are enabling tools for the mass production of high-sensitivity biosensors. Two-dimensional slab photonic crystal (2D slab-PhC) sensors have been posited as ultrahigh-sensitivity detection components, but to date recognition-mediated detection of viruses or simulants under flow has not been demonstrated. We report the design and optimization of a new W1 waveguide-coupled 2D slab-PhC sensor, with a geometry well suited to virus detection. Proof of concept experiments with fluorescent latex particles verified that the sensor could respond to infiltration of a single particle, both in air and under an aqueous cover layer. Subsequent experiments with antibody-functionalized sensors and virus simulants confirmed the ability of the device to detect virus-sized particles under flow via a recognition-mediated process. This work sets the stage for incorporation of 2D slab-PhC sensors into fully integrated photonic sensor systems.
Graphical abstract
1. Introduction
Methods for the simple and sensitive detection of virus particles are of significant interest. Early detection of illness is critical both for controlling the spread of disease and for administering successful treatment, but success in this endeavor requires highly sensitive diagnostic capabilities. Likewise, new sensor systems for environmental monitoring of viral pathogens are needed. Current prevailing methods of pathogen detection (cell culture, PCR, and ELISA) face practical limitations that complicate their adaptation for point-of-care use,1 and are obviously not compatible with remote operation for continuous monitoring. In response, the research community has expended significant effort on the development of alternative technologies to avoid the costly and time-consuming processing steps of target purification, amplification, and labeling. Single particle detection has been reported for a few free-space optical techniques, including reflectance-based interferometric sensors,2 nanospectrosocopy,3 and 1-D photonic crystal-enhanced microscopy.4 Flow-through systems using plasmonic nanohole arrays have also shown promise.5 With regard to components suitable for incorporation into integrated systems, various refractive index (RI) based optical sensors have shown promise as sensitive, label-free platforms for pathogen detection.6 Of these, whispering gallery mode (WGM)7,8 and two-dimensional photonic crystal (2D PhC) platforms9,10,11 have demonstrated the potential to detect single copies of virus-sized analytical targets.
In addition to their demonstrated high sensitivity, 2D slab-PhC sensors satisfy the conditions necessary for implementation in array-based sensing assays for redundant or multiplexed detection.12 Slab-PhCs have resonant mode volumes on the order of cubic microns or smaller, allowing them to probe extremely small analyte volumes (tens of femtoliters). With near-planar footprints on the order of tens of square microns, slab-PhC structures are compatible with CMOS fabrication techniques for mass-produced, large-scale, high-density integrated photonic chips. The low profile surface features are also highly compatible with integration into lab-on-a-chip (LOC) devices,13 making them an appealing platform for further development toward point-of-care clinical diagnostics and point-of-need monitoring systems. Unlike WGM resonators, 2D slab-PhCs can preselect targets based on size, simply by virtue of a target’s ability to infiltrate the crystal. Additionally, it has been posited that the structure of the 2D slab-PhC may be used to assist with discriminating specific from nonspecific binding.14
Detection of a single virus-sized particle using a slab-PhC platform was initially described by Lee and Fauchet.15 In that report, a 370 nm latex sphere induced a resonance shift in the optical cavity mode inhabiting a large (several lattice constants) point-defect modification of the PhC lattice. While an important advance, this experiment involved a dried chip, and therefore did not address the ability of a PhC sensor to detect a particle in application-relevant conditions (under an aqueous cover solution, by analogy to a clinical or environmental sample). Additionally, the point-defect structure does not lend itself well to further development, as it is incapable of operating in a redundant detection or multiplex detection mode. To address these deficiencies, we have reported the design, fabrication, and testing of a W1 waveguide-coupled 2D PhC sensor.16,17,18 While successfully used to detect HPV virus-like particles, the small size of the defect hole was not ideal for virus detection experiments, as the probability of particle capture in the defect was smaller than in surrounding, larger holes. Here, we describe the implementation of a large-defect W1 waveguide-coupled 2D PhC sensor for sensitive detection of virus-sized particles under flow. Capture of particles in the sensor is mediated by specific antibody-antigen interactions, to our knowledge representing the first time antibody-mediated capture under flow has been demonstrated on the 2D PhC platform.
2. Experimental Section
2.1 Computational Methods
Computational electrodynamics simulations were performed during the design of the PhC sensor to calculate the expected electromagnetic field profile for a given sensor geometry as a function of excitation wavelength. Results were calculated for three-dimensional geometries using a freely available finite-difference time-domain (FDTD) software package (Meep).19 Simulated electromagnetic field profiles of the resonant optical mode used for sensing are shown in Fig. 1.
Fig. 1. PhC sensor geometry.
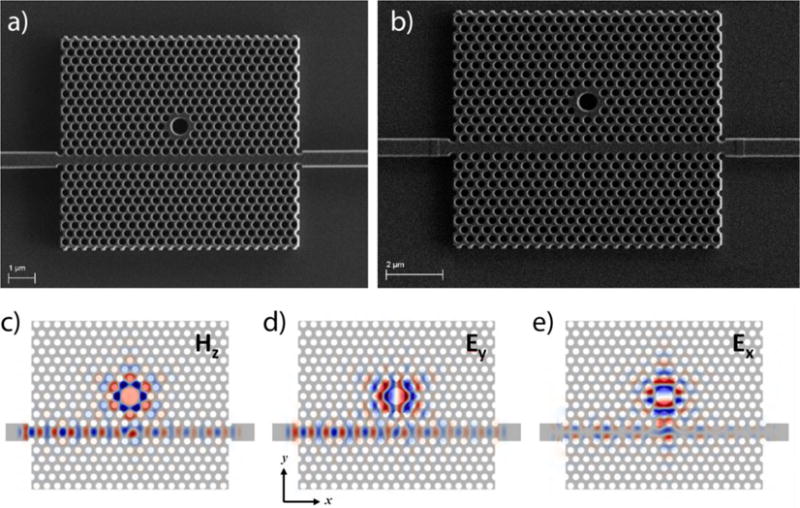
(a,b) Electron micrograph images of the two PhC sensor geometries used for these studies. The PhC geometries consist of a triangular lattice of low-RI holes, a W1 PhC waveguide traversing the lattice, and a large-hole, point-like lattice defect centered either 4 (a) or 5 (b) rows from away from the W1 waveguide. (c–e) Simulated electromagnetic field profiles of the photonic device shown in (a) at the resonant frequency of the optical mode used for sensing. Calculated using 3D FDTD methods, cross sections are taken at the center plane of the silicon device layer and demonstrate field localization around the large-hole defect of PhC.
2.2 Optical Setup and Measurement of Transmission Spectra
Transmission spectra of the PhC sensors were measured by scanning the wavelength of a tunable laser (Hewlett Packard 8168F) and collecting transmitted light with an InGaAs photodetector (Thorlabs DET410). Light from the laser (1 mW at source) was passed through a three-paddle polarization controller and coupled into and out from device waveguides through tapered, lensed optical fibers (Nanonics). A custom LabVIEW (National Instruments) script was used to synchronize laser illumination and photodetector measurement in order to acquire spectral transmission data. Spectral scans were taken over a wavelength range of 20 nm with a resolution of 0.02 nm. Optical transmission was significantly reduced at the wavelength of the resonant mode used for sensing. Each transmission intensity scan was fit with a Lorentzian function (Origin, OriginLab Co.) to determine the center wavelength of the transmission dip corresponding to the optical resonance.
2.3 Slab-PhC Chip Fabrication
The PhC sensors were fabricated from silicon-on-insulator substrates (SOITEC) using standard nanofabrication techniques. The thickness of the device silicon layer was first reduced to 368 nm through thermal oxide growth and subsequent immersion in concentrated hydrofluoric acid. An e-beam sensitive resist (Dow Corning XR-1541, 6% in MIBK) was spin-coated on the substrate and patterns for the photonic structures were written using a JEOL JBX-9500FS e-beam system. After developing the resist, a combination of BCl3 and CF4 gases were used in a reactive ion etch process to transfer the mask pattern directly to the device silicon layer. Processed substrates were cleaved to obtain 2D PhC chips with edge-accessible waveguide facets.
2.4 Protein Tagging to Latex Particles
Cleaning of stock particle solution
A 1000 μL volume of 1:5 dilution of latex particles (carboxyl modified, diameter: 320 ± 40 nm; Magsphere Inc.) from the vendor stock was made in PBS-T (PBS supplemented with 0.1% Tween 20). This solution was centrifuged at 14,000 rpm for 12 minutes, after which, the supernatant was replaced with fresh PBS-T buffer. The particles were re-suspended into solution by vortexing and sonicating for 30 and 40 seconds, respectively. This process was repeated two more times to ensure that the final particle solution was free of unpolymerized latex chains or free fluorophores.
Conjugating goat anti-human IgG molecules to carboxyl modified latex particles
From the cleaned stock particle solution, 750 μL were transferred to a 2 mL centrifuge tube containing 75 μL of PBS-T buffer. 75 μL of EDC (1-ethyl-3-(3-dimethylaminopropyl)-carbodiimide hydrochloride, 500 mM in PBS-T) solution was added to the particle suspension, followed by 150 μL of NHS solution (N-hydroxysuccinimide, 500 mM in PBS-T). Finally, 450 μL of 500 μg/mL goat anti-human IgG solution in PBS buffer was added to the reaction mixture, which was mixed on a rotator at 4 °C for 3 hours.
After 3 hours, the reaction mixture was transferred to a dialysis membrane of 300 kDa molecular weight cut-off and dialyzed against PBS-T buffer at 4 °C with mild shaking, overnight. The next day, the dialysis buffer was replaced with fresh PBS-T buffer and dialysis was carried out for another 3 hours. After 3 hours, the dialysis buffer was once again replaced with fresh PBS-T buffer. After another 3 hours of dialysis, the particle solution from the dialysis membrane was collected in a centrifuge tube.
2.5 Fabrication of Microfluidic Channels
40 grams of PDMS mixture were prepared by mixing PDMS pre-polymer and curing agent (Sylgard 184 kit, Dow Corning, Midland, MI) in a 10:1 ratio (w/w). The mixture was degassed in a vacuum chamber to release trapped air for ~30 minutes. The degassed pre-polymer mixture was then cast over the inverse-template channel mold (SU-8 photoresist) and allowed to sit at room temperature overnight. The next day, the entire assembly was cured in an oven at 110 °C for 2 hours. Afterward, the cured PDMS polymer was peeled away from the master mold. This resulted in a PDMS elastomer cast embedded with the negative relief of microchannels with dimensions of 2 mm in length, 500 μm in width and 50 μm in height.
2.6 Integration of a Microfluidic Channel with the Slab-PhC chip
A custom clamp assembly was constructed so that the microfluidic channel-embedded PDMS could be sealed over the PhC devices (Fig. S2). Microfluidic channels were aligned over the series of PhC sensors present on a photonic chip using a stereo-zoom microscope with 45-90X magnification (Amscope). Blunt syringe needle barbs (20G × ½” stainless steel; Small Parts, Inc.) were then inserted into the inlet and outlet holes bored through the PDMS. A piece of glass microscope slide, cut to size and drilled with holes to match the channel inlet and outlet, was placed on top of the PDMS. The chip/PDMS/glass stack was then clamped onto an aluminum stage, which was in turn clamped above a Peltier thermo-electric cooler (TEC) module (Custom Thermoelectric 00711-5L31-03CA). The temperature of the aluminum stage was monitored using a thermistor, which provided feedback to the integrated benchtop temperature controller (Thorlabs TED200C) that powered the TEC. The controller provided automatic temperature feedback with ≤ 0.05 °C variation over the course of hours.
2.7 Surface Functionalization and Particle Flow
The PhC chip was cleaned in piranha solution (Caution: piranha solution reacts vigorously with adsorbed organics, and must be used with care) for 30 minutes with mild shaking, rinsed in ddH2O (distilled, deionized water) and dried with a N2 gas stream. The transmission spectrum of each geometry of PhC was measured in air and in PBS buffer. In order to collect transmission spectra of the PhCs in PBS buffer, a PDMS elastomer with a reservoir centered over the sensors was clamped over the PhC chip. Once all the spectra were collected, the chip was cleaned in concentrated sulfuric acid for 30 minutes and then in piranha solution for 15 minutes. After each of these steps, the chip was rinsed in ddH2O and dried under N2 gas. The thickness of the oxide layer on the chip surface was measured using spectroscopic ellipsometry (Alpha SE, J. A Woollam Co.).
The PhC chip was then immersed in 1% APDMES (3-aminopropyldimethylethoxysilane) in anhydrous toluene for 20 minutes under mild shaking on an orbital shaker, rinsed thoroughly with anhydrous toluene and dried with N2 gas. Next, the chip was immersed in 2.5% glutaraldehyde in PBS buffer for 60 minutes on an orbital shaker with mild shaking, rinsed in PBS, rinsed in ddH2O, and finally dried under N2 gas. The thickness of the surface chemistry layers were measured using spectroscopic ellipsometry. Next, a microfluidic channel was integrated over the PhC chip using the custom flow cell clamp assembly, and the transmission spectra of each of the PhCs were collected in air and in PBS buffer.
Functionalization of the PhC was accomplished by flowing 500 μg/mL of human-IgG (Rockland, 009-0102) diluted in PBS buffer with 0.1% 12-crown-4 through the channel for ~16 hours at a flow rate of 0.5 μL/min at 4 °C. The next day, the channel was rinsed with PBS buffer for 30 minutes at room temperature at a flow rate of 5 μL/min. Unreacted glutaraldehyde was subsequently blocked with 1% BSA (bovine serum albumin) solution in HEPES buffer for one hour at room temperature at a flow rate of 0.5 μL/min. The chip was rinsed with PBS buffer at a flow rate of 5 μL/min for 30 minutes at room temperature before the flow was stopped and the transmission spectra of the PhCs were collected in PBS buffer. Following this, the chip was stored overnight at 4 °C with the microfluidic channel filled with PBS buffer. The next day, PBS in the channel was replaced with PBS-T buffer (PBS supplemented with 0.1% Tween-20) and the transmission spectra of the PhCs were collected in PBS-T buffer. Immediately afterward, a 1:100 dilution of goat-anti-human-IgG tagged latex particles (320 ± 40 nm in diameter) in PBS-T was flowed through the channel at a flow rate of 0.5 μL/min while the transmission spectrum of one PhC sensor was repeatedly measured in real-time. A total of 11 scans were collected at this flow rate. Afterwards, the flow rate was increased to 5 μL/min and another 4 scans were collected. In the next step, the flow was stopped and the transmission spectrum of the other PhC was collected. The particle solution in the channel was subsequently replaced with PBS-T buffer (5 minutes flow at 5 μL/min) and the transmission spectra of both PhCs were collected (3 scans each). Next, the PBS-T in the channel was replaced with PBS buffer and the chip was stored overnight at 4 °C. The next day, the transmission spectra of the PhCs were collected in PBS buffer.
3 Results and Discussion
3.1 Sensor geometry and optical resonance
The 2D slab-PhC sensor design used to perform these studies consisted of a triangular lattice of low-index holes in a 370 nm thick silicon layer, the symmetry of which was broken by both a point-like defect and a W1 PhC waveguide (where “W1” denotes the removal of a single row from a PhC20). The resonant optical mode used for sensing was predominantly confined to the point-like, large-hole defect structure, in which one large hole replaced seven lattice holes (Fig. 1). The lattice constant was 368 nm and the diameters of the lattice and defect holes were 221 nm and 589 nm, respectively. The large-hole defects were centered either 4 rows (Fig. 1a) or 5 rows (Fig. 1b) away from the W1 waveguide, as this geometry was calculated to provide a transmission dip at the resonance wavelength that was neither too broad nor too shallow. As described previously, one advantage of these geometries is the ability to serve as a size-exclusion filter for the detection of target pathogens that are similar in size to, or larger than, the PhC lattice holes, by preventing target infiltration in the insensitive non-defect PhC lattice holes. We focused our design towards selective detection of pox virus-sized particles, which are 200 nm × 300 nm.21 One could however alter the design of the device in order to selectively capture smaller or larger particles.
3.2 Temperature sensitivity
Silicon has a small but non-negligible thermo-optic coefficient22 of −1.86 × 10⁻⁴ K−1, so the frequency of any resonant optical mode that resides within silicon is weakly sensitive to changes in temperature. To experimentally characterize the temperature sensitivity of the optical cavity resonance in the PhC sensors, the wavelength of the cavity resonance was measured at five different chip temperatures: 21 °C, 25 °C, 29 °C, 33 °C, and 37 °C (automated, with an accuracy of ± 0.02 °C). This characterization was conducted with both air and water as cover materials surrounding the sensor. Linear fits applied to the data (Fig. 2) indicated a temperature dependence of dλ/dT = 0.08 nm/°C (R2 > 0.99), both for air and water as the cover materials. This temperature sensitivity is in agreement with the results predicted by a perturbation calculation (Supplementary Information, S2). The expected resonance red-shift that results from particle capture is in excess of 0.5 nm, so while the measured temperature sensitivity does not preclude device operation in the absence of temperature control, we elected to implement precise temperature control to eliminate any temperature related fluctuations in resonance wavelength.
Fig. 2. Temperature sensitivity of optical resonance.
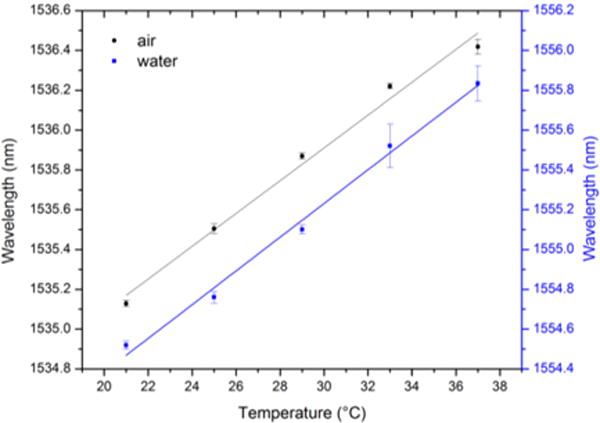
The wavelength of optical resonance (for a large-hole defect centered 4 rows from the W1 waveguide) was measured at 5 temperatures, ranging from room to physiological temperatures, under cover of both air and water. Resonant wavelength values were determined by Lorentzian fit; the mean resonant wavelength is plotted (n=5) and the error bars indicate the standard deviation of the mean. Linear fits were applied to quantify the temperature sensitivity, which was 0.08 nm/°C for both cover media (R2 > 0.99).
3.3 Single-particle sensor response
The response of the 2D PhC was evaluated experimentally using latex particles (un- or antibody-functionalized) as rudimentary virus simulants. While obviously differing from real viruses in their shape and coat proteins, these particles are of similar refractive index (1.59 as reported by the vendor for latex particles vs. 1.41–1.5723,24 for viruses) and size. Before attempting biomolecule-mediated capture of a virus simulant at the sensor surface under microfluidic flow, we first characterized the optical response of the sensor to the infiltration of similarly sized, but unfunctionalized particles in the sensitive large-defect region of the sensor. Drops of a solution containing fluorescent latex particles were pipetted onto the chip surface and allowed to dry. The concentration of particles in suspension was tuned so that single-particle infiltration within the large-hole defect was probable within a few droplet applications.
Fluorescent latex particles with a mean diameter of 290 nm (Thermo-Scientific) were selected for this task because they were larger than non-defect PhC lattice holes (240 nm), but smaller than the large-defect hole (585 nm) sensing region. Fluorescence microscopy permitted visual confirmation of the presence or absence of a particle within the large-hole PhC defect of a given PhC sensor. The particles were not modified with functionalization chemistry, and a 100-fold dilution of the 1% solid stock suspension in distilled, deionized water provided a reasonable particle density for the experiment. After drying on the chip surface, nearly all particles could be removed from the chip after incubation in distilled, deionized water on an orbital shaker.
Prior to particle solution exposure, baseline optical spectra were collected for all PhC sensors on a single chip with both water and air as the cover material. An initial droplet volume of 0.5 μL of the particle dilution was initially pipetted onto the PhC chip surface and was allowed to dry. The sensor chip was inspected via fluorescence microscopy, revealing that particle infiltration had not occurred in any of the large defect structures. The chip was rinsed in ddH2O, allowed to dry, and was again inspected with the fluorescence microscope. The application, inspection, and rinse process were repeated and optical spectra were collected after each particle solution application and rinse. After the third application of the particle solution, visual inspection confirmed that a particle had infiltrated the large-hole defect of one of the PhC sensors. Fig. 3 displays the shifts in resonance wavelength (relative to pre-treatment baseline) observed in PhC sensors both in the presence and absence of a particle in the large-hole defect at the same step. Particle infiltration into the defect hole yielded resonance shifts of 1.18 ± 0.05 nm under cover of water and 2.36 ± 0.05 nm under cover of air, while the PhC without an infiltrated particle displayed shifts of 0.52 ± 0.03 nm and 1.38 ± 0.07 nm, respectively. The shift in resonance from baseline in the absence of particle infiltration is attributed to the accumulation of loose polymer matrix, fluorophore, and surfactant that nonspecifically attached to all surfaces of the PhC during drying steps from the repeated droplet applications. Thus, the difference in net-redshift due to particle infiltration is approximately 0.7 nm (1 nm) for water (air) as the cover material. Most importantly, these results confirmed that the PhC sensor has the potential to achieve single-pathogen detection, even under cover of aqueous media. This experiment also highlighted the ability of the sensor to reject nonspecifically bound material: infiltration of a particle in the defect was readily distinguishable from the large amount of material deposited on the top surface and around the PhC. This is a particular strength of the 2D PhC geometry.
Fig. 3. Single-particle detection under cover of air and water.
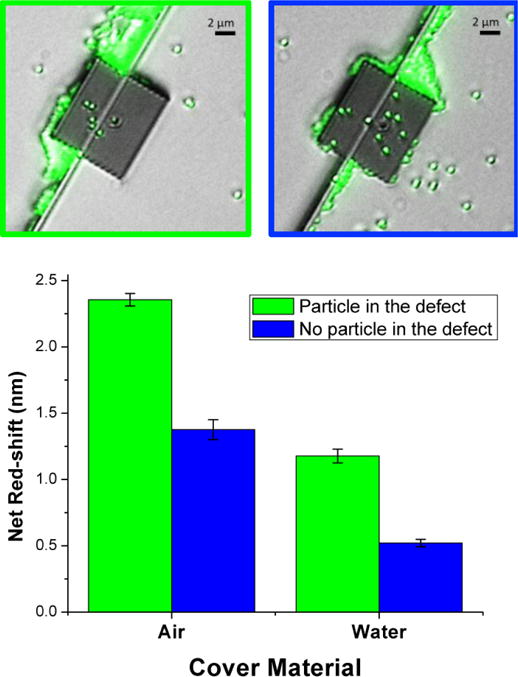
(Top) Fluorescence microscope images of PhC sensors both in the presence (top left) and absence (top right) of a fluorescent latex microsphere within the large-hole defect structure. (Bottom) Mean net red-shifts of the optical resonance wavelength (compared with baseline measurements; as determined by Lorentzian fit), with both air and water as the cover material, for two PhC sensors: one with a latex particle in the large hole defect, and one without. Measurements confirm the potential of the PhC design for single-pathogen detection. The large-hole defect was located 4 rows from the W1 waveguide for both PhC sensors. Error bars were calculated as the root-sum-of-squares of the standard deviations of the mean for baseline and experimental measurements (5 scans per PhC per condition).
3.4 Biomolecule-mediated particle detection in a static environment
As with most biosensors, the specific, reproducible detection of a target biomolecule with PhC sensors requires a reliable capture strategy.9 One of the most common approaches to achieve sensitive and specific detection in surface-based sensors is to immobilize antibodies to the sensor surface that will specifically bind the target of interest. To demonstrate compatibility of our PhC devices with this approach, the sensors were initially modified with silane (3-aminopropyldimethylethoxysilane, APDMES) and glutar-aldehyde (GA), and then with human IgG molecules that can specifically recognize the anti-human IgG-conjugated latex microspheres (virus simulants).
Before applying the surface preparation to the PhC sensor chips, the procedure was tested on flat chips (Si/SiO2) that were subsequently incubated with the solution of anti-human IgG-modified latex particles, rinsed, and imaged via fluorescence microscopy (Figure S3). Particle attachment was negligible on a bare SiO2 surface and on the surface that was treated with silane+GA alone. Minimal particle adhesion was observed on a BSA-blocked silane+GA surface. As expected, particle attachment was well over an order of magnitude greater on the surface that was functionalized with human IgG, confirming the ability of the biochemically modified surface to specifically bind target particles.
The optical responses of the sensors were measured at each step as a direct method for monitoring surface functionalization. Since the observed resonance shift for the silane+GA layer was very small (< 0.2 nm with PBS as cover medium), spectroscopic ellipsometry was performed on a flat region of the PhC sensor chip after that surface preparation step. This indicated that a ~0.9 nm thick surface layer had been deposited. Additional ellipsometry control studies to analyze this and each subsequent step were then also performed on separate, flat Si/SiO2 chips to measure relative layer thicknesses (Figure S4). Silane and GA were attached to the surface by immersing the whole photonic chip in solution, but human IgG and anti-human IgG-coupled particles were delivered via microfluidic flow in order to conserve reagents (human IgG) and to mimic an expected use case for the sensor. Attachment of the capture probe molecules (human IgG) on the sensor surface produced a detectable shift in the optical resonance of the PhC sensor (Fig. 4), thus verifying probe attachment. These resonance shifts were apparent for PhC sensor geometries in which the large-hole defect was centered both 4 and 5 rows away from the W1 waveguide, and with similar magnitude regardless of defect placement or cavity Q-factor. Net red-shifts of ~0.7 nm and ~0.5 nm were observed following particle flow in the two PhC geometries. The observed resonance shifts suggest the infiltration of a single particle in each PhC structure and therefore recognition-mediated detection of single virus simulants using slab-PhCs.
Fig. 4. Sensor response to biomolecule functionalization and biomolecule-mediated particle detection.
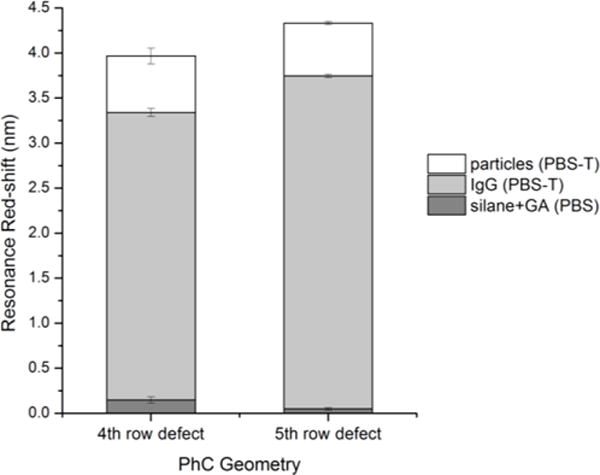
Resonance wavelength shifts were determined for PhC geometries in which the large-defect structure was centered 4 or 5 rows from the W1 waveguide after sequentially exposing the sensors to silane+GA, IgG molecules, and anti-IgG-coupled latex microspheres. The cover medium was either PBS, or PBS with 0.1% Tween-20 (PBS-T), as indicated in the legend. Error bars were calculated as the root-sum-of-squares of the standard deviations of the mean for baseline and experimental measurements. Mean resonance wavelengths and standard deviations were calculated from 5 replicate spectrum scans for all steps except for the particle/PBS-T step, in which only 3 scans each were collected for each PhC to minimize the opportunity for analyte dissociation.
3.5 Biomolecule recognition-mediated particle detection during aqueous flow
To perform detection of virus simulant particles under flow, a surface-functionalized PhC sensor chip was secured into the temperature-controlled, microfluidic clamp assembly so that the particle solution could be delivered via a syringe pump while the PhC optical resonance was simultaneously recorded. The virus simulant particles consisted of 320 ± 40 nm polystyrene microspheres, which were surface-coated with anti-human IgG molecules. These particles specifically attach to the human IgG modified sensor surface. Although the PhC geometry is compatible with multiplexed or redundant detection via multiple PhC sensors on a single waveguide, only a single PhC sensor was monitored for this proof-of-principle experiment. To demonstrate that ultra-high Q-factors are not necessary to achieve single-particle detection, the PhC geometry in which the large-hole defect was closer to the W1 waveguide (Q ≈ 770 in PBS) was selected for this demonstration.
The baseline resonance wavelength for the optical mode that was localized to the large-hole PhC defect was first measured with PBS-T, the carrier buffer for the particles, as the cover material. The particle solution was then flowed through the microfluidic channel above the PhC sensor, while the wavelength of the tunable laser was repeatedly scanned to collect optical transmission spectra. Lorentzian-fit resonance wavelengths of acquired spectra as a function of time are shown in Fig. 5. The initial flow rate for the particle solution was 0.5 μL/min, but it was later increased ten-fold to observe whether the faster flow would serve to dislodge bound target material. The channel was rinsed with PBS-T, and then optical spectra were again collected to assay biochemically bound target capture.
Fig. 5. Biomolecule recognition-mediated detection of virus simulant under microfluidic flow.
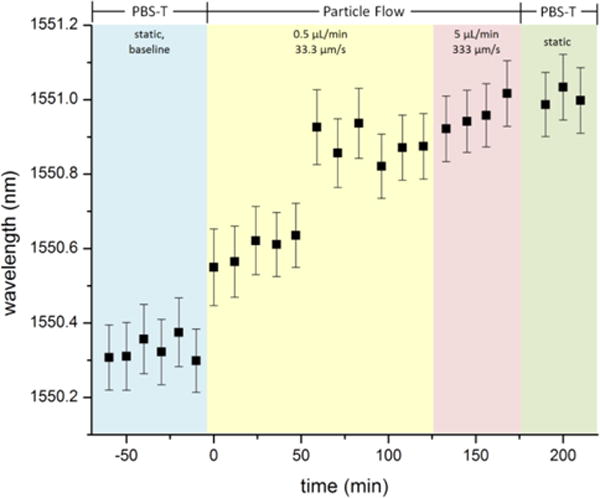
Resonant wavelength as a function of time for a PhC geometry with the large-hole defect centered 4 rows from the W1 waveguide. The first 5 data points correspond to the baseline measurement under cover of PBS-T (no flow). Optical spectra were collected as a solution of virus-simulants (320 ± 40 nm latex particles coupled with anti-human IgG molecules) suspended in PBS-T flowed over the PhC sensor. The channel volume was replaced with PBS-T without particles before the last three measurements (no flow). Error bars indicate the error of the Lorentzian function fit to the dip in each individual transmission spectrum.
The introduction of virus-simulant particles into the flow chamber resulted in a significant red-shift in the wavelength of the optical mode resonance of the PhC sensor. Furthermore, the total magnitude of optical resonance shift observed over the time-course of particle flow is consistent with the resonance shift that resulted from the infiltration of a single microsphere into the large-hole defect of the sensor (with aqueous cover). Interestingly, the profile of the time trace is dominated by two discrete jumps in resonance wavelength. One potential explanation for this is that a particle initially attached to the side wall of the large-hole defect structure near the top, by the rim, before later becoming attached deeper within the defect cylinder due to a combination of antibody binding kinetics, Brownian motion, and fluid drag forces from microfluidic flow. While it is also possible that the two discrete jumps represent interactions between the large defect hole and more than one nanoparticle, this is unlikely given the magnitude of the response. The resonance remained shifted even after the microfluidic channel was rinsed and replaced with particle-free buffer. This is expected behavior. While we do not know the precise dissociation constant (KD) for the IgG – anti-IgG interaction, the particle is able to participate in multivalent binding (multiple copies of anti-IgG on the particle interacting with multiple IgG molecules on the surface). This fact, combined with the high density of binding sites increasing the probability of rapid re-binding, means that particle loss is unlikely. This contrasts with a preliminary experiment in which amine-functionalized particles were flowed over an unfunctionalized PhC (Supplementary Information). In that case, although the magnitude of the shift was similar suggesting particle capture, it was reversible, as one would expect for low-affinity electrostatic binding.
4. Conclusions
Recognition-mediated high-sensitivity particle detection is a critical prerequisite to the development of effective integrated photonic virus sensors. Results reported here demonstrate that 2D slab-PhC structures are able to fill this role. A W1 waveguide-coupled slab-PhC functionalized with IgG antibodies and integrated with a simple microfluidic channel on a temperature-controlled sample stage yielded an optical response when exposed to virus-sized, anti-IgG-functionalized particles under flow. This response was consistent with particle infiltration into the defect hole in the slab-PhC, as confirmed by static measurements and fluorescence microscopy on samples using fluorescent particles.
As rudimentary, non-hazardous simulants for viruses, we employed antibody-functionalized latex particles with a pre-conjugation diameter of 320 nm (similar to the dimensions of vaccinia or variola virus).21,25 Consistent with theory, the 2D PhC responds to infiltration of a single particle into the defect “hole”. Achieving true single particle analytical sensitivity, however (i.e. detection of a single particle in an ultra-low concentration sample of arbitrary volume) will require implementation of several strategies to increase the probability of defect infiltration. First, as we have shown previously, confining antibody functionalization to the active area of the sensor enhances achievable sensitivity by at least a factor of 10, by limiting nonproductive capture events. Second, recent reports by Descharmes et al.26,27 and our group28 indicate that optical forces generated by a 2D PhC are useful for particle trapping, and may prove useful as an adjunct to recognition-mediated capture. Finally, sensitivity can be further enhanced through parallelism: the small size of the 2D PhC and compatibility with CMOS fabrication means that many identically functionalized sensors operating either in series or in parallel may be implemented in a small chip area, providing a “brute force” sensitivity enhancement at low cost. Efforts to test these concepts are in progress in our laboratories.
Supplementary Material
Acknowledgments
Support from the NIH (R01AI08077-01, via NIAID, NIBIB, and NIGMS) is gratefully acknowledged. JEB was partially supported by NIAMS – T32AR007472. We thank the University of Rochester’s Health Sciences Center for Computational Innovation (HSCCI) and Center for Integrated Research Computing (CIRC) for providing computing systems and support for computational simulations. Device fabrication was performed in part at the Cornell NanoScale Facility, a member of the National Nanotechnology Coordinated Infrastructure (NNCI), which is supported by the National Science Foundation (Grant ECCS-1542081).
Footnotes
Electronic Supplementary Information (ESI) available: [details of any supplementary information available should be included here]. See DOI: 10.1039/x0xx00000x
References
- 1.Giljohann DA, Mirkin CA. Nature. 2009;462:461–464. doi: 10.1038/nature08605. [DOI] [PMC free article] [PubMed] [Google Scholar]
- 2.Daaboul GG, Yurt A, Zhang X, Hwang GM, Goldberg BB, Ünlü MS. Nano Lett. 2010;10:4727–4731. doi: 10.1021/nl103210p. [DOI] [PubMed] [Google Scholar]
- 3.Block O, Mitra A, Novotny L, Dykes C. J Virol Methods. 2012;182:709–75. doi: 10.1016/j.jviromet.2012.03.012. [DOI] [PMC free article] [PubMed] [Google Scholar]
- 4.Zhuo Y, H H, Chen W, Lu M, Tian L, Yu H, Long KD, Chow E, King WP, Singamaneni S, Cunningham BT. Analyst. 2014;139:1007–1015. doi: 10.1039/c3an02295a. [DOI] [PubMed] [Google Scholar]
- 5.Huang M, Galarreta BC, Cetin AE, Altug H. Lab Chip. 2013;13:4841–4847. doi: 10.1039/c3lc50814e. [DOI] [PubMed] [Google Scholar]
- 6.Fan X, White IM, Shopova SI, Zhu H, Suter JD, Sun Y. Anal Chim Acta. 2008;620:8–26. doi: 10.1016/j.aca.2008.05.022. [DOI] [PMC free article] [PubMed] [Google Scholar]
- 7.Vollmer F, Arnold S, Keng D. Proc Natl Acad Sci U S A. 2008;105:20701–20704. doi: 10.1073/pnas.0808988106. [DOI] [PMC free article] [PubMed] [Google Scholar]
- 8.Dantham VR, Holler S, Kolchenko V, Wan Z, Arnold S. Appl Phys Lett. 2012;101:043704. [Google Scholar]
- 9.Baker JE, Sriram R, Miller BL. Lab Chip. 2015;15:971–990. doi: 10.1039/c4lc01208a. [DOI] [PMC free article] [PubMed] [Google Scholar]
- 10.Zhang Y, Zhao Y, Lv R. Sens Act A. 2015;233:374–389. [Google Scholar]
- 11.Scullion MG, Krauss TF, Di Falco A. Sensors. 2015;13:3675–3710. doi: 10.3390/s130303675. [DOI] [PMC free article] [PubMed] [Google Scholar]
- 12.Yan H, Zou Y, Chakravarty S, Yang CJ, Wang Z, Tang N, Fan D, Chen RT. Appl Phys Lett. 2015;106:121103. doi: 10.1063/1.4916340. [DOI] [PMC free article] [PubMed] [Google Scholar]
- 13.Zou Y, Chakravarty S, Lai WC, Lin CY, Chen RT. Lab Chip. 2012;12:2309–2312. doi: 10.1039/c2lc40081b. [DOI] [PMC free article] [PubMed] [Google Scholar]
- 14.Baker JE, Miller BL. Opt Express. 2015;23:7101–7110. doi: 10.1364/OE.23.007101. [DOI] [PMC free article] [PubMed] [Google Scholar]
- 15.Lee MR, Fauchet PM. Opt Lett. 2007;32:3284–3286. doi: 10.1364/ol.32.003284. [DOI] [PubMed] [Google Scholar]
- 16.Pal S, Guillermain E, Sriram R, Miller BL, Fauchet PM. Biosens Bioelectron. 2011;26:4024–4031. doi: 10.1016/j.bios.2011.03.024. [DOI] [PMC free article] [PubMed] [Google Scholar]
- 17.Pal S, Yadav AR, Lifson MA, Baker JE, Fauchet PM, Miller BL. Biosens Bioelectron. 2013;44:229–234. doi: 10.1016/j.bios.2013.01.004. [DOI] [PMC free article] [PubMed] [Google Scholar]
- 18.Sriram R, Baker JE, Fauchet PM, Miller BL, L B. Proc SPIE. 2013;8850:857007–1. [Google Scholar]
- 19.Oskooi AF, Roundy D, Ibanescu M, Bermel P, Joannopoulos JD, Johnson SG. Comput Phys Commun. 2010;181:687–702. [Google Scholar]
- 20.Olivier S, Rattier M, Benisty H, Weisbuch C, Smith CJM, De La Rue RM, Krauss TF, Oesterle Y, Houdré R. Phys Rev B. 2001;63:113311. doi: 10.1364/ol.26.001019. [DOI] [PubMed] [Google Scholar]
- 21.International Committee on Taxonomy of Viruses. http://www.ictvdb.org.
- 22.Cocorullo G, Rendina I. Electron Lett. 1992;28:83. [Google Scholar]
- 23.Zhu H, White IM, Suter JD, Zourob M, Fan X. Analyst. 2008;133:356–360. doi: 10.1039/b716834a. [DOI] [PubMed] [Google Scholar]
- 24.Pang Y, Song H, Cheng W. Biomed Opt Express. 2016;7:1672–1689. doi: 10.1364/BOE.7.001672. [DOI] [PMC free article] [PubMed] [Google Scholar]
- 25.Cyrklaff M, Risco C, Fernandez JJ, Jimenez MV, Esteban M, Baumeister W, Carrascosa JL. Proc Natl Acad Sci USA. 2005;102:2772–2777. doi: 10.1073/pnas.0409825102. [DOI] [PMC free article] [PubMed] [Google Scholar]
- 26.Descharmes N, Dharanipathy UP, Diao Z, Tonin M, Houdré R. Lab Chip. 2013;13:3268–3274. doi: 10.1039/c3lc50447f. [DOI] [PubMed] [Google Scholar]
- 27.Descharmes N, Dharanipathy U, Diao Z, Tonin M, Houdré R. Phys Rev Lett. 2013;110:123601. doi: 10.1103/PhysRevLett.110.123601. [DOI] [PubMed] [Google Scholar]
- 28.Heiniger AT, Miller BL, Fauchet PM. Opt Express. 2015;23:25072–25083. doi: 10.1364/OE.23.025072. [DOI] [PubMed] [Google Scholar]
Associated Data
This section collects any data citations, data availability statements, or supplementary materials included in this article.


