

Abstract
Weight, height, sitting height, and 24 other anthropometric variables (5 body circumferences, skinfolds at 7 sites, 4 head dimensions, and 8 hand and foot measurements) were obtained on 38 Prader-Labhart-Willi syndrome (PLWS) individuals (21 with apparent chromosome 15 deletions and 17 nondeletion cases) with an age range of 2 weeks to 38½ years. More than half of these individuals were measured on more than one occasion. The measurements confirmed the presence of short stature, small hands and feet, obesity, and narrow bi-frontal diameter in PLWS. No differences were found for the anthropometric measurements between the 2 chromosome subgroups. Inverse correlations were produced with linear measurements (eg, height, hand and foot lengths) and age, which indicated a deceleration of linear growth relative to normal individuals with increasing age.
Keywords: chromosome 15 deletion, correlation studies
INTRODUCTION
The Prader-Labhart-Willi syndrome (PLWS), generally sporadic in occurrence, is characterized by infantile hypotonia, early childhood obesity, mental deficiency, short stature, small hands and feet, and hypogonadism. The incidence of PLWS has been estimated at one in 25,000 live-births and accounts for about 1 % of all mentally retarded persons [Zellweger and Soper, 1979]. The cause of this syndrome is not clear, although a chromosome deletion has been found recently in about one-half of PLWS individuals [Ledbetter et al, 1982; Butler and Palmer, 1983; Mattei et al, 1984].
Few, if any, comprehensive anthropometric studies of PLWS patients have been conducted. Longitudinal studies of PLWS individuals are also rare. Herein, we report results from anthropometric studies of 38 PLWS individuals with emphasis on chromosome findings.
MATERIALS AND METHODS
Subjects included in this study were diagnosed as having PLWS on the basis of infantile hypotonia, hypogonadism, delayed psychomotor development and/or mental retardation, early childhood obesity, small hands and feet, and short stature. The sample included 22 males and 16 females ranging in age from 2 weeks to 38½ years with a mean age of 13 1/12 years.
All of the anthropometric measurements were made by one of the authors (F.J.M.) according to standard techniques as presented by Weiner and Lourie [1969]. The longitudinal data were collected over a period of 3½ years.
The measurements consisted of the following: weight, height (or length), sitting height, total hand length, palm length, middle finger length, hand breadth, wrist breadth, ankle breadth, total foot length, foot breadth, head length, head breadth, minimum frontal diameter, maximum frontal diameter, chest circumference, waist circumference, upper arm circumference, calf circumference, head circumference, triceps skinfold, subscapular skinfold, forearm skinfold, supra-iliac skinfold, abdomen skinfold, thigh skinfold, and medial calf skinfold. Up to the age of 2 years, length was measured using a horizontal calibrated board in supine position, and thereafter height measurements were taken. Skinfold measurements were obtained to the nearest half millimeter with a Lange Skinfold Caliper. Circumferences were obtained to the nearest millimeter with a steel tape. Weight and height were measured using a balanced-beam scale and anthropometer, respectively.
Z scores were computed using normative measurements to control for age and sex effects. Z scores were calculated from the following formula: where SD is standard deviation of the normal control; is the mean of the normal control; and X is the measurement of the subject. Normative values were obtained from several sources [National Center for Health Statistics, 1970, 1972, 1974a,b, 1977; Tanner and Whitehouse, 1975; Snyder et al, 1977; Farkas, 1981].
High-resolution chromosome analysis was performed on the 38 PLWS individuals. Twenty-one PLWS individuals were identified with an apparent deletion of the proximal long arm of chromosome 15 and normal chromosome findings in the remaining 17 individuals.
RESULTS
Table I shows clinical data of the 38 patients. Z score data are shown in Table II for 15 anthropometric measurements. It was impossible to calculate Z scores for all measurements because adequate normative data do not exist. A summary of PLWS anthropometric measurements is shown in Table III.
TABLE I.
Clinical and Cytogenetic Data From 38 Prader-Labhart-Willi Syndrome Individuals*
| Case No. | Sex | Birth date | Bone age (years) | Parental age (years)
|
BW (g) | BL (cm) | Karyotype | No. of times measured | |
|---|---|---|---|---|---|---|---|---|---|
| Maternal | Paternal | ||||||||
| 1 | F | 9-23-81 | 23 | 25 | 2,210 | 48.0 | del (15q) | 10 | |
| 2 | M | 7-27-80 | BA=2 CA=2 | 30 | 31 | 2,980 | 48.3 | del (15q) | 5 |
| 3 | M | 10-28-78 | 22 | 21 | 4,170 | 53.3 | del (15q) | 1 | |
| 4 | F | BA = 6/12 CA= 10/12 | 23 | 25 | 2,550 | 48.3 | del (15q) | 3 | |
| 5 | M | 10-19-76 | 30 | 39 | 2,580 | 53.3 | del (15q) | 2 | |
| 6 | F | 1-7-77 | 26 | 27 | 2,690 | 52.1 | del (15q) | 1 | |
| 7 | M | 10-23-72 | BA = 10 CA = 10 1/2 | 21 | 23 | 2,550 | 48.3 | del (15q) | 3 |
| 8 | F | 5-10-70 | BA = 13 1/2 CA = 13 1/12 | 28 | 28 | 2,300 | 45.7 | del (15q) | 1 |
| 9 | M | 7-19-69 | BA = 11 1/2 CA = 11 10/12 | 20 | 35 | 2,410 | 53.3 | del (15q) | 4 |
| 10 | M | 11-23-67 | Delayed | 26 | 26 | 3,860 | del (15q) | 1 | |
| 11 | F | 10-25-65 | BA = 15 CA = 17 7/12 | 31 | 34 | 3,010 | 49.5 | del (15q) | 1 |
| 12 | M | 8-26-65 | 30 | 36 | 3,370 | 52.1 | del (15q) | 1 | |
| 13 | F | 6-26-65 | BA = 17 CA = 17 | 25 | 27 | 2,810 | 50.8 | del (15q) | 1 |
| 14 | M | 10-27-64 | 20 | 22 | 3,350 | 49.5 | del (15q) | 1 | |
| 15 | M | 10-9-64 | BA = 18 CA = 18 5/12 | 27 | 26 | 2,270 | 50.8 | del (15q) | 1 |
| 16 | F | 10-2-61 | 20 | 21 | 3,150 | 52.1 | del (15q) | 4 | |
| 17 | F | 8-15-61 | 19 | 22 | 1,960 | 53.3 | del (15q) | 1 | |
| 18 | F | 7-10-59 | 29 | 32 | del (15q) | 2 | |||
| 19 | M | 3-11-59 | BA = 18 CA = 18 | 39 | 40 | 2,570 | 48.3 | del (15q) | 1 |
| 20 | F | 5-15-48 | 22 | 27 | 2,640 | 49.5 | del (15q) | 1 | |
| 21 | M | 10-14-43 | 3,260 | del (15q) | 1 | ||||
| 22 | M | 3-7-80 | 27 | 26 | 3,100 | 47.0 | 46,XY | 2 | |
| 23 | F | 9-25-79 | 21 | 23 | 2,310 | 48.3 | 46,XX | 1 | |
| 24 | M | 12-11-79 | 22 | 32 | 4,250 | 57.2 | 46,XY | 1 | |
| 25 | M | 10-22-76 | BA=2 8/12 CA = 4 | 22 | 25 | 3,060 | 50.8 | 46,XY | 1 |
| 26 | F | 10-14-74 | BA=4 8/12 CA = 6 8/12 |
21 | 23 | 2,160 | 53.3 | 46,XX | 4 |
| 27 | M | 6-21-75 | BA = 5 4/12 | 31 | 34 | 3,520 | 48.3 | 46,XY | 1 |
| 28 | M | 3-7-75 | CA=5 7/12 | 24 | 24 | 2,610 | 48.3 | 46,XY | 1 |
| 29 | M | 4-27-74 | BA=7 9/12 CA=7 3/12 | 25 | 26 | 3,030 | 50.8 | 46,XY | 3 |
| 30 | M | 11-4-70 | BA=8 | 17 | 20 | 3,460 | 48.3 | 46,XY | 3 |
| 31 | M | 7-22-69 | CA = 10 7/12 BA = 10 1/2 | 26 | 24 | 3,200 | 50.8 | 46,XY | 3 |
| 32 | F | 5-29-70 | CA = 11 10/12 BA=9 | 23 | 43 | 2,380 | 46,XX | 1 | |
| 33 | F | 8-16-67 | CA = 10 5/12 BA = 8/12 | 37 | 47 | 3,350 | 48.0 | 46,XX | 2 |
| 34 | F | 10-18-66 | CA = 1 2/12 BA = 14 7/12 | 18 | 24 | 2,270 | 48.3 | 46,XX | 2 |
| 35 | F | 11-22-66 | CA = 14 8/12 BA = 15 10/12 CA = 16 1/2 | 42 | 44 | 3,880 | 48.3 | 46,XX | 1 |
| 36 | M | 5-25-65 | 21 | 22 | 3,000 | 46,XY | 1 | ||
| 37 | M | 1-6-63 | 40 | 46 | 3,430 | 48.3 | 46,XY | 1 | |
| 38 | M | 11-4-57 | 19 | 21 | 2,840 | 52.1 | 46,XY | 2 | |
F, female; M, male; BA, bone age; CA, chronological age; BW, birth weight; BL, birth length.
TABLE II.
Z Score Means and Standard Deviations for 15 Anthropometric Variables of Deletion and Nondeletion Prader-Labhart-Willi Syndrome Individuals
| Variables | Deletion (N=21)
|
Nondeletion (N=17)
|
||
|---|---|---|---|---|
| Mean | SD | Mean | SD | |
| Weight | 2.33 | 3.02 | 1.33 | 3.07 |
| Height | −1.88 | 1.22 | −2.43 | 1.42 |
| Sitting height | −1.03 | 1.34 | −1.43 | 1.25 |
| Hand length | −1.60 | 1.12 | −1.81 | 1.12 |
| Finger length | −1.78 | 1.39 | −2.41 | 1.14 |
| Hand breadth | −1.73 | 1.63 | −1.85 | 1.55 |
| Foot length | −2.16 | 1.17 | −2.34 | 1.32 |
| Foot breadth | −1.70 | 1.70 | −2.08 | 1.53 |
| Head circumference | −1.18 | 1.06 | −0.95 | 0.91 |
| Head length | −0.86 | 1.06 | −0.71 | 0.76 |
| Head breadth | −1.72 | 0.85 | −2.12 | 0.76 |
| Arm circumference | 2.47 | 2.08 | 1.91 | 2.70 |
| Calf circumference | 2.14 | 2.00 | 1.18 | 2.61 |
| Triceps skinfolda | 2.47 | 1.23 | 2.92 | 2.19 |
| Subscapular skinfolda | 2.88 | 1.92 | 3.85 | 3.93 |
N= 15 for both subgroups.
TABLE III.
Summary of Prader-Willi Syndrome Anthropometric Measurements
| Measurement | Proband chromosome subgroup
|
|||
|---|---|---|---|---|
| Deletion
|
Nondeletion
|
|||
| n | % | n | % | |
| Height | ||||
| <−2SD | 9/21 | (43) | 9/17 | (53) |
| <−l SD | 14/21 | (67) | 13/17 | (76) |
| >1 SD | 0/21 | (0) | 0/17 | (0) |
| >2 SD | 0/21 | (0) | 0/17 | (0) |
| Weight | ||||
| <−2SD | 1/21 | (5) | 2/17 | (12) |
| <−l SD | 2/21 | (10) | 4/17 | (23) |
| >1 SD | 13/21 | (62) | 7/17 | (41) |
| >2 SD | 11/21 | (52) | 6/17 | (35) |
| Sitting height | ||||
| <−2SD | 4/21 | (19) | 4/17 | (23) |
| <−l SD | 10/21 | (48) | 10/17 | (59) |
| Upper arm circumference | ||||
| <−2SD | 0/21 | (0) | 1/17 | (6) |
| <−1 SD | 1/21 | (5) | 2/17 | (12) |
| > 1 SD | 16/21 | (76) | 8/17 | (47) |
| >2 SD | 11/21 | (52) | 7/17 | (41) |
| Waist circumference | ||||
| <−2SD | 0/18 | (0) | 0/17 | (0) |
| <−1 SD | 0/17 | (0) | 1/17 | (6) |
| >1 SD | 15/18 | (83) | 10/17 | (59) |
| >2 SD | 14/18 | (78) | 8/17 | (47) |
| Calf circumference | ||||
| <−2SD | 0/21 | (0) | 2/17 | (12) |
| <−l SD | 0/21 | (0) | 4/17 | (24) |
| >1 SD | 15/21 | (71) | 6/17 | (35) |
| >2 SD | 11/21 | (52) | 6/17 | (35) |
| Triceps skinfold | ||||
| <−2 SD | 0/15 | (0) | 0/15 | (0) |
| <−l SD | 0/15 | (0) | 0/15 | (0) |
| >1 SD | 14/15 | (93) | 12/15 | (80) |
| >2 SD | 9/15 | (60) | 10/15 | (67) |
| Subscapular skinfold | ||||
| <−2 SD | 0/15 | (0) | 1/15 | (7) |
| <−l SD | 1/15 | (7) | 1/15 | (7) |
| >1 SD | 12/15 | (80) | 11/15 | (73) |
| >2 SD | 10/15 | (67) | 11/15 | (73) |
| Hand length | ||||
| <−2 SD | 6/21 | (29) | 5/17 | (29) |
| <−l SD | 14/21 | (67) | 13/17 | (76) |
| Middle finger length | ||||
| <−2 SD | 9/21 | (43) | 12/17 | (71) |
| <−l SD | 14/21 | (67) | 14/17 | (82) |
| Hand breadth | ||||
| <−2 SD | 8/21 | (38) | 8/17 | (47) |
| <−l SD | 14/21 | (67) | 10/17 | (59) |
| >1 SD | 0/21 | (0) | 1/17 | (6) |
| >2 SD | 0/21 | (0) | 0/17 | (0) |
| Foot length | ||||
| <−2 SD | 11/21 | (52) | 10/17 | (59) |
| <−l SD | 19/21 | (90) | 13/17 | (76) |
| Foot breadth | ||||
| <−2 SD | 9/21 | (43) | 9/17 | (53) |
| <−l SD | 13/21 | (62) | 11/17 | (65) |
| >1 SD | 1/21 | (5) | 0/17 | (0) |
| >2 SD | 0/21 | (0) | 0/17 | (0) |
| Both hand and foot length | ||||
| <−2 SD | 6/21 | (29) | 5/17 | (29) |
| <−l SD | 14/21 | (67) | 13/17 | (76) |
| Head circumference | ||||
| <−2 SD | 6/21 | (29) | 2/17 | (12) |
| <−l SD | 12/21 | (57) | 8/17 | (47) |
| Head length | ||||
| <−2 SD | 3/21 | (14) | 2/17 | (12) |
| <−1 SD | 10/21 | (48) | 7/17 | (41) |
| Head breadth | ||||
| <−2 SD | 9/21 | (43) | 9/17 | (53) |
| <−l SD | 17/21 | (81) | 16/17 | (94) |
| Frontal diameter | ||||
| <−2 SD | 15/17 | (88) | 12/14 | (86) |
| <−l SD | 17/17 | (100) | 14/14 | (100) |
| Dolichocephaly | ||||
| C.I.a <75% | 11/21 | (52) | 12/17 | (71) |
| C.I.a <77% | 14/21 | (67) | 15/17 | (88) |
C.I. is cephalic index, which is equal to (Head breadth)/(Head length) × 100.
Longitudinal anthropometric measurements were obtained on several PLWS individuals. Figures 1–9 show the growth curves for weight, height, sitting height, hand length, finger length, hand breadth, foot length, and foot breadth. Most males and females were overweight, but weight loss was achieved with a controlled diet in some individuals (Figs. 1, 2). More females than males were below the 5th centile for height, particularly from 2 to 16 years. Most females and males were in the normal range for sitting height, indicating that the short stature (common in this syndrome) may be related to a shorter lower body segment compared with upper body in both sexes. Most females had hand and foot length at or below the 5th centile while males were grouped between the 50th centile and at or below the 5th centile. Similar findings were observed with middle finger length, foot breadth, and hand breadth. No differences were found in the anthropometric measurements between the 2 chromosome subgroups.
Fig. 1.
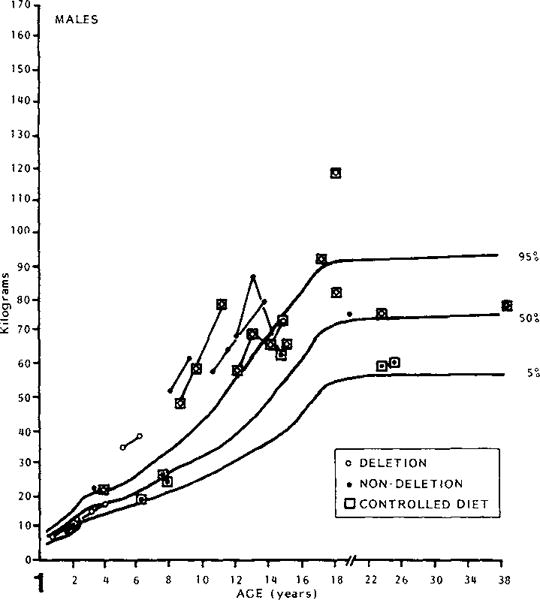
Weight of PLWS males plotted against chronological age.
Fig. 9.
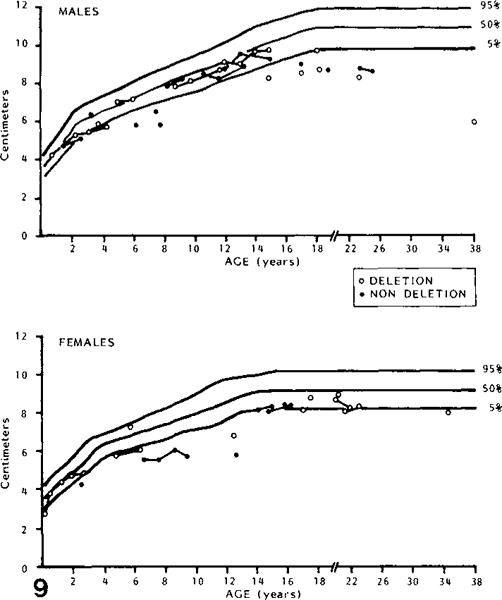
Foot breadth of PLWS males and females plotted against chronological age.
Fig. 2.
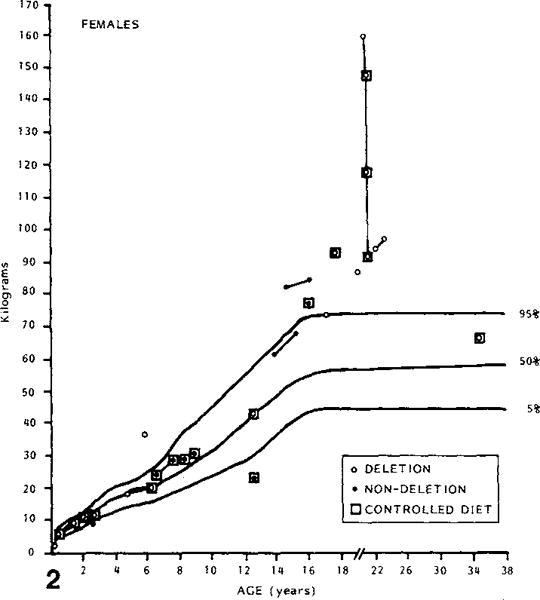
Weight of PLWS females plotted against chronological age.
Although the anthropometric measurements were standardized for age and sex, several of these measurements were inversely correlated with age [Ward and Meaney, 1984]. There was no difference between deletion and nondeletion individuals with age effect.
DISCUSSION
No difference in anthropometric measurements was found between the 2 PLWS subgroups. A larger survey of PLWS patients and first-degree relatives and longitudinal studies of PLWS individuals are needed before a final conclusion may be reached with regard to anthropometric differences between the 2 chromosome subgroups or between sexes.
Although anthropometric measurements were standardized for age and sex, several measurements were inversely correlated with age [Ward and Meaney, 1984]. For example, correlations between anthropometric Z score variables and age were negative for the 19 hand bones, height, sitting height, hand and foot measurements, and head circumference and length. No relationship was found between age and Z scores for weight, head breadth, minimum frontal breadth, skinfolds, and body circumferences. It has been suggested elsewhere [Ward and Meaney, 1984] that these relationships may represent a relative deceleration in linear growth with increasing age in PLWS individuals as compared with normal individuals. The origins of the short stature and other decreased linear measurements in PLWS patients are not clear. Attempts to treat PLWS individuals with anabolic steroids have met with limited success in improving their overall growth and stature [Nugent and Holm, 1981]. Research to understand growth deficiency in PLWS is underway [Nugent and Holm, 1981].
Measurements of fatness such as skinfold thicknesses, particularly over the triceps, may reflect a predisposition toward development of excessive fatness or obesity in PLWS individuals before this is evident by physical examination [Ward and Meaney, 1984]. Early postnatal growth measurements of height and weight in combination with an assessment of fatness development may provide an improved means of PLWS diagnosis in infants in which the clinician has observed characteristics such as hypotonia, hypogonadism, low birth weight, and feeding problems.
Earlier diagnosis of PLWS might eventually improve the chances for more effective dietary management. While it may be of some benefit to use growth in height and weight in attempting to assess the development of obesity in suspected PLWS patients, the results from this study suggest that skinfold measurements should also be taken and obesity judged by this criterion. If the problem in these patients is in part due to excess deposition of fat, it would seem pertinent to monitor carefully the development of fatness in suspected patients. Criteria for the diagnosis of obesity have been suggested by Garn et al [1975, 1980] and standards for skinfolds and arm and muscle circumferences are available for clinical use [Frisancho, 1974]. If larger series of measurements and continued observations of the patients reported herein confirm these findings, measurements of skinfold thickness and upper arm circumference as well as MCPP analysis [Butler and Meaney, 1985] may provide a relatively simple method for aiding in the early diagnosis of infants suspected to have Prader-Labhart-Willi syndrome.
Fig. 3.
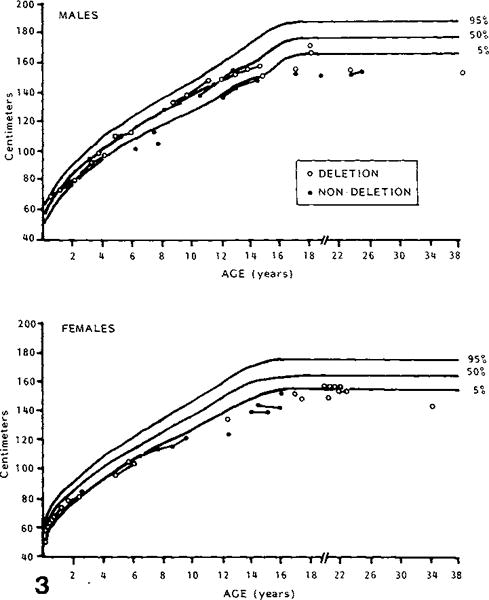
Height of PLWS males and females plotted against chronological age.
Fig. 4.
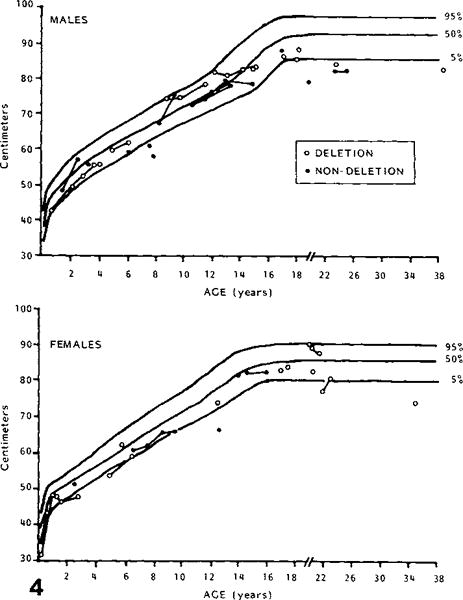
Sitting height of PLWS males and females plotted against chronological age.
Fig. 5.

Hand length of PLWS males and females plotted against chronological age.
Fig. 6.

Middle finger length of PLWS males and females plotted against chronological age.
Fig. 7.
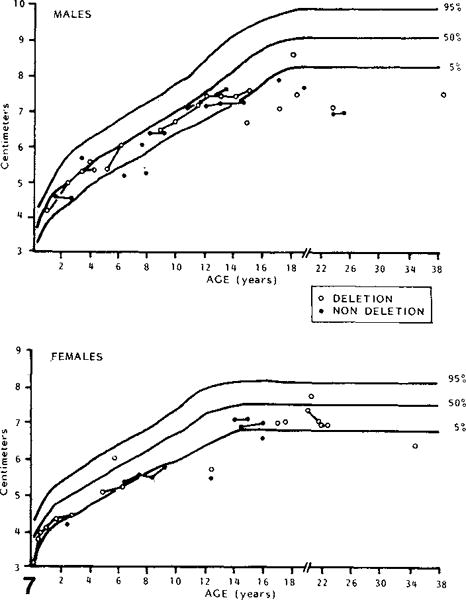
Hand breadth of PLWS males and females plotted against chronological age.
Fig. 8.
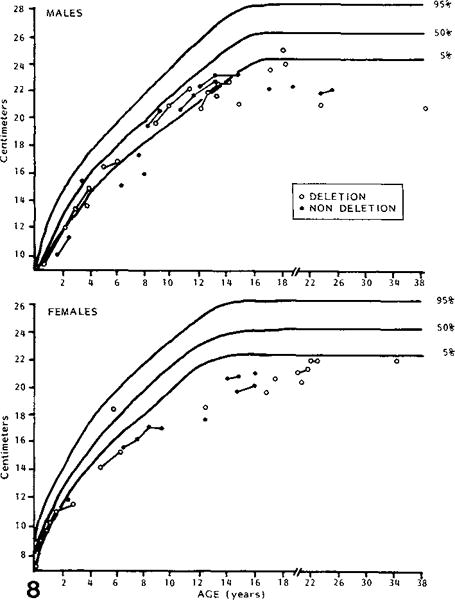
Foot length of PLWS males and females plotted against chronological age.
Acknowledgments
The authors wish to thank Drs. Rebecca Wappner, Bryan Hall, Patricia Bader, and Andree Walczak for allowing us to evaluate their patients. We also thank Judy Copeland for expert preparation of the manuscript. This reasearch was supported by PHS-5T32 GM07468 (M.G.B.) and PHS-T32 DE07043 (F.J.M.). The authors acknowledge use of the facilities of Computing Services, Indiana University-Purdue University, Indianapolis.
Footnotes
Edited by John M. Opitz and James F. Reynolds
Contributor Information
Merlin G. Butler, Division of Genetics, Department of Pediatrics, Vanderbilt University School of Medicine, Nashville, Tennessee
F. John Meaney, Department of Medical Genetics, Indiana University School of Medicine and Genetic Diseases Section, Indiana State Board of Health, Indianapolis, Indiana.
References
- Butler MG, Meaney FJ. Metacarpophalangeal pattern profile analysis in Prader-Willi syndrome: A follow-up report on 38 cases. Clin Genet. 1985;28:27–30. doi: 10.1111/j.1399-0004.1985.tb01213.x. [DOI] [PMC free article] [PubMed] [Google Scholar]
- Butler MG, Palmer CG. Parental origin of chromosome 15 deletion in Prader-Willi syndrome. Lancet. 1983;1:1285–1286. doi: 10.1016/s0140-6736(83)92745-9. [DOI] [PMC free article] [PubMed] [Google Scholar]
- Farkas LG. Anthropometry of the Head and Face in Medicine. New York: Elsevier North Holland Inc; 1981. [Google Scholar]
- Frisancho AR. Triceps skinfold and upper arm muscle size norms for assessment of nutritional status. Am J Clin Nutr. 1974;27:1052–1058. doi: 10.1093/ajcn/27.8.1052. [DOI] [PubMed] [Google Scholar]
- Garn SM, Clark DC, Guire KE. Growth, body composition, and development of obese and lean children. Curr Concepts Nutr. 1975;3:23–46. [PubMed] [Google Scholar]
- Garn SM, Bailey SM, Cole PE. Continuities and changes in fatness and obesity. In: Schemmel R, editor. Nutrition, Physiology, and Obesity. Boca Raton, Florida: CRC Press Inc; 1980. pp. 51–78. [Google Scholar]
- Ledbetter DH, Mascarello JT, Riccardi VM, Harper VD, Airhart SD, Strobel RJ. Chromosome 15 abnormalities and the Prader-Willi syndrome: A follow-up report of 40 cases. Am J Hum Genet. 1982;34:278–285. [PMC free article] [PubMed] [Google Scholar]
- Mattei MG, Souiah N, Mattei JF. Chromosome 15 anomalies and the Prader-Willi syndrome: Cytogenetic analysis. Hum Genet. 1984;66:313–334. doi: 10.1007/BF00287636. [DOI] [PubMed] [Google Scholar]
- National Center for Health Statistics. Vital and Health Statistics. Washington: U.S. Govt. Printing Office; 1970. Skinfolds, body girths, biacromial diameter, and selected anthropometric indices of adults, United States, 1960–62. (Series 11-No 35. PHS Pub No 1000. Public Health Service). [PubMed] [Google Scholar]
- Washington.National Center for Health Statistics. Health Services and Mental Health Administration. U.S. Govt. Printing Office; 1972. Skinfold thickness of children 6–11 years, United States. Vital and Health Statistics. (Series 11-No 120 DHEW Pub No (HSM) 73-1602). [PubMed] [Google Scholar]
- National Center for Health Statistics. Vital and Health Statistics. Washington: U.S. Govt. Printing Office; 1974a. Skinfold thickness of youths 12–17 years, United States. (Series 11-No 132 DHEW Pub No (HRA) 74-1614. Health Resources Administration). [Google Scholar]
- National Center for Health Statistics. Vital and Health Statistics. Washington: U.S. Govt. Printing Office; 1974b. Body dimensions and proportions, white and negro children 6–11 years, United States. (Series 11-No 143. DHEW Pub No (HRA) 75-1625. Health Resources Administration). [PubMed] [Google Scholar]
- National Center for Health Statistics. Vital and Health Statistics. Washington: U.S. Govt. Printing Office; 1977. NCHS growth curves for children, birth-18 years, United States. (Series 11-No 165 DHEW Pub No (PHS) 78-1650. Public Health Service). [PubMed] [Google Scholar]
- Nugent JK, Holm VA. Physical growth in Prader-Willi syndrome. In: Holm VA, Sulzbacher S, Piles PL, editors. The Prader-Willi Syndrome. Baltimore: University Park Press; 1981. pp. 269–280. [Google Scholar]
- Snyder RG, Schneider LW, Owings CL, Reynolds HM, Gollomb DH, Schork MA. Anthropometry of infants, children and youths to age 18 for product safety design SP-450. Warrendale, Pennsylvania: Society of Automobile Engineers, Inc.; 1977. [Google Scholar]
- Tanner JM, Whitehouse RH. Revised standards for triceps and subscapular skinfolds in British children. Arch Dis Child. 1975;50:142–145. doi: 10.1136/adc.50.2.142. [DOI] [PMC free article] [PubMed] [Google Scholar]
- Ward RE, Meaney FJ. Anthropometry and numerical taxonomy in clinical genetics: An example of applied biological anthropology. Am J Phys Anthropol. 1984;64:147–154. doi: 10.1002/ajpa.1330640208. [DOI] [PubMed] [Google Scholar]
- Weiner JS, Lourie JA. Human Biology: A Guide to Field Methods. International Biological Programme Handbook No 9. Oxford: Blackwell Scientific Publications; 1969. [Google Scholar]
- Zellweger H, Soper RT. The Prader-Willi syndrome. Med Hygiene. 1979;37:3338–3345. [Google Scholar]