Abstract
We employed a method of electrostatic peak switching allowing for the quasi-simultaneous measurement of 16O, 18O, C2H, C2D,12C14N, 13C14N, 12C15N, P, and S with the NanoSIMS 50L instrument to derive ratios for D/H, 13C/12C, 18O/16O, and 15N/14N from biological samples. This approach involves two steps: (i) derivation of the D/H ratio from measurements of C2D and C2H and (ii) switching of the voltage on deflection plates located in front of two detectors. The method is reliable and easy to set up compared with the magnetic peak-switching mode usually used to perform this type of analysis.
Keywords: NanoSIMS50L, multi-isotope mass spectrometry, MIMS, C2D/C2H ratio, D/H ratio, peak switching
Introduction
Multi-isotope imaging mass spectrometry (MIMS) is a quantitative imaging methodology that combines secondary ion mass spectrometry analysis (using the NanoSIMS50 instrument) with the use of stable isotope-tagged tracers to study metabolism.[1–4] The stable isotopes that we commonly use for biological studies are D, 13C, 15N, and 18O. Providing deuterium as heavy water precursor to de novo nucleotide synthesis[5] was recently introduced as a method for tracking cell division with MIMS at the level of a single cell without having to extract genomic material.[6] With this rationale, we have developed a methodology to simultaneously track a variety of biochemical pathways using molecules tagged with different stable isotopes, including deuterium.
The simultaneous acquisition of H, D, 12C, 13C, 16O, 18O, 12C14N, and 12C15N is challenging, both because the instrument is equipped with only seven detectors and because its theoretical mass range is constrained by the radius of the magnetic sector. The usual approach to such an analysis is to switch between different magnetic fields with alternating acquisition planes. This method requires cycling of the magnetic field, which is time consuming and not entirely reliable during what is often a multi-hour acquisition period.
The method proposed here takes advantage of the deflection plate located in front of the detectors to acquire two masses with one detector with a fixed magnetic field.[7] Combining deflection plate switching with the measurement of the secondary ions C2H and C2D to derive the D/H ratio[8] enabled the quasi-simultaneous measurement of D/H, 13C/12C, 18O/16O, 15N/14N, P, and S in histologic sections of mouse small intestine.
Methods/results
Deflection plate switching
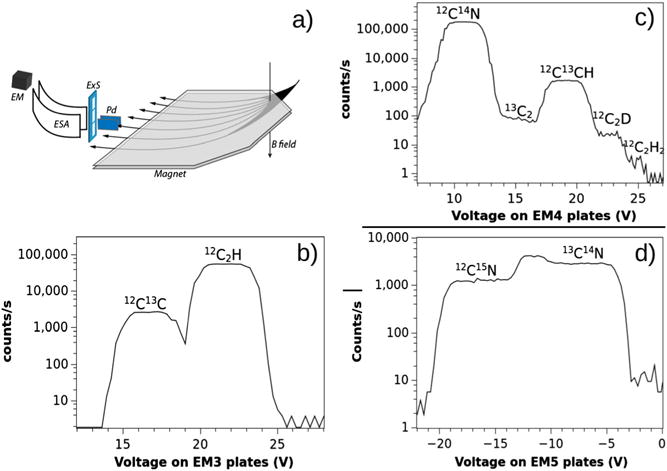
The NanoSIMS50L at NRIMS is equipped with seven electron multipliers (EM) and a large radius (680 mm) magnetic sector. In theory, this allows for the acquisition of secondary ions within a mass range defined as Mmax/Mmin =21, where Mmin is the mass recorded from detector EM1 and Mmax is the mass recorded from detector EM7.[9] In practice, we have measured ions ranging from mass 1 to mass 25 using the deflection plates located in front of detectors 1 and 7. The main purpose of the deflection plates is to direct a specific mass line into the detector. This is achieved by scanning a secondary ion beam, which may be composed of several ion species of isobaric masses, in front of the exit slit (ExS) (Fig. 1(a)). The method proposed here takes advantage of the ability to alternate the voltage on these plates, which provides an easy and reliable means of switching between different isobaric mass lines of interest to derive the ratios for D/H, 15N/14N, and 13C/12C quasi-simultaneously. More specifically, we use the deflection plate to acquire two masses with one detector at a fixed magnetic field. Representative mass spectra for the isobars at masses 25, 26, and 27 (obtained from detectors 3,4, and 5) are shown in Fig. 1. The five expected isobars are clearly seen at mass 26 (Fig. 1(c)). A change of the voltage on the plate from 10 to 23 V allows the recording of the signal for CN and C2D, respectively. In a similar manner, we can record ions 12C15N and 13C14N by applying a change of voltage from −17 to −6 V.
Figure 1.

(a) Schematic of the multi-collection on the NanoSIMS50L. The theoretical accessible mass range is Mmax/Mmin =21 with a 680-mm-radius magnetic sector. Isobaric mass lines are identified by scanning the secondary ion beam of a specific mass in front of the detector’s exit slit (ExS) by mean of electrostatic plates (Pd). (b–d) High-mass-resolution spectra for the isobars at mass 25, 26, and 27 on detectors EM3, EM4, and EM5, respectively, shown as a function of the voltage applied to the plates (Pd). Mass spectra were obtained from the analysis of a 50-μm field of view on a section of mouse small intestine. The spectrum at mass 26 was obtained with a 20-μm entrance slit (ES4), 150-μm aperture slit (AS3), and a 40-μm exit slit (ExS) at the entrance of detector 4 to adequately resolve C2D from the other isobaric masses. The mass resolution as defined by Cameca was 12 000 on EM4. For EM5 (d), the spectra are shown for an exit slit (ExS) of 100 μm (9000 MRP).
The quasi-simultaneous acquisition of these isotopes, along with P and S, using electrostatic peak switching is described in Table 1. The electrostatic peak switching is operated on EM4 and EM5 to derive the ratios for 15N/14N, 13C/12C, and C2D/C2H from three successive scans. The length of each scan can be set independently. The sequence of three scans can be repeated until a sufficient counting statistic is achieved. The acquisition is quasi-simultaneous in that each scan is of short duration and changes in the sample composition with successive analytical planes is likely trivial in most instances. The method is robust because of the reliability and rapidity in applying different voltages to the plates. It has to be stressed that we did not measure any significant difference in the EM4 detector response to CN or C2H as controlled from the pulse height distribution. In addition, the useful electrostatic range, defined as deflector plate voltage range where the counting statistic for a given secondary ion is steady, was determined before each analysis. For EM4, the useful range was [0, +30 V]. For EM5, the useful range was [−30, −10 V], which covers the range required to switch from 12C14N to C2D and from 12C15N to 13C14N.
Table 1.
Quasi-simultaneous recording of nine masses with seven detectors on the NanoSIMS50L from three successive scans
| Scan | EM1 | EM2 | EM3 | EM4 | EM5 | EM6 | EM7 | Ratios measured |
|---|---|---|---|---|---|---|---|---|
| 1 | 16O | 18O | 12C2H | 12C14N | 12C15N | 31P | 32S | 15N/14N and 18O/16O |
| 2 | 16O | 18O | 12C2H | 12C14N | 13C14N | 31P | 32S | 13C/12C and 18O/16O |
| 3 | 16O | 18O | 12C2H | 12C2D | 13C14N | 31P | 32S | D/H and 18O/16O |
Magnetic peak switching function on the Cameca software v 4.1 is used to define the voltage parameters for the plates to apply the method described here.
Application of deflection plate switching to biological sample
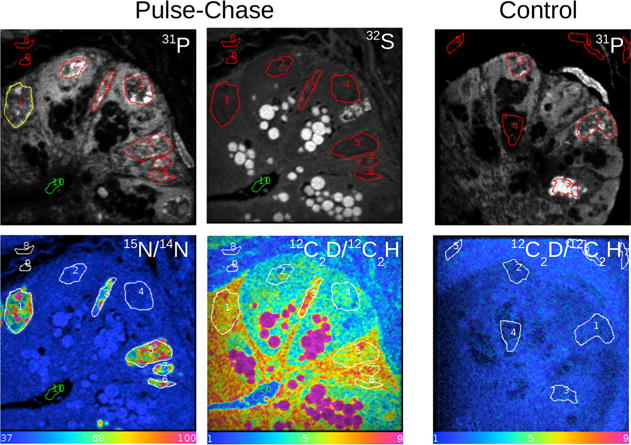
We applied this method to analyze sections of LR-white-embedded small intestine from a mouse model. Labeling was achieved by a pulse-chase strategy with deuterated water and 15N-thymidine. We quasi-simultaneously measured the ratios for 15N/14N and C2D/C2H by applying electrostatic peak switching at mass 26 and 27. The hue saturation image images for 15N/14N and C2D/C2H are shown in Fig. 2. Regions of 15N-thymidine labeling are observable in the nuclei of divided cells in the crypt of the small intestine in a pattern consistent with chromatin. The C2D/C2H image shows dramatically differential labeling, with extremely high levels of labeling in the sulfur-rich granules contained in Paneth cells. In addition, both the cytoplasm and the nuclei of 15N-thymidine-labeled cells was higher than quiescent (15N-negative) cells. Importantly, this dramatic organelle specific D-labeling pattern cannot be attributable to measurement artifact because of a contribution from the tail of the 12C13CH peak to the C2D signal, as measurements taken from an unlabeled intestinal sample (control) did not show a similar differential signal (Table 2).
Figure 2.

Mouse small intestinal crypt for treated and control mice. Treatment: 8-week-old mice were administered deuterated water (d1 = 200 μl, d2–3 = 30 μl) and 15N-thymidine (500 μg by intraperitoneal injection) for 3 days (pulse), followed by a 3-day chase period. Field of view is 30 μm, 256 × 256 pixels. Acquisition time is 131 s/frame for scan 1 (mass 26 on C2D) and 32 s/frame on scan 2 (12C14N); 93 planes. Data are processed using the open-source MIMS software.
Table 2.
Ratios × 10 000 for the unlabeled control mouse for C2D/C2H and 12C15N/12C14N for regions of interest (ROIs) corresponding to various structures in Fig. 2
| Control | ||
|---|---|---|
| ROI | 15N/14N | C2D/C2H |
| LR-White | 38.2 ± 0.12 | 2.07 ± 0.03 |
| Nucleus | 38.1 ± 0.17 | 2.14 ± 0.03 |
| Cytoplasm | 37.9 ± 0.2 | 2.07 ± 0.1 |
| Granules | 38.3 ± 0.15 | 2.14 ± 0.05 |
The values reported are the mean and the standard errors on the means for the ratios derived from three ROIs for each category.
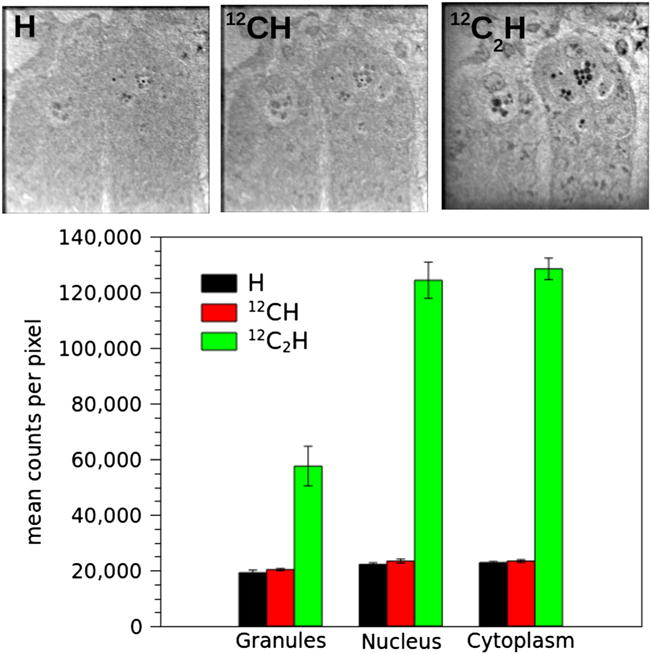
An important question raised by this methodology is how the intensity of the C2H ion signal relates to the signals for CH and H from which the D/H ratio can also be derived. Figure 3 shows ion images of a crypt of the small intestine for H, CH, and C2H, respectively, which were measured simultaneously for purpose of comparison. The C2H image shows much more contrast than the H or CH images. Moreover, the signal intensity for C2H is three to eight times higher than that of H and CH, likely due to the high electron affinity (3.4 eV) of this ion.
Figure 3.

Summed images for H, CH, and C2H acquired simultaneously. The setup for the mass spectrometer was ES3 to correctly resolve the isobars at mass 13 and 25. Image field is 45 μm, 256 × 256 pixels. Acquisition time is 131 s/frame; 160 planes. The histogram shows the counting statistic for H, CH, and C2H for organelles (nucleus, granules, and cytoplasm) from Paneth cells.
A small intestinal section taken from a mouse administered deuterated water was analyzed, and D/H and C2D/C2H ratio measurements were recorded from the same field consecutively. The two methods yielded an identical ratio measurement averaged over the analytical field (D/H = 3.137 ± 1.116 SD vs C2D/C2H = 3.138 ± 1.471 SD, p = n.s.).
Conclusion
Using a strategy of deflection plate switching, we demonstrate the feasibility of quasi-simultaneous measurement of 16O, 18O, C2H, C2D, 12C14N, 13C14N, 12C15N, P, and S. This approach allows to calculate the D/H ratio from measurements of C2D and C2H ions. It enables the near-simultaneous measurements of four isotope ratios from the same sample field. It is of broad applicability in MIMS biological experiments.
Acknowledgments
This work was funded by the NIH (5P41EB001974-13, AG034641, R01 AG040019, R21AG034641-01, R01 AG040209), Human Frontier Science Program (RGP0048), and the Ellison Medical Foundation (AG-SS-2215-08).
References
- 1.Steinhauser ML, Bailey AP, Senyo SE, Guillermier C, Perlstein TS, Gould AP, Lee RT, Lechene CP. Nature. 2012;481(7382):516–519. doi: 10.1038/nature10734. [DOI] [PMC free article] [PubMed] [Google Scholar]
- 2.Senyo SE, Steinhauser ML, Pizzimenti CL, Yang VK, Cai L, Wang M, Wu TD, Guerquin-Kern JL, Lechene CP, Lee RT. Nature. 2013;493(7432):433–436. doi: 10.1038/nature11682. [DOI] [PMC free article] [PubMed] [Google Scholar]
- 3.Zhang D, Piazza V, Perrin BJ, Rzadzinska AK, Poczatek C, Wang M, Prosser HM, Ervasti JM, Corey DP, Lechene CP. Nature. 2012;481(7382):520–524. doi: 10.1038/nature10745. [DOI] [PMC free article] [PubMed] [Google Scholar]
- 4.Lechene CP, Luyten Y, McMahon G, Distel DL. Science. 2007;317:1563. doi: 10.1126/science.1145557. [DOI] [PubMed] [Google Scholar]
- 5.Steinhauser ML, Guillermier C, Wang M, Lechene CP. Surf Interface Anal Proceedings of the nineteenth International Conference on Secondary Ion Mass Spectrometry, SIMS XIX; Jeju, Korea, September 29 – October 4. 2013 [Google Scholar]
- 6.Mohri H, Perelson AS, Tung K, Ribeiro RM, Ramratnam B, Markowitz M, Kost R, Weinberger HL, Cesar D, Hellerstein MK, Ho DD. J Exp Med. 2001;194:1277. doi: 10.1084/jem.194.9.1277. [DOI] [PMC free article] [PubMed] [Google Scholar]
- 7.Mayali X, Weber PK, Brodie EL, Mabery S, Hoeprich PD, Pett-Ridge J. ISME J. 2011;6:1210. doi: 10.1038/ismej.2011.175. [DOI] [PMC free article] [PubMed] [Google Scholar]
- 8.Private communication from G. Slodzian
- 9.Hillion F, Horreard F, Schuhmacher M. Proceedings of the Sixteenth International Conference on Secondary Ion Mass Spectrometry, SIMS XVI; Ishikawa Ongakudo, Kanazawa, Japan, October 29 – November 2. 2007 [Google Scholar]


