Abstract
Understanding of nanoparticle (NP) cytotoxicity is challenging because of incomplete information about physicochemical changes particles undergo once they come into contact with biological fluids. It is therefore essential to characterize changes in NP properties to better understand their biological fate and effects in mammalian cells. In this paper, we present a study on particle surface oxidation and dissolution rate of Cu NPs. Particle dissolution, cell-associated Cu doses, and oxidative stress responses in A549 luciferase reporter cells were examined for Cu NPs modified with mercaptocarboxylic acids with different carbon chain lengths and thiotic acid appended-PEG ligand (TA). We found that these Cu NPs released ionic species together with small particles upon oxidation and that surface chemistry influenced the morphology and dissolution rate. Dissolution rate was also shown to impact both the cellular Cu dosimetry and associated oxidative stress responses. The convergent results from dissolution and dosimetry measurements demonstrate that both intracellular and extracellular (i.e., NP uptake-independent) release of ionic species from Cu NPs greatly affect the cytotoxicity.
TOC Graphic and synopsis
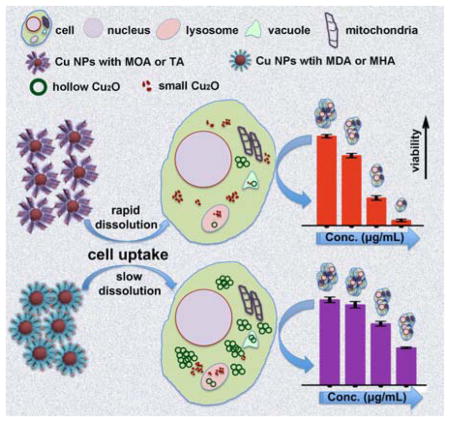
The combined information from dissolution and dosimetry measurements show that both intracellular and extracellular (i.e., NP uptake-independent) release of ionic Cu from Cu NPs contributes to changes in cell health.
Introduction
Nanomaterials have been studied for use in many applications, such as electronics,1,2 medicine,3–6 and cosmetics.7 Some of these nanomaterials are intended for use in humans, while exposures to others may follow incidental or accidental release into the environment or workplace. The possibility of exposure to nanoparticles (NPs) has resulted in increasing research interests in understanding the detrimental effects on human health and the environment.8–10 While in vitro studies have often been performed in assessing toxicity, the properties of NPs used are often not well defined, which results in inconsistent conclusions. Furthermore, understanding the behaviour of NPs in complex biological fluids is often challenging due to physicochemical changes, such as formation of protein corona,11 dissolution, oxidation of surfaces, agglomeration and aggregation. The full impact of these changes has not been evaluated properly for an in-depth understanding of the origins of toxicological responses. For example, surface chemistry changes dynamically for those NPs that are active in air or under physiological media, such as copper. Herein, we present a study of the effects of surface chemistry of Cu NPs with well-characterized size and morphology on their dissolution, agglomeration, cellular disposition and corresponding cytotoxicity using A549 luciferase reporter cells (A549luc).
Both in vitro and in vivo studies have shown that Cu NPs can produce reactive oxygen species (ROS) inside and outside cells.12–15 As compared to some other metals and metal oxides, Cu can undergo rapid oxidation in biological media,16–19 leading to the dissolution of NPs. It is unclear, however, as to whether cellular oxidative stress derives from particles themselves or ionic species that are released due to dissolution and whether the uptake of NPs by cells is required. For example, soluble Cu species or ions that were released from the original NPs were claimed not to contribute significantly to cellular toxicity.20–22 Significant increases in intracellular ROS generation was not observed following exposure to Cu2+ species.23 Other groups argued, however, while particulate CuO contributed to early NP-induced adverse effects, Cu ionic species became important after 24 h of exposure.24 In this case, ionic species derived from the Cu NPs were thought to lead to the observed toxicity.25 These studies, however, did not take into account the kinetics of ionic species release or the effect of the cellular compartment in which dissolution occurred. A lack of understanding of NP dose to the cells and dissolution rates contribute to the uncertainty associated with such studies.
Herewith, we present a study of particle dissolution kinetics and partitioning of dose over time using Cu NPs with controlled surface chemistry. 8-Mercaptooctanoic acid (MOA), 12-mercaptododecanoic acid (MDA), and 16-mercaptohexadecanoic acid (MHA) were used to modify the surface chemistry of 15-nm Cu NPs.17 Thiotic acid appended-polyethylene glycol (PEG) was also used as a new ligand to further control the hydrophilicity of these Cu NPs.26 Besides surface hydrophobicity, these ligands also affect the surface oxidation17 and the associated dissolution rates of Cu NPs.
The A549luc cell line was selected as the cellular model for this study. It is a human type II alveolar epithelial carcinoma cell line transfected with a luciferase reporter linked to the interleukin (IL)-8 gene promoter. When cells respond to inflammatory or oxidative stress stimuli, luciferase activity increases.27 Relatively high concentrations of NP suspensions were chosen for this proof-of-principle study to facilitate examination of cytotoxicity with the increasing NP concentrations and to ensure the delivery of detectable levels of Cu around and inside the cells.
Experimental
Procedures for surface modification
The Cu NPs were prepared under argon using a previously published method.17 Ligand exchange was performed by adding 7 mL of ethanolic solutions of MOA, MDA, and MHA, respectively, into the Cu-NP suspension in a 16-mL glass vial in an argon-filled glove box.17 For thiotic acid appended-PEG (TA-PEG750-OCH3, TA for short),28 a modified procedure was used for the ligand exchange.29 Typically, 1.5 mL of ethanol was added to 5 to 7 mg of Cu NPs in a 16-mL vial, followed by the addition of 50 μL of TA. The vial was sealed and stirred in 65 °C water bath for 4 h. The Cu NPs were then washed by adding hexane (Vethanol:Vhexane =1:7), and centrifuged at 7000 rpm for 5 min. The washing process was repeated three times. Finally, the Cu NPs were dispersed in 3-mL of ethanol.
Procedures for cell culture
The A549luc cells harbour a reporter that is under the control of the human IL-8 gene and contains binding sites for Nuclear Factor kappa-light-chain-enhancer of activated B cells (NF-κB) and activator protein 1 (AP-1). It was used as an indicator of the activation of oxidative stress and inflammatory response pathways in cells.27 The culture medium was composed of L-glutamine-supplemented RPMI 1640 (Gibco), which contained 10% heat-inactivated fetal bovine serum (FBS; HyClone), 0.4 μL/mL gentamicin, and 1% geneticin. The A549luc cells were grown under 5% of CO2 at 37 °C. The Gibco and HyClone cell culture reagents were obtained from Thermo Fisher Scientific (Waltham, MA) or GE Healthcare Life Sciences (Pittsburgh, PA), respectively.
Dispersion of NPs in culture medium
Surface-modified Cu NPs were dispersed in ethanol. The concentrations of Cu NPs were determined by atomic absorption (AA) spectroscopy (Perkin Elmer AAnalyst 600). In a standard procedure, Cu NPs were pelleted by centrifugation, collected and dried under argon. Culture medium was added to the Cu NPs, followed by mixing using a water bath sonicator for 2.5 min before their exposure to the cells.
Oxidation study of Cu NPs in phosphate buffered saline
In a standard procedure, 500 μL/mL of surface ligand modified Cu NPs (i.e., Cu-TA, Cu-MOA, Cu-MDA or Cu-MHA) was dispersed in 3-mL phosphate-buffered saline (PBS) using a similar procedure as described above. The Cu NPs were then exposed to ambient air at room temperature for up to 48 h to study the surface oxidation. Photographs were taken at 20 h and 48 h, respectively.
Dissolution study of NPs
A static system was used to model the dissolution of Cu NPs in the in vitro exposures. To be specific, the particles were suspended in culture medium and 1 mL of each sample was placed inside dialysis bags with a nominal pore size of 2–3 nm (regenerated cellulose 3500 MW cut-off; Spectrum Laboratories, Inc., Rancho Dominquez, CA). The bag was sealed tightly with clamps and placed in 25 mL of culture medium in conical tubes, which were placed inside an incubator (5% CO2, 37 °C). The content released into the culture medium was collected after 1, 4, 8, and 24 h and analysed by AA spectroscopy. These experiments were repeated at least three times. The results are expressed as cumulative fractional dissolution.
Characterizations of NPs
Transmission electron microscopy (TEM) and high resolution TEM (HR-TEM) were used to characterize the morphology of Cu NPs. The micrographs were taken on an FEI TECNAI F-20 field emission TEM microscope at an accelerating voltage of 200 keV. Attenuated total reflectance infrared (ATR-IR) spectroscopy data were collected on a Shimadzu FTIR-8400S spectrophotometer with a MIRacle ATR accessory. The amount of Cu in the surface-modified NPs was determined by AA spectroscopy. In a typical procedure, the solid samples were dried, dissolved in concentrated nitric acid, and then diluted in 2% nitric acid to quantify the Cu content. Hydrodynamic diameters of Cu NPs in water, PBS or cell culture medium were measured using a nano-Zetasizer (Malvern Instruments, Inc.).
Cellular dosimetry study
A549luc cells were seeded into 12 well plates with 350,000 cells/well and grown to 80% confluence. Cu NPs were dispersed as described above and added to the wells (1 mL of NP suspension/well). The plates were then incubated under 5% CO2 at 37 °C. After 4 h or 24 h, the NP supernatant in each well was carefully collected. The cells were washed twice with 500 μL of Hank’s balanced salt solution (HBSS) to remove the particles that did not attach to the cells. After this washing step, the HBSS was collected from the same wells to determine NP content. To lyse the cells, 500 μL of 0.1% trypsin were added to each well and the plates were incubated for 15 min. The pellet fractions were collected in separate tubes. The wells were vigorously washed with HBSS and the washes were combined with the cell lysates. The Cu content in both supernatant and pellet fractions were analysed using AA spectroscopy. Data are expressed as cell-associated fractions out of total Cu content (sum of portions in both pellet and supernatant).
3-(4, 5-Dimethylthiazol-2-yl)-5-(3-carboxymethoxyphenyl)-2-(4-sulfophenyl)-2H-tetrazolium (MTS) assay
A549luc cells were seeded into 96 well plates with 20,000 cells/well and grown for 24 h to 80% confluence. Cu NPs were dispersed in cell culture medium, sonicated for 2.5 min in a water bath, and then further diluted in culture medium to a predetermined concentration of 1, 5, 10, 25, 50, and 100 μg/mL, respectively, before adding to the wells at the amount of 100 mL of NP suspension/well. The Cu NP suspensions were vortexed for 5 s before being added to the cells. After incubation for 4 h or 24 h, cell viability was measured using the MTS assay (Promega Corp.; Madison, WI). In brief, the NP-containing medium was aspirated, after which 120 μL of MTS reagent was added to each well. The plate was incubated for 50 min under 5% CO2 at 37 °C, followed by centrifugation (2000 xg, 10 min). 100 μL of the supernatant was transferred to another 96-well plate. The absorbance in each well at 490 nm was recorded using a Spectramax M5 plate reader. These experiments were repeated at least three times. The centrifugation was incorporated, as suggested previously,30 to mitigate possible artefact due to the interaction between NPs and the formazan end product.31
Study of luciferase reporter activity
A549luc cells were seeded into 96-well plates at 20,000 cells/well and grown to 80% confluency for 24 h under 5% of CO2 gas at 37 °C. Cu NPs were dispersed in culture medium at the same concentrations as described above and added to the cell layers. TNFa solution at 5 ng/mL was used as a positive control to ensure that the assay was properly carried out (data not shown). After incubation for 4 h or 24 h, the luciferase activity was measured according to standard instructions (Promega). In brief, the cells were washed twice with PBS, followed by adding 20 μL of lysis buffer per well. The plates were further incubated at room temperature on a rocking platform for 15 min. Luciferase substrate solution was added to each well and the resulting luminescence was read immediately using a Spectramax M5 plate reader. These experiments were repeated at least three times.
Uptake study of copper NPs
TEM was used to further characterize the uptake and distribution of Cu NPs in A549luc cells. The cells were seeded in 4 well chamber slides at 180,000 cells/well and grown for 24 h to 80% confluency. Cu-MOA and Cu-MHA were dispersed in culture medium using procedures described above and diluted to 10 or 25 μg/mL (0.6 mL of NP suspension/well). The cells were incubated with the NPs for 0.5, 4, or 24 h under 5% CO2 at 37 °C, after which the wells were washed twice with culture medium and then fixed overnight in 2.5% glutaraldehyde in 0.1M sodium cacodylate buffer at 4 °C. The cells were rinsed in buffer and post-fixed in 1.0% buffered osmium tetroxide for 30 min. The slides were transitioned through a graded series of ethanol to 100% and infiltrated with Spurr’s epoxy resin overnight. The capsules of resin entrapped cells were removed from the glass slides using the “pop off” technique32 and then cut into 70 nm sections using an ultramicrotome with a diamond knife. These thin sections were placed onto 200 mesh carbon-coated nickel grids and stained with aqueous uranyl acetate and lead citrate. The cells on grids were examined using TEM (Hitachi 7650). Digital micrographs were captured electronically using a Gatan Erlangshen 11-megapixel digital camera.
Statistical analyses
All experiments were repeated at least three times, each with triplicate wells, unless otherwise noted. Data from the MTS and luciferase assays were evaluated for the effects of exposure time and suspension concentration, and for the interactions between these variables via two-factor analyses of variance (ANOVA) within each particle type. Data transformations were applied as needed, following an analysis of residuals to meet the requirements of ANOVA.
Results and discussion
Surface modification and characterization of Cu NPs
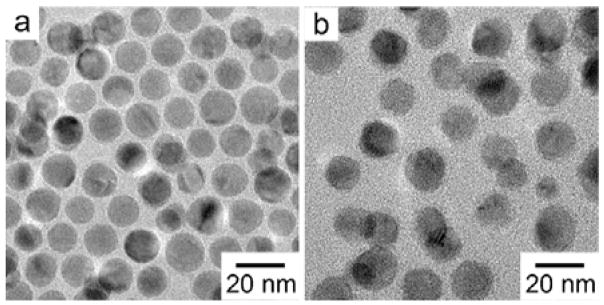
The Cu NPs were modified by the appropriate mercapto-carboxylic acids following the procedures reported previously.17 TA-PEG750-OCH3 (TA)-modified Cu (TA-Cu) NPs were prepared using a similar protocol. Fig. 1(a) shows a representative TEM micrograph of as-synthesized Cu NPs, which were uniform in size and had an average diameter of 15 nm. Fig. 1(b) shows the TEM micrograph of TA-Cu NPs, which did not aggregate in close-packed structures after ligand exchange. The change in packing structure suggests that the ligand exchange occurred, resulting in the dramatic change in surface chemistry. After this surface treatment, the overall size and size distribution largely remained the same.
Fig. 1.
TEM micrographs of Cu NPs: (a) as-synthesized, and (b) after ligand exchange with TA-PEG750-OCH3.
Fig. S1 shows the ATR-IR spectra of pure TA-PEG750-OCH3 and Cu NPs after ligand exchange with TA-PEG750-OCH3 (Cu-TA). The two characteristic peaks at 1549 cm−1 and 1661 cm−1 represent the C=O stretch and N-H bending modes from the amide bond connecting the thiotic acid to MPEG group. The IR pattern of ligand-coated Cu NPs was similar to those for TA-PEG750-OCH3 in the fingerprint range,28 confirming the existence of TA ligand on the particle surface. The Cu-TA suspension in oxygen-free ethanol was stable for weeks without precipitation when stored in an argon-filled glove box, indicating that the TA ligand could provide Cu NPs with highly hydrophilic surfaces and colloidal stability.
Four types of Cu NPs, namely, Cu-MOA, Cu-MDA, Cu-MHA and Cu-TA were used in this study. Table 1 summarizes the results of size and size distribution measurements of these NPs, obtained by TEM and nano-sizer (hydrodynamic diameter: HD). All four Cu NPs had similar primary size based on the TEM study. In suspensions, Cu-TA had a much smaller hydrodynamic size in both water and PBS than the rest, while Cu NPs with other capping ligands had much larger diameter than their corresponding dry forms, indicating different degrees of agglomeration. The hydrophilicity appeared to increase in the following order: Cu-MHA < Cu-MDA < Cu-MOA ≪< Cu-TA NPs. Other properties of Cu-MOA, Cu-MDA, and Cu-MHA NP were reported elsewhere.17 These NPs were also shown to have a metallic Cu core that readily forms Cu2O shell under ambient conditions in air.
Table 1.
Primary and hydrodynamic sizes of copper NPs.
| Size (nm) | Cu-MOA | Cu-MDA | Cu-MHA | Cu-TA |
|---|---|---|---|---|
| TEM size | 14.5±1.2 | 14.4±1.1 | 14.8±0.9 | 14.5±1.5 |
| HD in water* | 243±56 | 198±50 | 278±31 | 33±2 |
| HD in PBS* | 302±78 | 352±84 | 403±22 | 63±2 |
The concentration of these Cu NP suspensions was 10 μg/mL.
Dissolution and DLS study
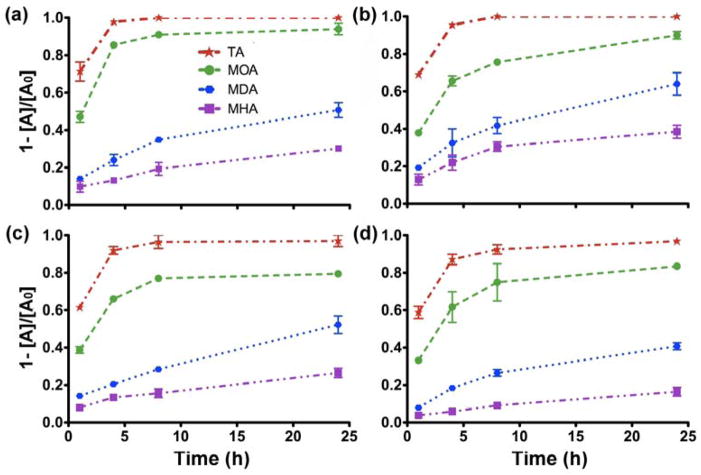
Particle oxidation and dissolution often take place in biological systems for reactive species, such as Cu metal or metal oxides. Dissolution was studied in cell culture medium to better understand the dynamic nature of Cu NPs that were delivered to cells. Unlike the non-equilibrium dissolution for in vivo study,33, 34 the system used here is static, which resembles well the conditions of an in vitro model. Tangential flow filtration was utilized recently to separate solvated ions from NPs, which offers improvements due to the agglomeration of reduced particles.35 However, this method depicts the dynamic system that may not be suited for the behaviour under static conditions of an in vitro system. Fig. 2 shows the dissolution kinetics for the Cu NPs over a range of concentrations. At a concentration between 1 and 5 μg/mL, there is no distinguishable difference in dissolution between the NP suspensions and the cell culture medium itself (15 ng/mL). Thus, only the four highest concentrations were included in the rate calculations. In general, dissolution decreased slightly when the concentration increased, possibly due to the agglomeration of nanoparticles over time during dialysis. Among the four types of Cu NPs, Cu-TA dissolved the fastest, reaching the maximum dissolution between 4 h and 8 h. This was followed by the samples of Cu-MOA, Cu-MDA and Cu-MHA NPs, respectively. This dissolution took place in culture medium around neutral pH, thus, could provide insight about events occurring both outside and inside the cells, but not within lysosomes. It appears that the rates are higher at lower pH values, as has been demonstrated previously.36, 37
Fig. 2.
Dissolution profiles of the four types of Cu NPs at the concentration of (a) 10, (b) 25, (c) 50 and (d) 100 μg/mL, respectively. The cumulative dissolved fraction was calculated by using the equation (1-[A]/[A0]).
To study the dissolution kinetics, we considered the reaction as n-th order and used the following general equation to analyse the kinetics, considering that oxygen was in excess:38
This equation can be rearranged and plotted linearly using the ln-ln scale:38
| (1) |
where [A] is the concentration of Cu, t is the time, and k is the rate constant. The data at each concentration for all four Cu NP samples were analysed using Equation 1. The resulting slope is the reaction order, n, and the intercept value is ln(k).
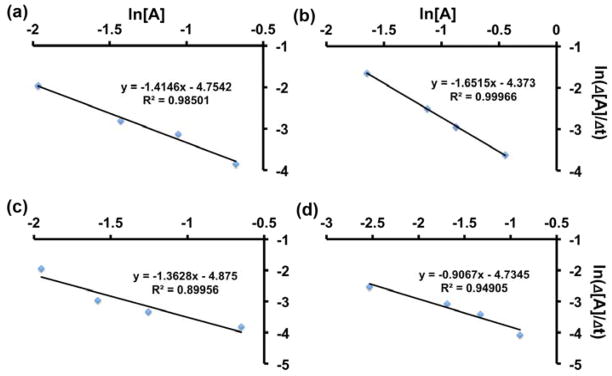
Fig. 3 and Fig. S2 show the kinetic fitting at the four initial concentrations for Cu-MDA and Cu-MHA NPs, respectively, in which satisfactory R2 values (≥0.9) were obtained. On the other hand, R2 values for Cu-TA and Cu-MOA NPs were in the range between 0.6 and 0.8 in the kinetic analyses using the same general equation. The results appear to be in agreement with the rapid dissolution of these two Cu NPs, especially in the case of Cu-TA (Fig. 2), suggesting that there exist complex reaction kinetics for Cu-MOA and Cu-TA that cannot be modeled via curve-fitting. Table 2 and Table S1 summarize the values of reaction order, n, and ln(k) obtained for all Cu samples. The reaction order for Cu-MDA and Cu-MHA NP systems was close to first order (between 1st and 2nd orders), while no simple rate order could be derived for Cu-MOA and Cu-TA NP systems. The value of rate constant increased in the order of Cu-MHA<Cu-MDA<Cu-MOA<Cu-TA, although the quantitative interpretation of the values requires additional experiments and reaction kinetic analysis, especially in the case of Cu-MOA and Cu-TA NPs.
Fig. 3.
Analysis of dissolution kinetics for Cu-MDA at the concentrations of (a) 10, (b) 25, (c) 50 and (d) 100 μg/mL, respectively.
Table 2.
Values of ln(k) of copper in its dissolution at different concentrations.
| Amount(mg-Cu/mL) | 10 | 25 | 50 | 100 | Mean±SD |
|---|---|---|---|---|---|
| Cu-MOA* | (−2.63) | (−3.19) | (−3.38) | (−3.24) | (−3.11±0.33) |
| Cu-MDA | −4.75 | −4.37 | −4.86 | −4.73 | −4.68±0.22 |
| Cu-MHA | −6.48 | −5.64 | −6.84 | −7.13 | −6.52±0.65 |
| Cu-TA* | (−2.28) | (−2.34) | (−2.51) | (−2.70) | (−2.46±0.19) |
R2 values for these two samples are < 0.9, thus the reactions were complex and could not be analyzed as simple dissolutions, so the values are shown in parentheses.
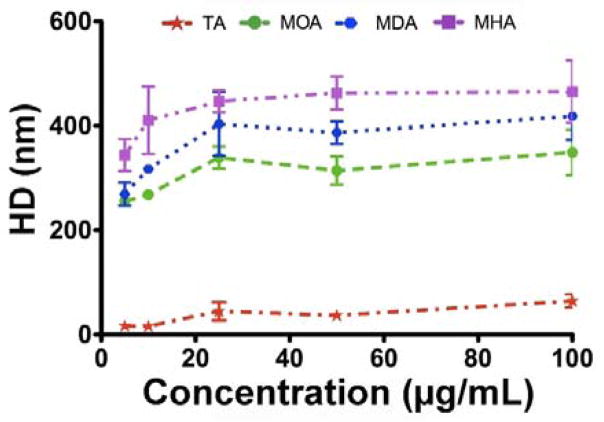
DLS measurements were carried out to determine the hydrodynamic diameter (HD) of the Cu NPs in the cell culture medium. The results show that the HD depended on both the particle type and concentration (Fig. 4). At the concentration of 1 μg/mL, no obvious difference was observable between NPs and the cell culture medium. However, at concentrations of 5, 10, 25, 50, and 100 μg/mL, the difference in hydrodynamic diameters became pronounced. The Cu-TA had a much smaller hydrodynamic size in cell culture medium, i.e., had a smaller agglomerate size, than the Cu-MOA, Cu-MDA, and Cu-MHA NPs. This observation further indicates that the hydrophilic TA ligand could effectively reduce the degree of agglomeration in cell culture medium.
Fig. 4.
Analysis of hydrodynamic diameter (HD) of various Cu NPs at different concentrations in cell culture medium.
All Cu NPs showed a similar trend in that the agglomerate size increased slightly with the increase in concentration. These DLS results could explain the slight change in dissolution rate at different concentrations (Fig. 2). We could not rule out the effect of NP dissolution on the observed reduced size, because both Cu-TA and Cu-MOA NPs dissolved in such medium. Nevertheless, since the measurements were completed within 1 min after sample preparation, any contribution due to dissolution should be limited. As a result of the NP agglomeration, the sedimentation rate of the NPs through the column of culture medium could increase and, thus, the kinetics of dose delivery.
Cellular dosimetry
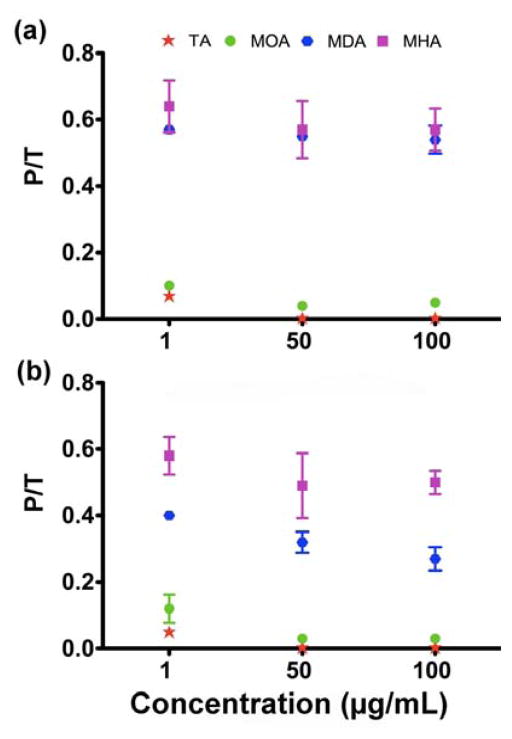
In order to better understand the cellular dose of Cu, we examined the partition of Cu NPs in the A549luc cell phase and in the supernatant phase at NP concentrations of 1, 50 and 100 μg/mL after 4 and 24 h exposure to cells (Fig. 5). The amounts of Cu species measured in the pellet and supernatant fractions for all four NP types is presented in Fig. S3. In general, more than 90% of the Cu species from Cu-TA and Cu-MOA was found in the supernatant for all three concentrations and for both durations of exposure. No more than 10% of the total Cu species was associated with the A549luc cells (Fig. 5 and Fig. S3). For the Cu-MDA and Cu-MHA NPs, greater fractions of the Cu species appeared in the cell-associated phase. The amount of Cu species in cell-associated phase was similar for MDA and MHA after 4 h of exposure. After exposure for 24 h, however, the amount of Cu species from Cu-MHA remained high in the cell-associated phase, while the amount for Cu-MDA became lower than that at 4 h. This difference likely stems from the higher dissolution rate of Cu-MDA as compared to Cu-MHA (Fig. 2). In general, the amounts of cell-associated Cu NPs follow the order: Cu-TA < Cu-MOA < Cu-MDA < Cu-MHA.
Fig. 5.
Fraction of Cu species associated with A549luc cells at (a) 4 h and (b) 24 h. P represents the amount of Cu (in ng) in cell pellet and T is the total Cu added (in ng).
MTS and luciferase reporter studies
The different dissolution behaviours of the Cu NPs in culture media and cells should result in varied cytotoxicity. The MTS assay, which measures the activity of a mitochondrial reductase, was used in this study to examine cell viability upon exposure. While it is not an absolute measure of cell death, the MTS assay is often used as a general indicator of cell health.
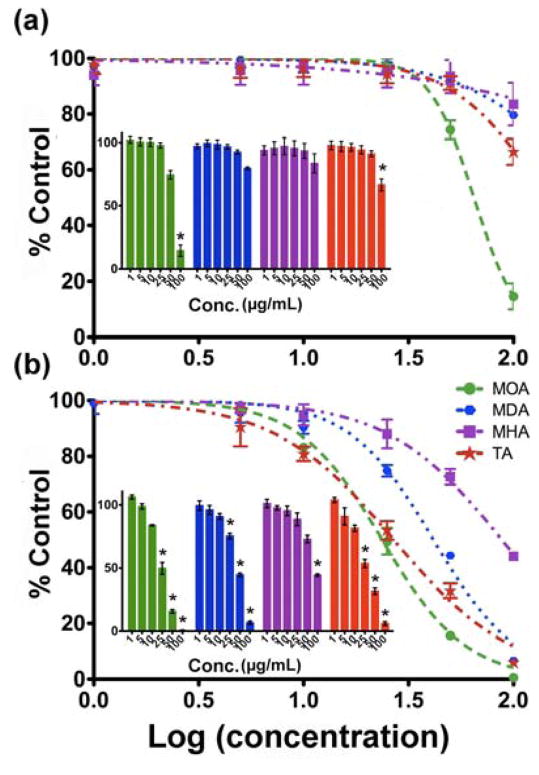
Fig. 6 shows the MTS responses of A549luc cells following exposures to Cu NPs for 4 h and 24 h. A two-factor statistical analysis was used to evaluate the results, which showed that the effect of NP suspension concentration on cytotoxicity is dependent on exposure time. Specifically, no obvious cytotoxicity was observed at the earlier time point (4 h) for concentrations up to 50 μg/mL for Cu-MDA, Cu-MHA and Cu-TA, while the sample with Cu-MOA showed a 30% reduction in MTS activity. When the concentration of NPs increased to 100 μg/mL, both Cu-MOA and Cu-TA NPs showed statistically significant reductions in mitochondrial reductase activity, indicating a change in overall cell health. By 24 h of exposure, all four types of Cu NPs showed significant concentration-dependent cytotoxicity.
Fig. 6.
MTS analysis (% of control vs. log concentration) at the exposure time of (a) 4 and (b) 24 h. Insets are corresponding bar charts for normalized MTS results (*: p<0.05 versus untreated controls).
To obtain effective concentration 50 values (EC50, at which concentration 50% of the cell population dies), the normalized MTS data and log (concentration) were fitted to the following equation 39:
| (2) |
where V is the viability, D is the log [concentration], and h is the Hill slope. Fig. 6 shows the curves that were fitted with the above model for the MTS assay; the obtained EC50 values for all four Cu NP types are presented in Table 3. The Cu-MOA NPs had a much lower EC50 value than the others after 4-h exposure, indicating higher cytotoxicity. The EC50 values for Cu-MDA and Cu-MHA at this exposure time had higher standard deviations than the other o NPs. The large standard deviations suggest that the overall cytotoxicity was low at this time point, thus broad variation in measured values. The data obtained after 4 h of exposure to Cu-MHA could not be fit by Equation (2) (R2 =0.1285), due to the weak response at this time point. At the exposure time of 24-h, the EC50 values were similar for Cu-MOA and Cu-TA NPs and were lower than at 4 hrs. Among the four samples, the Cu-MHA NPs had the highest EC50 value at the later time point. The results on distribution of Cu species in A549luc cells (Fig. 5) and the findings from the MTS assay show that the two particle types with the lowest cell-associated doses and highest dissolution rates were more rapidly cytotoxic than the others.
Table 3.
EC50 values of Cu NPs at different exposure times*
| EC50 | Cu-MOA | Cu-MDA | Cu-MHA | Cu-TA |
|---|---|---|---|---|
| Time | ||||
| 4 | 64.9 ± 6 | 279.4 ± 139 | 1084 ± 200 | 169.4 ± 40 |
| 24 | 23.8 ± 3 | 41.6 ± 2 | 88.9 ± 2 | 26.9 ± 5 |
EC50 values are mean ± SD in mg/mL, calculated from three independent measurements. The unit for time is h.
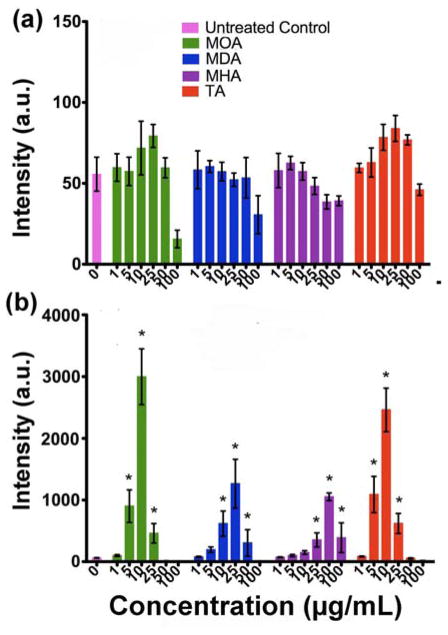
The luciferase reporter assay was used to study intracellular oxidative stress that was induced by the Cu NPs (Fig. 7). No increase in response was observed after 4 h of exposure of A549luc cells to the four types of Cu NPs, which indicates that oxidative stress (IL-8 gene induction) was not extant even when the particles were taken up by the cells (Fig. 5a). The drop in reporter activity for Cu-MOA at 100 μg/mL is likely due to the cytotoxicity that was found at this time point (Fig. 6a). At 24 h, the response profiles became similar in that, at low concentrations, the Cu NPs increased luciferase activity, whereas at higher NP concentrations, activity decreased. Cu-MOA and Cu-TA showed the highest 24-h increases in luciferase response at the dose level of 10 μg/mL, while Cu-MDA and Cu-MHA showed maxima at 25 and 50 μg/mL, respectively. The concentrations at which there was a loss in luciferase activity were close to the EC50 values that were found in the MTS assay. Even though changes in overall A549luc cell health were not observed via the MTS assay at concentrations lower than 25 mg/mL for any particle type, luciferase reporter activity was significantly elevated at these concentrations. These results suggest that cells underwent oxidative stress, but this did not result in a pronounced decrease in cell health at these concentrations.
Fig. 7.
Luciferase response of A549luc cells after incubating with Cu NP suspensions at different concentrations for exposure at (a) 4 h and (b) 24 h. Note difference in scaling of intensity in (a) and (b). (*, p<0.05 versus untreated controls).
All four Cu NP types generated oxidative stress within 24 h of exposure, with the greatest responses being induced by Cu-MOA and Cu-TA. The maximum slopes (Smax) of the concentration-response curves were calculated to compare intracellular oxidative stress induced by these four types of NP. In this analysis, the steeper the slope, the higher the potency.39 At relatively high concentrations, the systems showed cytotoxicity, judging by the loss of luciferase activity. Thus, the response values in this concentration range were not included in the analyses since they did not contribute to the understanding of onset of response. The luciferase response curves were fitted to the following equation 39:
| (3) |
where I is the response in terms of intensity, which increases with concentration; Ib is the bottom value of intensity (vehicle-treated control); and It is the top value of intensity. Thus, the expression of maximum slope (Smax) was obtained based on the following equation 39:
| (4) |
In cases where few data points were attainable before the maximum intensity, errors tend to be large in the calculated Smax, as shown in Table S2. The highest point for the luciferase response could however be obtained from the complete curves, in which case a value equal to the highest point plus two standard deviations was used as the limit of It (Fig. S4). The obtained It limit values were 4600 for Cu- MOA, 2700 for Cu-MDA, 1300 for Cu-MHA and 3700 for Cu-TA. Table 4 summarizes the Smax obtained for the four Cu NP types using a defined limit for It. The use of a defined limit reduced the errors in calculation. These results show that Cu-MOA has the steepest concentration-response curve, that is, the highest Smax value, while Cu-MHA has the shallowest.
Table 4.
Result of luciferase reporter activity in response to Cu NPs at 24 h with It defined.
| Sample | Cu-MOA | Cu-MDA | Cu-MHA | Cu-TA |
|---|---|---|---|---|
| Smax* (mg/mL) | 467±117 | 90±17 | 36±3 | 389±125 |
mean values ± SD calculated from three independent experiments
TEM characterization of NP-uptake
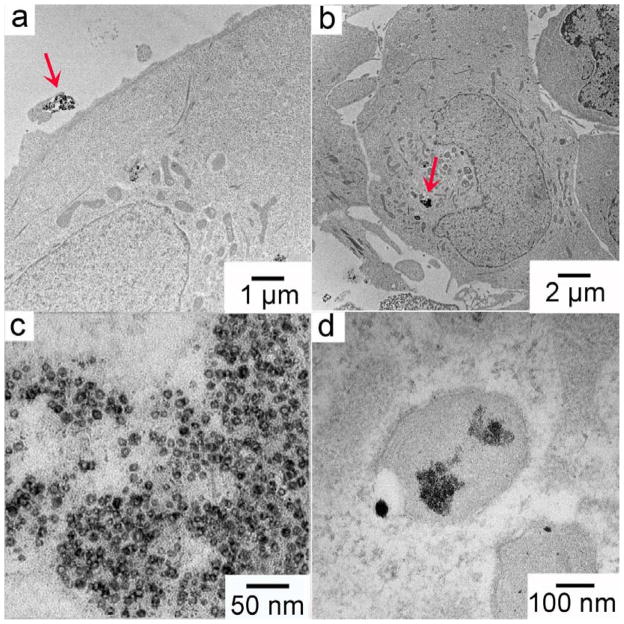
Morphologies of Cu NPs after uptake by A549luc cells were studied by TEM (Fig. 8). To facilitate the TEM characterization, we chose Cu-MHA NPs at a concentration of 25 mg/mL for this study. Cu-MHA is the least soluble particle among the four and the selected concentration was similar to that where the onset of oxidative stress occurred, but below that of the 24-h MTS EC50. After 30 min of exposure, most of the Cu-MHA NPs were outside the A549luc cells (data not shown). After incubation for 4 h, however, Cu-MHA NPs were readily observed inside the cells, consistent with the findings shown in Fig. 5. Fig. 8a displaying a cluster of NPs that were about to be taken up by a cell. NPs were found in both cytoplasm and putative vacuoles and lysosomes (Figs. 8a, b). A TEM micrograph at higher magnification shows that the Cu-MHA NPs in the cytoplasm were oxidized and partially dissolved intracellularly (Fig. 8c). The formation of hollow structures from metal NPs occurred due to the uneven counter diffusion rates between metal and oxygen atoms during oxidation,40 where Cu diffuses faster from the core to outside layer of the particle than oxygen diffuses into the Cu metal core. NPs were also observed inside a putative lysosome. These NPs became much smaller in size and formed aggregates, suggesting that extensive digestion occurred (Fig. 8d). This observation agreed with a previous report that NP oxidation and dissolution rates increase inside lysosomes, where the pH is low.41 According to the MTS assay results (Fig. 6), the A549luc cells were healthy at 4 h and also did not undergo appreciable oxidative stress at any concentration of Cu-MHA NPs. These observations suggest that uptake and initial intracellular dissolution of poorly soluble Cu NPs precedes the initiation of the cellular oxidative stress response and subsequent cytotoxicity and that these processes are linked to intracellular release of Cu ionic species.
Fig. 8.
TEM micrographs of Cu-MHA NPs (25 μg/mL) incubated with A549luc cells for 4 h: (a) and (b) cellular uptake observed at low magnifications; oxidized Cu NPs inside (c) cytoplasm and (d) lysosomes.
Cu-MDA NPs were expected to behave in a similar fashion to the Cu-MHA NPs uptake, followed by the intracellular dissolution because of their similarity in physical and chemical behaviors in cell environments. The more rapidly-dissolvable Cu-MOA NPs, however, were not found outside or inside the A549luc cells as intact NPs. Only small clusters, similar to the fragments in Fig. 8d, were observed (shown in Fig. S5). Thus, it is likely that the cellular responses to this particle type were initiated by extracellular ionic species due to the oxidation of Cu (Fig. 2 and Fig. 3).
Morphological changes in NPs during controlled oxidation
In order to better understand the oxidation process of Cu NPs, we performed controlled studies of these four Cu NP types in PBS over 48 h at room temperature and observed their morphologies (Fig. S6). After 20 h oxidation in buffer, Cu-TA NPs became a green solution, and the other three NPs precipitated out of solution. TEM micrographs showed that Cu-MOA, Cu-MDA and Cu-MHA did not change appreciably comparing to the original morphology. However, Cu-TA NPs became hollow structures and turned into even smaller particles, which resembles the morphology change of NPs due to the Kirkendall effect.40 Similar changes were observed for Cu-MHA NPs in the cytoplasmic environment inside the cells (Fig. 8a). After 48 h, all dispersions of Cu NPs had colourless supernatants and precipitates of different colours. Cu-MOA became particles with sizes in the range of 5 nm with some in the range of 1–2 nm. Most of Cu-MDA and Cu-MHA samples remained at their original size, though smaller particles were also observed. The Cu-TA NPs became mostly small particles. Fig. 9 shows that these hollow structures and the size-reduced NPs, both of which have a lattice spacing of 0.24 nm, which can be assigned as the (111) plane of Cu2O. These results show that both hollow and small Cu2O NPs form during the oxidation process. When further exposed to oxygen or air, the hollow structures may all become small Cu2O NPs and eventually dissolve completely to become Cu ions. Organic capping ligands, which help to retard the surface oxidation, could not completely protect the metallic Cu from reacting with oxygen, especially for those with short chains which could not form densely packed structures on the surface.42 Cu2O is stable at room temperature because further oxidation to CuO or other Cu2+ species is extremely slow.43 Thus, Cu ions could form only after the NPs were exposed to an acidic environment, such as within a lysosome.
Fig. 9.
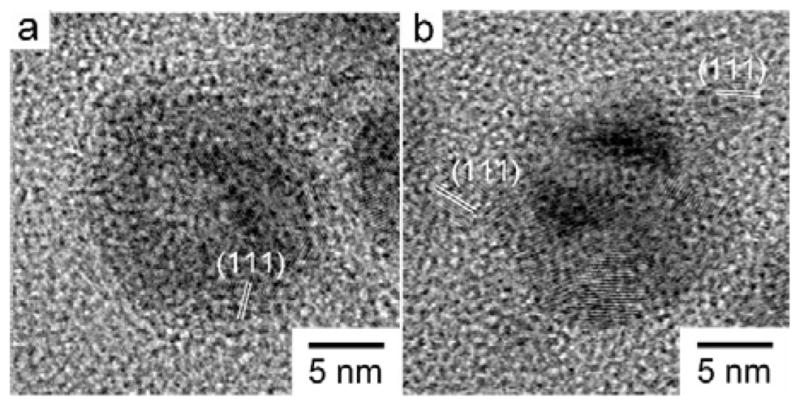
HR-TEM micrographs of (a) hollow and (b) size-reduced Cu-TA NPs after oxidation for 20 h in PBS at room temperature
Our combined data show that Cu-MOA and Cu-TA NPs, which were oxidized into smaller NPs outside the cells, did not effectively deliver an intracellular dose of Cu. They nevertheless induced adverse changes in A549luc cell health and oxidative stress (Fig. 6 and Fig. 7). Cu-MDA and Cu-MHA NPs, however, were oxidized more slowly (Fig. 2 and 3), and to be taken up as solid particles and gradually dissolved intracellularly (Fig. 8), which preceded noticeable oxidative stress-related cytotoxicity. It was found previously that for NPs with limited solubility, rat lung inflammation depended on the ions that were produced during dissolution of NP inside the phagolysosomes following in vivo exposure.44 More specific to Cu NPs, Studer et al. proposed a “Trojan horse mechanism” whereby NPs were taken up by cells and then dissolved into Cu ions inside the cells, causing cytotoxicity.45 Wongrakpanich et al. stated that the difference in CuO NPs size might have affected the rate of entry of NPs into the cell, potentially influencing the amount of intracellular dissolution of Cu2+ and causing a differential impact on cytotoxicity.46 Our results support this mechanism for more slowly-dissolving Cu-based NPs, but show that detrimental effects on cell health could be particle uptake-independent. Specifically, a change in NP surface chemistry results in different mechanisms of dissolution and, thus, interactions with cells.
The impact of intracellular Cu NP disposition on response has also been studied. Semisch et al. studied the effects of size on dissolution and uptake of nanoscale and micron-sized CuO particles. The particles used in their study were more slowly dissolved in cell culture medium than the NPs used in the present study.37 Although the micron-sized CuO particles were taken up by cells, their predicted intracellular and extracellular dissolution was slow, leading to far less severe outcomes as compared to CuO NPs, which were more rapidly dissolved due to high surface area. Karlsson et al. demonstrated that extracellular ionic release and corrosion of Cu NPs were responsible for direct cell membrane damage, however, cell-associated doses were not determined.31, 47 When considering these findings, we hypothesized that extracellular Cu ionic species should initiate the early response. Our present results agree with this general conclusion, but also further elucidated the importance of careful quantification of NP uptake and dissolution.
Previously, Wittmaack proposed that because of rapid gravitational settling of nanostructured particles, cell interactions with NPs could be greater than what would be inferred from the suspension concentration, resulting in higher toxicity.48 Computational models have been developed to better understand the in vitro dosimetry of engineered nanomaterials.49–51 These studies indicate that the transport of particles in cell culture medium is controlled by diffusion and sedimentation processes, which are themselves influenced by agglomerate size and density.52 According to the computational models, sedimentation is dominant when particle (agglomerate) size is above 100 nm, whereas diffusion dominates when particle (agglomerate) size is below 10 nm. Between 10 and 100 nm, both mechanisms contribute to the reduced rate of total transport. Based on these models53, 54 and our measured hydrodynamic sizes of the NPs (Fig. 4), the Cu-MOA, Cu-MDA, and Cu-MHA NPs should be transported to the cell surface via sedimentation, whereas Cu-TA NP transport is likely to be the combination of diffusion and sedimentation, particularly prior to extensive dissolution. Any interference in NP transport due to high suspension concentrations did not significantly impact our findings, as the temporal and dose-related changes in the MTS response and in luciferase activity converged very well. Moreover, our directly measured dosimetry data demonstrate that in addition to transport and settling of NPs, dissolution, location of dissolution, and dynamics in particle size are other critical factors that need to be taken into consideration for understanding in vitro dosimetry and cytotoxicity of NPs. Specifically, the dissolution rate of Cu ionic species inside or outside the cells is an important determinant of cellular response.
Conclusions
This study shows that surface chemistry – the dissolution kinetics of Cu NPs, in particular – is critical in determining their uptake and cytotoxicity in a lung cell line (A549luc). Surface chemistry affects the physicochemical properties of NPs in biological media, resulting in different agglomeration, oxidation, and dissolution rates. In addition to particle agglomeration, size-dependent sedimentation and diffusion, the dissolution rate needs to be taken into consideration regarding the delivered dose when using in vitro models. If NPs are not dissolved within the time frame of an in vitro study, the delivered dose to the cells may be predicted through the balance of sedimentation and diffusional transport, which may be estimated by mathematical models. However, if dissolution occurs over the time scale of experiments, dissolution rate, biodistribution and the formed ionic species (inside or outside the cells) are all important parameters to be considered.
Supplementary Material
Acknowledgments
The authors thank Robert Gelein, Nancy Corson and Andrea Kennell for their technical assistance. This work was supported by grants from the NIH (RO1 CA134218, RC2 ES018741, P30 ES001247) and by a start-up fund from the University of Illinois.
Footnotes
Electronic Supplementary Information (ESI) available: [ATR-IR spectrum; dosimetry data; luciferase fitting curve and maximum slope; TEM micrographs of Cu NPs]. See DOI: 10.1039/x0xx00000x
Notes and references
- 1.Kim C, Lee G, Rhee C, Lee M. Nanoscale. 2015;7:6627–6635. doi: 10.1039/c5nr00956a. [DOI] [PubMed] [Google Scholar]
- 2.Panthani MG, Akhavan V, Goodfellow B, Schmidtke JP, Dunn L, Dodabalapur A, Barbara PF, Korgel BA. J Am Chem Soc. 2008;130:16770–16777. doi: 10.1021/ja805845q. [DOI] [PubMed] [Google Scholar]
- 3.Hessel CM, Pattani VP, Rasch M, Panthani MG, Koo B, Tunnell JW, Korgel BA. Nano Lett. 2011;11:2560–2566. doi: 10.1021/nl201400z. [DOI] [PMC free article] [PubMed] [Google Scholar]
- 4.Chithrani BD, Ghazani AA, Chan WCW. Nano Lett. 2006;6:662–668. doi: 10.1021/nl052396o. [DOI] [PubMed] [Google Scholar]
- 5.Bazan-Diaz L, Mendoza-Cruz R, Velazquez-Salazar JJ, Plascencia-Villa G, Romeu D, Reyes-Gasga J, Herrera-Becerra R, Jose-Yacaman M, Guisbiers G. Nanoscale. 2015;7:20734–20742. doi: 10.1039/c5nr06491k. [DOI] [PubMed] [Google Scholar]
- 6.Ding K, Zeng J, Jing L, Qiao R, Liu C, Jiao M, Li Z, Gao M. Nanoscale. 2015;7:11075–11081. doi: 10.1039/c5nr02180d. [DOI] [PubMed] [Google Scholar]
- 7.Souto EB, Müller RH. Int J Cosmet Sci. 2008;30:157–165. doi: 10.1111/j.1468-2494.2008.00433.x. [DOI] [PubMed] [Google Scholar]
- 8.Elder A, Yang H, Gwiazda R, Teng X, Thurston S, He H, Oberdorster G. Adv Mater. 2007;19:3124–3129. [Google Scholar]
- 9.Landsiedel R, Ma-Hock L, Kroll A, Hahn D, Schnekenburger J, Wiench K, Wohlleben W. Adv Mater. 2010;22:2601–2627. doi: 10.1002/adma.200902658. [DOI] [PubMed] [Google Scholar]
- 10.Lerner CA, Rutagarama P, Ahmad T, Sundar IK, Elder A, Rahman I. Biochem Biophys Res Commun. 2016;477:620–625. doi: 10.1016/j.bbrc.2016.06.109. [DOI] [PMC free article] [PubMed] [Google Scholar]
- 11.Lynch I, Dawson KA. Nano Today. 3:40–47. [Google Scholar]
- 12.Vanwinkle BA, Bentley KLD, Malecki JM, Gunter KK, Evans IM, Elder A, Finkelstein JN, Oberdörster G, Gunter TE. Nanotoxicology. 2009;3:307–318. doi: 10.1080/17435390903121949. [DOI] [PMC free article] [PubMed] [Google Scholar]
- 13.Pettibone JM, Adamcakova-Dodd A, Thorne PS, O’Shaughnessy PT, Weydert JA, Grassian VH. Nanotoxicology. 2008;2:189–204. [Google Scholar]
- 14.Rushton EK, Jiang J, Leonard SS, Eberly S, Castranova V, Biswas P, Elder A, Han XL, Gelein R, Finkelstein J, Oberdörster G. J Toxicol Env Health Part A. 2010;73:445–461. doi: 10.1080/15287390903489422. [DOI] [PMC free article] [PubMed] [Google Scholar]
- 15.Xiao Y, Peijnenburg WJGM, Chen G, Vijver MG. Sci Total Environ. 2016;563–564:81–88. doi: 10.1016/j.scitotenv.2016.04.104. [DOI] [PubMed] [Google Scholar]
- 16.Rodhe Y, Skoglund S, Odnevall Wallinder I, Potácová Z, Möller L. Toxicol in Vitro. 2015;29:1711–1719. doi: 10.1016/j.tiv.2015.05.020. [DOI] [PubMed] [Google Scholar]
- 17.Shi M, Kwon HS, Peng Z, Elder A, Yang H. ACS Nano. 2012;6:2157–2164. doi: 10.1021/nn300445d. [DOI] [PMC free article] [PubMed] [Google Scholar]
- 18.Cho WS, Duffin R, Poland CA, Duschl A, Oostingh GJ, MacNee W, Bradley M, Megson IL, Donaldson K. Nanotoxicology. 2012;6:22–35. doi: 10.3109/17435390.2011.552810. [DOI] [PubMed] [Google Scholar]
- 19.Mudunkotuwa IA, Pettibone JM, Grassian VH. Environ Sci Technol. 2012;46:7001–7010. doi: 10.1021/es203851d. [DOI] [PubMed] [Google Scholar]
- 20.Karlsson HL, Cronholm P, Gustafsson J, Moller L. Chem Res Toxicol. 2008;21:1726–1732. doi: 10.1021/tx800064j. [DOI] [PubMed] [Google Scholar]
- 21.Midander M, Cronholm P, Karlsson HL, Elihn K, Moller L, Leygraf C, Wallinder IO. Small. 2009;5:389–399. doi: 10.1002/smll.200801220. [DOI] [PubMed] [Google Scholar]
- 22.Cronholm P, Midander K, Karlsson HL, Elihn K, Wallinder IO, Möller L. Nanotoxicology. 2011;5:269–281. doi: 10.3109/17435390.2010.536268. [DOI] [PubMed] [Google Scholar]
- 23.Thit A, Selck H, Bjerregaard HF. Toxicol in Vitro. 2015;29:1053–1059. doi: 10.1016/j.tiv.2015.03.020. [DOI] [PubMed] [Google Scholar]
- 24.Misra SK, Nuseibeh S, Dybowska A, Berhanu D, Tetley TD, Valsami-Jones E. Nanotoxicology. 2014;8:422–432. doi: 10.3109/17435390.2013.796017. [DOI] [PubMed] [Google Scholar]
- 25.Joshi A, Rastedt W, Faber K, Schultz AG, Bulcke F, Dringen R. Neurochem Res. 2016:1–16. doi: 10.1007/s11064-016-2020-z. [DOI] [PubMed] [Google Scholar]
- 26.Susumu K, Mei BC, Mattoussi H. Nat Protocols. 2009;4:424–436. doi: 10.1038/nprot.2008.247. [DOI] [PubMed] [Google Scholar]
- 27.Singal M, Finkelstein JN. Inhal Toxicol. 2005;17:415–425. doi: 10.1080/08958370591002021. [DOI] [PubMed] [Google Scholar]
- 28.Mei BC, Susumu K, Medintz IL, Mattoussi H. Nat Protocols. 2009;4:412–423. doi: 10.1038/nprot.2008.243. [DOI] [PubMed] [Google Scholar]
- 29.Susumu K, Uyeda HT, Medintz IL, Pons T, Delehanty JB, Mattoussi H. J Am Chem Soc. 2007;129:13987–13996. doi: 10.1021/ja0749744. [DOI] [PubMed] [Google Scholar]
- 30.Xia T, Hamilton RF, Jr, Bonner JC, Crandall ED, Elder A, Fazlollahi F, Girtsman TA, Kim K, Mitra S, Ntim SA. Environ Health Perspect. 2013;121:683–690. doi: 10.1289/ehp.1306561. [DOI] [PMC free article] [PubMed] [Google Scholar]
- 31.Karlsson HL, Cronholm P, Hedberg Y, Tornberg M, De Battice L, Svedhem S, Wallinder IO. Toxicology. 2013;313:59–69. doi: 10.1016/j.tox.2013.07.012. [DOI] [PubMed] [Google Scholar]
- 32.de Mesy Jensen K. technique for FNA smears for diagnostic electron microscopy. Tech Sample CY-1. 1987 [Google Scholar]
- 33.Potter RMM, SM Glastechnische Berichte. 1991;84:16–28. [Google Scholar]
- 34.Elder AGR, Silva V, Feikert T, Opanashuk L, Carter J, Potter R, Maynard A, Ito Y, Finkelstein J, Oberdörster G. Environ Health Perspect. 2006;114:1172–1178. doi: 10.1289/ehp.9030. [DOI] [PMC free article] [PubMed] [Google Scholar]
- 35.Maurer EI, Sharma M, Schlager JJ, Hussain SM. Nanotoxicology. 2014;8:718–727. doi: 10.3109/17435390.2013.824127. [DOI] [PubMed] [Google Scholar]
- 36.Gillespie PA, Kang GS, Elder A, Gelein R, Chen L, Moreira AL, Koberstein J, Tchou-Wong KM, Gordon T, Chen LC. Nanotoxicology. 2010;4:106–119. doi: 10.3109/17435390903470101. [DOI] [PMC free article] [PubMed] [Google Scholar]
- 37.Semisch A, Ohle J, Witt B, Hartwig A. Part Fibre Toxicol. 2014;11:10. doi: 10.1186/1743-8977-11-10. [DOI] [PMC free article] [PubMed] [Google Scholar]
- 38.Schmidt LD. The Engineering of Chemical Reactions. 2. ch. 2. Oxford University Press; Oxford: 2005. pp. 75–77. [Google Scholar]
- 39.Han X, Corson N, Wade-Mercer P, Gelein R, Jiang J, Sahu M, Biswas P, Finkelstein JN, Elder A, Oberdörster GN. Toxicology. 2012;297:1–9. doi: 10.1016/j.tox.2012.03.006. [DOI] [PMC free article] [PubMed] [Google Scholar]
- 40.Hung LI, Tsung CK, Huang W, Yang P. Adv Mater. 2010;22:1910–1914. doi: 10.1002/adma.200903947. [DOI] [PubMed] [Google Scholar]
- 41.Guo B, Zebda R, Drake S, Sayes C. Part Fibre Toxicol. 2009;6:1–13. doi: 10.1186/1743-8977-6-4. [DOI] [PMC free article] [PubMed] [Google Scholar]
- 42.Kanninen P, Johans C, Merta J, Kontturi K. J Colloid Interface Sci. 2008;318:88–95. doi: 10.1016/j.jcis.2007.09.069. [DOI] [PubMed] [Google Scholar]
- 43.Yanase A, Komiyama H. Surf Sci. 1991;248:11–19. [Google Scholar]
- 44.Cho WS, Duffin R, Thielbeer F, Bradley M, Megson IL, MacNee W, Poland CA, Tran CL, Donaldson K. Toxicol Sci. 2012;126:469–477. doi: 10.1093/toxsci/kfs006. [DOI] [PubMed] [Google Scholar]
- 45.Studer AM, Limbach LK, Van Duc L, Krumeich F, Athanassiou EK, Gerber LC, Moch H, Stark WJ. Toxicol Lett. 2010;197:169–174. doi: 10.1016/j.toxlet.2010.05.012. [DOI] [PubMed] [Google Scholar]
- 46.Wongrakpanich A, Mudunkotuwa IA, Geary SM, Morris AS, Mapuskar KA, Spitz DR, Grassian VH, Salem AK. Environ Sci Nano. 2016;3:365–374. doi: 10.1039/C5EN00271K. [DOI] [PMC free article] [PubMed] [Google Scholar]
- 47.Hedberg J, Karlsson HL, Hedberg Y, Blomberg E, Odnevall Wallinder I. Colloids Surf B Biointerfaces. 2016;141:291–300. doi: 10.1016/j.colsurfb.2016.01.052. [DOI] [PubMed] [Google Scholar]
- 48.Wittmaack K. ACS Nano. 2011;5:3766–3778. doi: 10.1021/nn200112u. [DOI] [PubMed] [Google Scholar]
- 49.Cohen JM, Teeguarden JG, Demokritou P. Part Fibre Toxicol. 2014;11:20. doi: 10.1186/1743-8977-11-20. [DOI] [PMC free article] [PubMed] [Google Scholar]
- 50.DeLoid G, Cohen JM, Darrah T, Derk R, Rojanasakul L, Pyrgiotakis G, Wohlleben W, Demokritou P. Nat Commun. 2014;5:3514. doi: 10.1038/ncomms4514. [DOI] [PMC free article] [PubMed] [Google Scholar]
- 51.Watson CY, DeLoid GM, Pal A, Demokritou P. Small. 2016;12:3172–3180. doi: 10.1002/smll.201600314. [DOI] [PMC free article] [PubMed] [Google Scholar]
- 52.Hinderliter PM, Minard KR, Orr G, Chrisler WB, Thrall BD, Pounds JG, Teeguarden JG. Part Fibre Toxicol. 2010;7:36. doi: 10.1186/1743-8977-7-36. [DOI] [PMC free article] [PubMed] [Google Scholar]
- 53.Cohen J, DeLoid G, Pyrgiotakis G, Demokritou P. Nanotoxicology. 2012;7:417–431. doi: 10.3109/17435390.2012.666576. [DOI] [PMC free article] [PubMed] [Google Scholar]
- 54.DeLoid GM, Cohen JM, Pyrgiotakis G, Pirela SV, Pal A, Liu J, Srebric J, Demokritou P. Part Fibre Toxicol. 2015;12:32. doi: 10.1186/s12989-015-0109-1. [DOI] [PMC free article] [PubMed] [Google Scholar]
Associated Data
This section collects any data citations, data availability statements, or supplementary materials included in this article.


