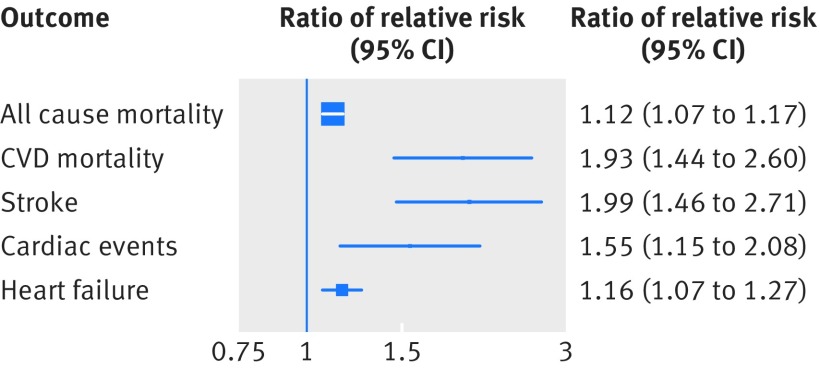
Fig 6 Maximally adjusted pooled women-to-men ratio of relative risks for all cause mortality, CVD (cardiovascular) mortality, stroke, cardiac events, and heart failure, comparing individuals with and without AF. Area of each square is proportional to inverse variance of estimate. Horizontal lines indicate 95% confidence intervals

An official website of the United States government
Here's how you know
Official websites use .gov
A
.gov website belongs to an official
government organization in the United States.
Secure .gov websites use HTTPS
A lock (
) or https:// means you've safely
connected to the .gov website. Share sensitive
information only on official, secure websites.
