

SUMMARY
S-adenosylmethionine (SAM) is the methyl donor for biological methylation modifications that regulate protein and nucleic acid functions. Here we show that methylation of a phospholipid, phosphatidylethanolamine (PE), is a major consumer of SAM. The induction of phospholipid biosynthetic genes is accompanied by induction of the enzyme that hydrolyzes S-adenosylhomocysteine (SAH), a product and inhibitor of methyltransferases. Beyond its function for the synthesis of phosphatidylcholine (PC), the methylation of PE facilitates the turnover of SAM for the synthesis of cysteine and glutathione through transsulfuration. Strikingly, cells that lack PE methylation accumulate SAM, which leads to hypermethylation of histones and the major phosphatase PP2A, dependency on cysteine, and sensitivity to oxidative stress. Without PE methylation, particular sites on histones then become methyl sinks to enable the conversion of SAM to SAH. These findings reveal an unforeseen metabolic function for phospholipid and histone methylation intrinsic to the life of a cell.
eTOC Blurb
Ye et al., show how that methylation of phosphatidylethanolamine for the synthesis of phosphatidylcholine is the major consumer of SAM, and is required for the efficient synthesis of cysteine and glutathione. Cells lacking phospholipid methylation accumulate SAM and exhibit hypermethylation of histones, revealing a role for phospholipids and histones as methyl group sinks, which is required for optimal cellular metabolism, signaling, and transcriptional regulation.
INTRODUCTION
Cells must reprogram metabolism and gene expression in response to a dynamic nutrient environment. Changes in macronutrients (Broach, 2012; Hinnebusch, 2005), such as carbohydrates and amino acids, or key metabolites, such as acetyl-CoA (Cai et al., 2011; Cai and Tu, 2012; Shi and Tu, 2013), can serve as intrinsic signals to drive adaptation by reconfiguring the genetic makeup of the cell. Since phospholipids are the major component of cell membranes and amongst the most abundant molecular species in cells, the regulation of phospholipid synthesis necessitates coordination with metabolic status (Carman and Han, 2011; Henry et al., 2012). However, an open question remains how cells integrate genetic regulation with metabolic information from membrane lipids.
The major phospholipids in eukaryotic biomembranes are phosphatidylcholine (PC), phosphatidylethanolamine (PE), phosphatidylinositol (PI), and phosphatidylserine (PS) (van Meer et al., 2008). The composition of phospholipids is highly variable among organisms, different types of cells in multicellular organisms, and even throughout the endomembrane system within the cell (van Meer et al., 2008; Zinser et al., 1991). For the most abundant phospholipid PC, the conventional function of PC synthesis is to provide major bilayer lipids for constructing cellular membranes. While PC can be synthesized by the three-step methylation of PE (Bremer and Greenberg, 1961) or via the Kennedy pathway when choline is available (Kennedy and Weiss, 1956), it has been unclear whether these two PC biosynthetic pathways might play different physiological roles. Understanding novel cellular functions for phospholipid methylation would elucidate the biological importance of PC synthesis and establish a foundation to revisit their roles in different disease settings.
Among thousands of metabolic reactions, the biological methylation reaction is one of the most important and universal. The reaction transfers a methyl group from the donor S-adenosylmethionine (SAM) to a variety of cellular substrates, including lipids, proteins, nucleic acids, and cellular metabolites. Methylation consumes SAM and releases the byproduct S-adenosylhomocysteine (SAH) that is further metabolized to homocysteine, and homocysteine can be remethylated to methionine or used for the synthesis of cysteine and glutathione via the transsulfuration pathway (Brosnan and Brosnan, 2006; Stipanuk, 2004). Thus, methylation reactions are also metabolically important for synthesis of other sulfur-containing metabolites. The findings that PE methylation regulates plasma homocysteine and the excretion levels of homocysteine from hepatocytes (Vance, 2014) implicate a function for PE methylation in sulfur metabolism. Moreover, studies in yeast have linked the synthesis of phospholipids to the transcriptional regulation of sulfur metabolic genes (Hickman et al., 2011; Sadhu et al., 2014).
Therefore, phospholipid methylation is a potential mediator of cellular metabolism, while the underlying mechanisms remain largely unexplored.
Herein, we report that PE methylation is the major SAM-consuming methylation reaction and required for properly reprogramming cellular metabolism and gene expression. Deficiency in PE methylation elevates cellular SAM levels, resulting in aberrant increases in the methylation of histones as well as the major cellular phosphatase PP2A. Subsequent genetic and metabolic analyses have enabled us to reveal unexpected roles of histone methylation in SAM homeostasis and sulfur metabolism. We propose that membrane lipids and the histones are metabolically linked through their functions as methyl sinks, thereby unveiling an unanticipated yet critical metabolic function for such methylation modifications.
RESULTS
PE methylation is the major SAM consumer
We sought to identify major SAM-consuming methylation reactions in budding yeast by screening viable methyltransferase mutants for SAM excretion. If SAM is substantially consumed for a certain methylation reaction, disruption of this process might cause substantial SAM accumulation, which could leak and support the growth of a SAM auxotroph reporter strain lacking SAM synthetase enzymes (sam1Δsam2Δ). Strikingly, among 65 methyltransferase mutants, the SAM excretion phenotype was only observed in cho2Δ and opi3Δ mutants (Figures 1A and S1). Cho2 and Opi3 are two methyltransferases that methylate the phospholipid PE for PC synthesis (Figure 1B). This phenotype is most likely due to increases in intracellular SAM because boosting SAM levels by methionine supplementation in the growth medium also led to SAM excretion by wild type (WT) cells (Figure S1A).
Figure 1. PE methylation pathway is the major consumer of intracellular SAM.

(A) Scheme depicting assay to assess possible SAM-leaking phenotype of individual methyltransferase mutants. The leakage of SAM from cho2Δ mutants but not WT enables small colonies of the SAM auxotroph strain sam1Δsam2Δ to grow. Data for all methyltransferase mutants tested are shown in Figure S1.
(B) The PE methylation pathway and enzymes responsible for the synthesis of phospholipids.
(C) Relative abundance of SAM in indicated strains grown in logarithmic and stationary phases in YPD. Data are represented as mean ± SD (n≥3).
(D) Representative growth curves of sam1Δsam2Δ and sam1Δsam2Δcho2Δ strains in YPL. Note that lack of Cho2p spares SAM and improves growth of SAM auxotrophs (sam1Δsam2Δ) at intermediate concentrations of SAM supplementation (100 μM).
(E) Relative abundance of SAM in the indicated strains grown in YPL. Data are represented as mean ± SD (n=3).
(F) Comparison of SAM levels between respiration-competent ρ+ and incompetent ρ° cells. Data are represented as mean ± SD (n=4). Error bars indicate SD. *p < 0.05, **p < 0.01, and n.s., no significance. See also Figure S1 and S2.
To confirm whether disrupting PE methylation results in SAM accumulation, we measured intracellular SAM levels using targeted liquid chromatography-tandem mass spectrometry (LC-MS/MS). As expected, SAM levels were significantly increased in cho2Δ and opi3Δ cells in stationary phase (Figure 1C). Furthermore, deleting upstream enzymes involved in PE synthesis such as the PS synthase (CHO1), or a double-deletion of two genes encoding PS decarboxylase (PSD1 and PSD2), was also sufficient to increase SAM (Figure 1C). Notably, among all mutants in this pathway, SAM was most abundant in cho2Δ cells, and further deletion of OPI3 did not increase SAM in cho2Δ mutants (Figure 1C), suggesting that the first step of PE methylation catalyzed by Cho2 accounts most for SAM consumption. Consistent with this idea, for SAM auxotrophs (sam1Δsam2Δ), deletion of CHO2 and the subsequent sparing of SAM, improved cell growth when supplemented SAM in the growth medium was limiting (Figure 1D and S1C).
Interestingly, all mutants in the PE methylation pathway contained much higher SAM in stationary phase than in logarithmic phase (Figure 1C). Because cells cultured in glucose medium respire more in stationary phase, we next investigated if the extent of SAM accumulation is associated with respiration. We examined SAM levels in cells growing logarithmically in lactate as a non-fermentable carbon source. These mutants accumulated more SAM in lactate than in glucose (Figure 1E). Furthermore, SAM accumulation in glucose was substantially reduced in both logarithmic and stationary phases in respiration-incompetent cho2Δ ρ° mutants (Figure 1F). These findings suggest important physiological roles for PE methylation in controlling SAM homeostasis, especially for respiring cells.
SAM accumulation in cho2Δ mutants is not caused by PC deficiency
PC accounts for more than 50% of the total phospholipids in most eukaryotic membranes (van Meer et al., 2008). While the conversion of PE to PC by methylation is the obligate pathway for PC synthesis when choline is absent, it is unclear if this methylation pathway plays other cellular roles beyond PC synthesis when choline is present. Deficient PC synthesis in cho2Δ and opi3Δ cells severely impaired growth in synthetic minimal media containing no choline (Figures S2A and D). However, these mutants did not exhibit any growth defect in rich media and maintained normal PC content (Figures S2B, C, and E), suggesting that rich medium contains sufficient choline for PC synthesis. As expected, the lipid precursors PE and phosphatidylmonomethylethanolamine (PMME) for PC synthesis were elevated in cho2Δ, cho2Δopi3Δ and in opi3Δ, respectively (Figures S1A–C). Surprisingly, adding choline did not prevent SAM accumulation in cho2Δ mutants (Figure S2F), indicating that SAM accumulation was not caused by insufficient choline. Therefore, PC deficiency is not likely the cause of SAM accumulation or excretion in PE methylation mutants.
PE methylation drives sulfur metabolism
As the major SAM-consuming reaction, PE methylation is accompanied by substantial production of S-adenosylhomocysteine (SAH). Deleting the SAH hydrolase SAH1 caused defective growth (Figure 2B) due to accumulation of SAH (Malanovic et al., 2008), which acts as a competitive inhibitor of numerous SAM-dependent methyltransferase enzymes (Ueland, 1982). Inhibition of PE methylation by deletion of CHO2 in sah1Δ alleviated this growth defect (Figure 2B), suggesting that the accumulation of SAM and concomitant reduction in SAH in these mutants may alleviate their deficiency in hydrolyzing SAH. In contrast, increasing PE methylation by deletion of OPI1, the transcriptional repressor of the genes in the PE methylation pathway, exacerbated the growth defect of sah1Δ mutants (Figure 2B). These genetic data are consistent with the fact that PE methylation is a major producer of SAH.
Figure 2. Regulation of the PE methylation pathway is critical for sulfur metabolism.
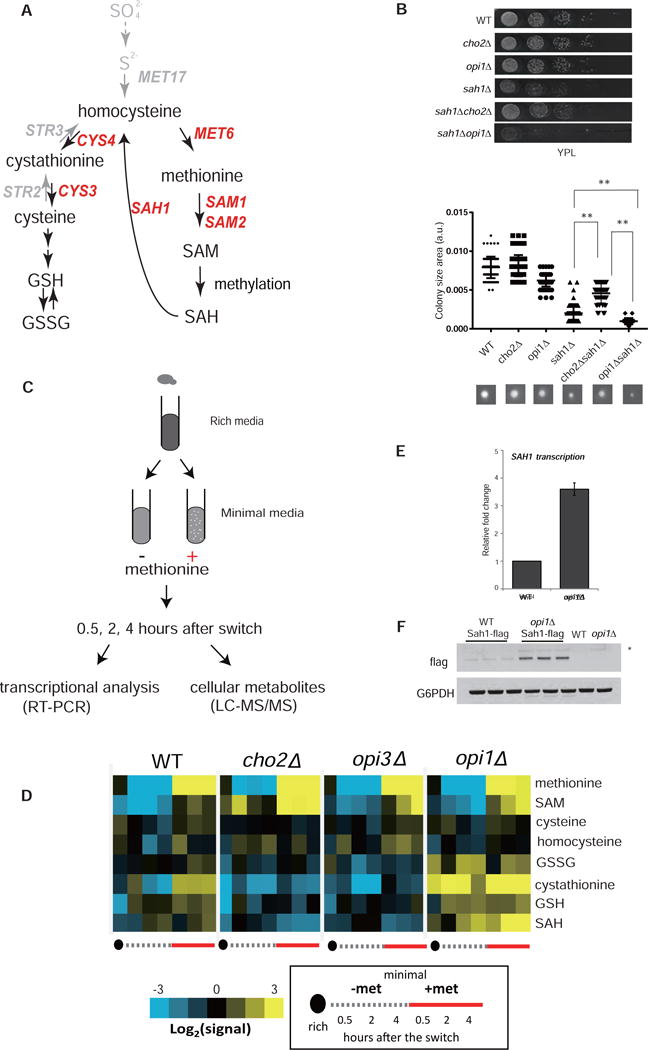
(A) Diagram of the sulfur metabolic pathways in budding yeast. Arrows and text in grey depict pathways absent in mammalian cells.
(B) Top: growth of the indicated strains on YPL plates after incubation at 30°C for two days. Rows depict serial, 10-fold dilutions of cells. Bottom: quantification of colony size of the indicated strains. At least 20 colonies were sized for each strain. A representative colony is shown for each strain. Error bars indicate SD. **p < 0.01.
(C) Experimental setup for measuring transcriptional and metabolic changes in response to a switch from YPL to SL or SL containing methionine.
(D) Heat maps depicting the abundances of key sulfur metabolites in cells switched from YPL to SL and collected at the indicated times. The data are representative of two independent time courses. Numerical data are presented in Table S1.
(E) Comparison of mRNA transcripts of SAH1 and (F) Sah1-FLAG protein abundance between WT and opi1Δ cells. Data are represented as mean ± SD (n=3). See also Figure S3.
We next used targeted LC-MS/MS to monitor other sulfur-containing metabolites in WT, cho2Δ, and opi3Δ cells. We used a previously established condition to starve cells for sulfur amino acids, with which we uncovered novel regulators of autophagy and mechanisms for sensing sulfur-containing amino acids (Laxman et al., 2013; Sutter et al., 2013; Wu and Tu, 2011). Specifically, cells logarithmically growing in a lactate rich medium (YPL) were switched to synthetic minimal medium without amino acids and containing lactate (SL), and sulfur-containing metabolites were quantitated at different times (Figure 2C). Methionine and SAM amounts decreased rapidly following switch to SL medium as observed previously (Figure 2D and Table S1) (Sutter et al., 2013). Supplementation of methionine to cells growing in SL medium inhibits autophagy and promotes growth (Sutter et al., 2013). We observed that methionine was readily metabolized under these conditions, as it promoted an increase in amounts of all the sulfur-containing metabolites, including SAM, SAH, homocysteine, cystathionine, cysteine, and GSH (Figure 2D and Table S1).
However, while methionine was similarly depleted in cho2Δ and opi3Δ mutants after the switch, in contrast, SAM was not decreased, but instead increased substantially in cho2Δ mutants (Figure 2D and Table S1). Due to reduced flux of SAM to SAH, levels of SAH and its downstream metabolites cystathionine and GSH were decreased (Figure 2D and Table S1). Furthermore, we observed a striking inability of these mutants to metabolize methionine. Methionine supplementation resulted in a substantial accumulation of SAM and little effect on metabolites downstream of SAM, such as cystathionine, cysteine and glutathione (Figure 2D and Table S1).
We then investigated sulfur metabolism in the opi1Δ mutant, which harbors hyperactive PE methylation due to the derepression of phospholipid biosynthetic enzymes. In stark contrast to cho2Δ mutants, opi1Δ mutants had much higher levels of SAH, cystathionine, and glutathione compared to WT cells before or after the switch to SL medium (Figure 2D and Table S1). Methionine supplementation resulted in even greater amounts of cystathionine, cysteine, and glutathione (Figure 2D and Table S1) presumably due to increased conversion of SAM to SAH through increased PE methylation. Taken together, these data demonstrate that PE methylation fuels sulfur metabolism by converting SAM to SAH, which regulates the intracellular SAM/SAH ratio as well as cystathionine, cysteine, and GSH production.
To determine if these phenotypes of opi1Δ mutants are specifically due to increased PE methylation, we confirmed that CHO1, PSD1, CHO2, and OPI3 mRNA transcription were increased in opi1Δ cells (Figure S3A). Furthermore, deletion of CHO2 decreased sulfur-containing metabolites in opi1Δ down to levels observed in WT (Figure S3B). Interestingly, both mRNA and protein amounts of the SAH hydrolase enzyme (SAH1) were significantly increased in opi1Δ mutants (Figures 2E–F), presumably to prepare cells for efficient removal of SAH produced by hyperactive PE methylation. Again, choline supplementation had no effect on sulfur metabolite levels in cho2Δ mutants in the absence or presence of methionine (Figure S3C).
Thus, these metabolite profiling experiments reveal that metabolic flux of phospholipid methylation may function in supplying SAH for synthesis of these other critical sulfur-containing metabolites (cysteine and GSH), from methionine and SAM. They further predict that loss of this metabolic function of PE methylation might be detrimental due to increases in the SAM/SAH ratio and insufficient cysteine and GSH.
Transcriptional coordination of sulfur and phospholipid metabolism genes in response to methionine
We next investigated how normal cells physiologically control PE methylation and sulfur metabolism in response to perturbations in their nutrient environment. RT-PCR analysis of gene expression indicated that mRNA levels of sulfur metabolism genes MET17, MET6, SAM1, SAM2, STR3, STR2, CYS4, and CYS3 (Figure 3A and Table S2) were greatly increased shortly after switch from YPL to SL medium due to insufficiency of methionine and SAM (Sutter et al., 2013) and were repressed by methionine supplementation, as expected (Figure 3A). We further tested how transcription of genes in the PE methylation pathway responded to the switch. Opi1, the transcriptional repressor of phospholipid biosynthetic genes, was exported to the periphery of the nucleus within 1 hour of the switch (Figure 3C and S4A), concomitant with increases in mRNA transcripts of CHO1, PSD1, CHO2, and OPI3 (Figure 3B). Interestingly, transcription of these genes was also repressed by methionine (Figure 3B). Our observations on the transcriptional coordination between phospholipid synthesis and sulfur metabolism are consistent with previous reports (Hickman et al., 2011; Sadhu et al., 2014).
Figure 3. Coordination of phospholipid methylation with sulfur metabolism is required for metabolic homeostasis and survivability against oxidative stress.
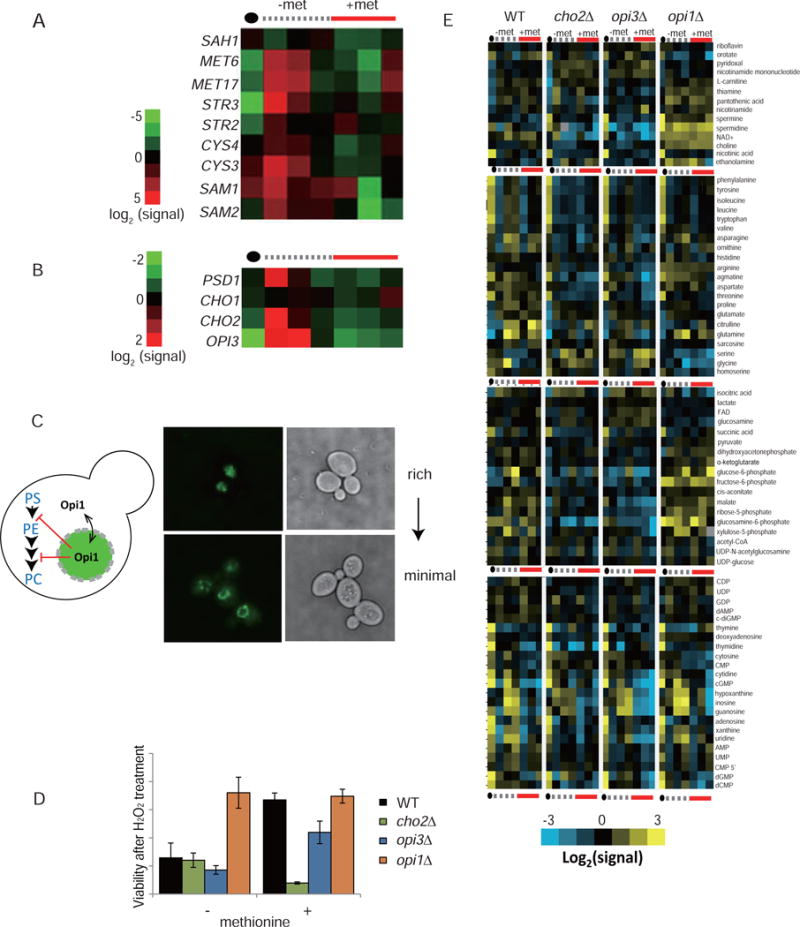
(A) Heat maps depicting mRNA levels of major sulfur metabolic genes and (B) phospholipid biosynthetic genes in response to the switch from YPL to SL or SL containing methionine. Numerical data are presented in Table S2.
(C) Localization of the transcriptional repressor Opi1-GFP in YPL or SL medium.
(D) Cell viability of the indicated strains following treatment with 5 mM H2O2 in SL medium with or without methionine. Data are represented as mean ± SD (n=3). Note that supplementation of methionine promotes survival of WT but not cho2Δ cells.
(E) Heat maps depicting abundances of major cellular metabolites in indicated cells switched from YPL to SL with or without methionine. The data are representative of two independent time courses and subject to hierarchical clustering. Numerical data are presented in table S1. See also Figure S4.
Although Opi1 translocation has been shown to be responsive to inositol for cells grown in glucose medium, inositol did not prevent exclusion of Opi1 from the nucleus (Figure S4B), nor did methionine (Figure S4B). Using INO1 transcription as a reporter for Opi1-mediated repression, we found that inositol decreased the magnitude of INO1 derepression (Figure S4C), while methionine delayed the derepression (Figure S4C). Taken together, although Opi1-mediated derepression of phospholipid biosynthetic genes is likely responsible for increased PE methylation upon switch to SL medium, there are additional mechanisms involved in the regulation of Opi1-target genes beyond just its localization.
Disruption of PE methylation leads to sensitivity to oxidants and metabolic reconfiguration
Cells without PE methylation are compromised in their ability to convert methionine to other sulfur-containing metabolites such as cystathionine and glutathione (Figure 2D and Table S1). This suggests that such cells may be disadvantaged under conditions that might demand more of these metabolites, such as in response to oxidants. To test if PE methylation-fueled metabolism helps protect cells against oxidative stress, we switched cells to SL containing H2O2 and determined cell survivability by assaying single colony formation. In the absence of methionine, only 10% of viable cells were detected in WT, cho2Δ, and opi3Δ cells after H2O2 treatment, whereas opi1Δ cells were more resistant to H2O2 (Figure 3D). Notably, methionine significantly improved viability of WT and opi3Δ, but not cho2Δ cells (Figure 3D). Thus, Cho2-catalyzed PE methylation might fulfill a key function in the defense against oxidative stress, likely by shunting methionine promptly to the synthesis of the antioxidant, GSH.
To understand how the regulation of PE methylation impacts on metabolic homeostasis beyond sulfur metabolism, we profiled metabolites covering major metabolic pathways in WT, cho2Δ, opi3Δ, and opi1Δ cells at different times after switching from YPL to SL or SL plus methionine (Figure 2C). Many clusters of metabolites in WT and opi1Δ were anti-correlated with those in cho2Δ and opi3Δ mutants (Figure 3E). These metabolites include vitamins, amino acids and their derivatives, and glycolytic intermediates. Overall, PE methylation is critical for protecting cells against oxidative stress by generating GSH and for maintaining cellular homeostasis by reconfiguring cellular metabolism. In addition, the influence of PE methylation extends beyond just the regulation of sulfur metabolism and affects a myriad of metabolic pathways in the cell.
The methylation of the major phosphatase PP2A is regulated by SAM/SAH ratios governed by PE methylation
PE methylation contributes to the depletion of SAM and accumulation of SAH after switching to SL, resulting in decreases in the SAM/SAH ratio (Figure 4A). Methionine, which boosts SAM levels, led to temporary increases in the SAM/SAH ratio in WT cells (Figure 4A) as excess SAM was eventually consumed by PE methylation. In contrast, cho2Δ mutants lacking PE methylation had a substantially higher SAM/SAH ratio that was sustained even after methionine addition. The aberrantly high SAM/SAH ratio suggests that particular methylation modifications might be altered in such mutants. In a previous study, we demonstrated that methylation of the phosphatase PP2A is responsive to SAM levels (Sutter et al., 2013), suggesting that PP2A methylation might be altered in cho2Δ and opi3Δ cells that have increased SAM/SAH ratios.
Figure 4. Increased SAM/SAH ratio resulting from deficiency in PE methylation leads to aberrant increases in the methylation of histones and the major phosphatase PP2A.
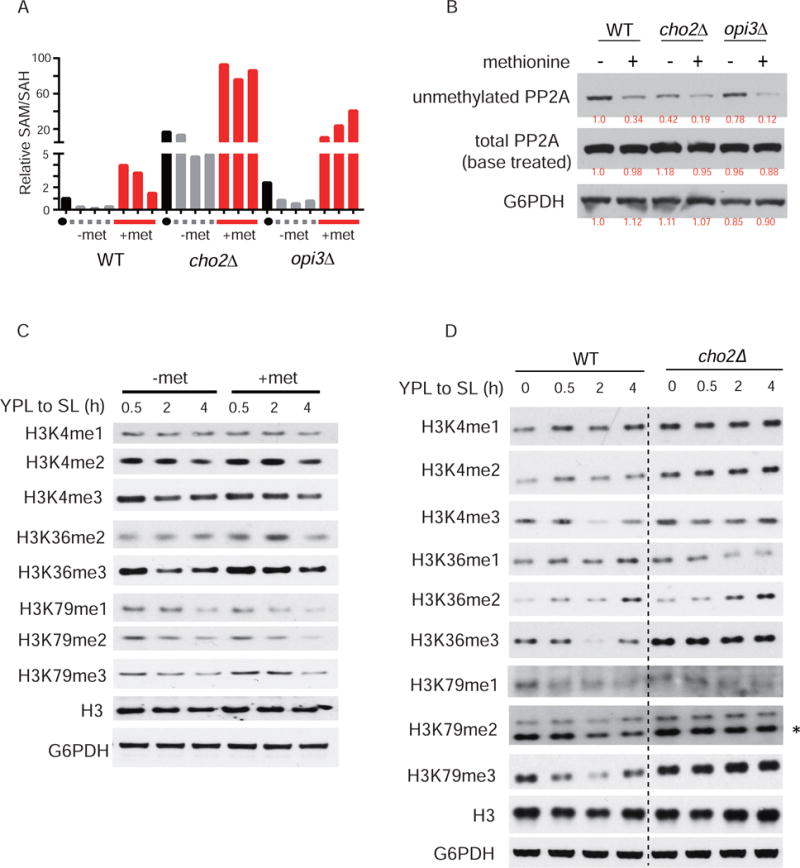
(A) SAM/SAH ratios were calculated from the relative abundances of SAM and SAH determined by LC-MS/MS.
(B) Western blots assaying the methylation state of PP2A in cells under indicated conditions. Note that the antibody preferentially recognizes the demethylated form of PP2A. Treatment of the membrane with NaOH hydrolyzes the carboxy methylester linkage, thereby enabling assessment of total PP2A.
(C) The effect of methionine supplementation on the dynamics of histone methylation following switch from YPL to SL medium for the indicated times.
(D) The dynamics of the methylation of H3 in WT, cho2Δ, and opi3Δ cells following switch from YPL to SL medium. The data are representative of at least three independent experiments.
We used an antibody that preferentially recognizes unmethylated PP2A to assess methylation status of PP2A. Because total PP2A remained constant under the experimental conditions (Figure 4B), the levels of methylated PP2A are anti-correlated to unmethylated PP2A. As expected, methionine increased PP2A methylation in WT cells after switching to SL (Figure 4B). Disruption of PE methylation promoted the methylation of PP2A, as the amount of unmethylated PP2A was substantially reduced in cho2Δ and opi3Δ cells, and further diminished by methionine addition (Figure 4B). Notably, methylated PP2A was substantially higher in cho2Δ than opi3Δ cells (Figure 4B). Because the methylation of PP2A is important for holoenzyme formation and the determination of substrate specificity (Stanevich et al., 2011; Tolstykh et al., 2000; Wei et al., 2001), the requirement of PE methylation for proper regulation of PP2A methylation status underscores a novel role of phospholipid methylation in phosphorylation-mediated cellular signaling.
Imbalance in SAM/SAH ratio alters histone methylation
We next tested whether the increased SAM/SAH ratio due to lack of PE methylation would impact other methylation processes in the cell, such as those on histones. Consistent with decreased methylation potential (Figure 4A), the amount of bulk methylation on various sites on histone H3 decreased gradually upon switch from YPL to SL medium (Figure 4C). However, methionine supplementation increased only some methylation marks in the timeframe examined. Specifically, di- and tri-methylation of H3K36 and tri-methylation of H3K79 were notably increased 2 hours after switching to methionine-containing SL medium (Figure 4C). Methylated histone amounts in the presence of methionine were eventually reduced to amounts comparable in the absence of methionine supplementation (Figure 4C), concomitant with decreases in methylation potential (Figure 4A), as excess SAM was consumed by PE methylation.
However, in cho2Δ cells that have increased SAM/SAH ratios, the levels of these methylation marks were increased, and the most striking increases were the tri-methylation marks H3K4me3, H3K36me3, and H3K79me3 (Figure 4D). The hypermethylation of histones due to compromised phospholipid methylation suggests a novel but underappreciated crosstalk between lipid metabolism and epigenetic regulation.
Transcriptional profiling reveals that histone hypermethylation in PE methylation-deficient cells is associated with defects in tuning gene expression
To understand potential genetic and transcriptional consequences of alterations in histone methylation resulting from imbalances in the SAM/SAH ratio (Figure 4D), we performed RNA-seq using WT and cho2Δ cells before and after the switch to SL medium. By comparing gene expression in WT cells before or 1 hour after the switch (Figure 5A), we found that mRNA levels of genes encoding sulfur metabolic pathways and stress-related responses were increased, while mRNA levels of genes encoding ribosomal and mitochondrial proteins were most decreased. These transcriptional alterations suggested that primary cellular responses were to increase sulfur metabolism and stress responses, while decreasing the activity of protein translation and mitochondrial functions. Notably, the induction of genes involved in sulfur metabolism was strongly attenuated in cho2Δ cells (Figure 5A), reminiscent of the previously reported repression of sulfur metabolism genes by high SAM levels (Cherest et al., 1973). In addition to defective induction of sulfur metabolism genes, many clusters of genes that were activated in WT, including amino acid metabolism, oxidation-reduction process, and organic acid metabolic pathways, were also downregulated (Table S3). Decreased amounts of these mRNAs might be associated with defective cellular metabolism and/or hypermethylated histones in cho2Δ, both of which could be associated with global defects in transcription. Interestingly, the downregulation of ribosomal subunit and ribosomal biogenesis genes was also less evident in cho2Δ cells (Figure 5A and Table S3). Thus, the increased SAM/SAH ratio caused by PE methylation-deficiency could disrupt histone methylation dynamics and the regulation of gene expression.
Figure 5. Transcriptional consequences in PE methylation-deficient cho2Δ cells.

(A) Volcano plots of RNA-Seq data depicting differentially expressed genes in WT cells before and 1 hour after the switch to SL, WT vs cho2Δ cells before or 1 and 3 hours after switch to SL. Numerical data are presented in Tables S4 and S6. Color designates different groups of genes encoding: ribosomal proteins (green), mitochondrial proteins (blue), proteins in sulfur metabolic pathways (red) and stress-related responses (yellow). Top-10 differentially expressed genes are listed when the represented group is uniformly altered under conditions depicted in the graph.
(B) RT-PCR analysis of mRNA transcript amounts of MET6, MET17, STR3, and SAM1 in WT, cho2Δ, histone methyltransferase mutants, and mutants with deletions of both CHO2 and histone methyltransferases, 1 hour after switching to SL. Data are represented as mean ± SD (n=3).
(C) Changes in mRNA transcripts in a time course experiment. Data are represented as the means of three replicates. See also Figure S5.
Methylation at H3K36 regulates cellular sensitivity to methionine
We next investigated how methylation of histones at specific lysine sites (K4, K36, and K79) might impact sulfur metabolism. We first tested how the growth of the corresponding histone methyltransferase mutants (set1Δ, set2Δ, dot1Δ) responded to methionine. Interestingly, methionine could not promote the growth of set2Δ cells (Figure S5A). The growth phenotype of the histone methyltransferase mutants is consistent with the histone substitution mutants whose corresponding lysine site for methylation is replaced with an alanine (Figure S5A). Therefore, these findings suggest that methylation at H3K36 is required for cellular responses to methionine. Indeed, preventing methylation specifically at H3K36 by set2Δ mutation led to abnormal, increased expression of MET6, MET17, STR3, and SAM1 (Figures 5B–C and S5B–C). We then tested whether the repression of sulfur metabolic genes in cho2Δ might be due to hypermethylation of H3K36. Unexpectedly, deletion of SET2 did not restore MET gene expression in cho2Δ (Figures 5C and S5C). In addition, the decreased transcription was not due to the combined effects of hypermethylation at H3K36 together with H3K4 or H3K79, because MET gene expression remained repressed in set1Δset2Δcho2Δ and set2Δdot1Δcho2Δ cells (Figure S5D). Most likely, the transcription of MET genes in cho2Δ mutants is repressed by a more elaborate SAM-dependent mechanism.
Histones serve as a “methyl sink” in the absence of PE methylation
Interestingly, the transcriptomes in WT and cho2Δ cells became very similar 3 hours after switch to SL (Figure 5A), whereas methylated histone amounts were quite distinct (Figure 4D). As such, this discrepancy suggests that methylation of H3K36 may have physiological functions beyond transcriptional regulation. To assess whether histone hypermethylation might be correlated with transcriptional changes, we performed chromatin immunoprecipitation to examine H3K36me3 occupancy along genes differentially expressed in WT and cho2Δ during the switch. We examined genes that were repressed (RPL33B and COX10) and genes that were induced (SHM2, SAM1, MET6, and MET17), but differentially expressed between WT and cho2Δ (Figure S7A–B). Overall, we did not observe obvious correlations between the abundance of the H3K36me3 mark and transcriptional changes. Yet, decreased expression of genes (MET6 and MET17) in cho2Δ mutants was correlated with decreased RNA polymerase II occupancy (Figure S7C). We further analyzed the correlation between a panel of histone modifications and mRNA transcript abundance across the yeast metabolic cycle, which we have previously profiled at high temporal resolution using RNA-seq and ChIP-seq (Cai et al., 2011; Kuang et al., 2014) mong five modifications associated with active genes, H3K36me3 exhibited the least correlation with mRNA transcript amounts (Figure S7D).
Because changes in bulk histone methylation amounts did not have sustainable effects on global gene expression, we reasoned that methylation of histones might become metabolically important for SAM homeostasis in the absence of PE methylation. If so, SAM levels should be further increased following inhibition of histone methylation. In the presence of PE methylation, histone methyltransferase mutants set1Δ and set2Δ, but not dot1Δ, only moderately increased cellular SAM levels to about 2- and 5-fold, compared to 25-fold increases in cho2Δ (Figure 6A). Deletion of SET1 or DOT1 in set2Δ mutants further increased SAM levels to about 4- and 8- fold (Figure 6A), suggesting that histone methylation contributes to maintaining cellular SAM levels.
Figure 6. Methylation of PE and histones are orchestrated to govern SAM homeostasis and to facilitate synthesis of cysteine from methionine.
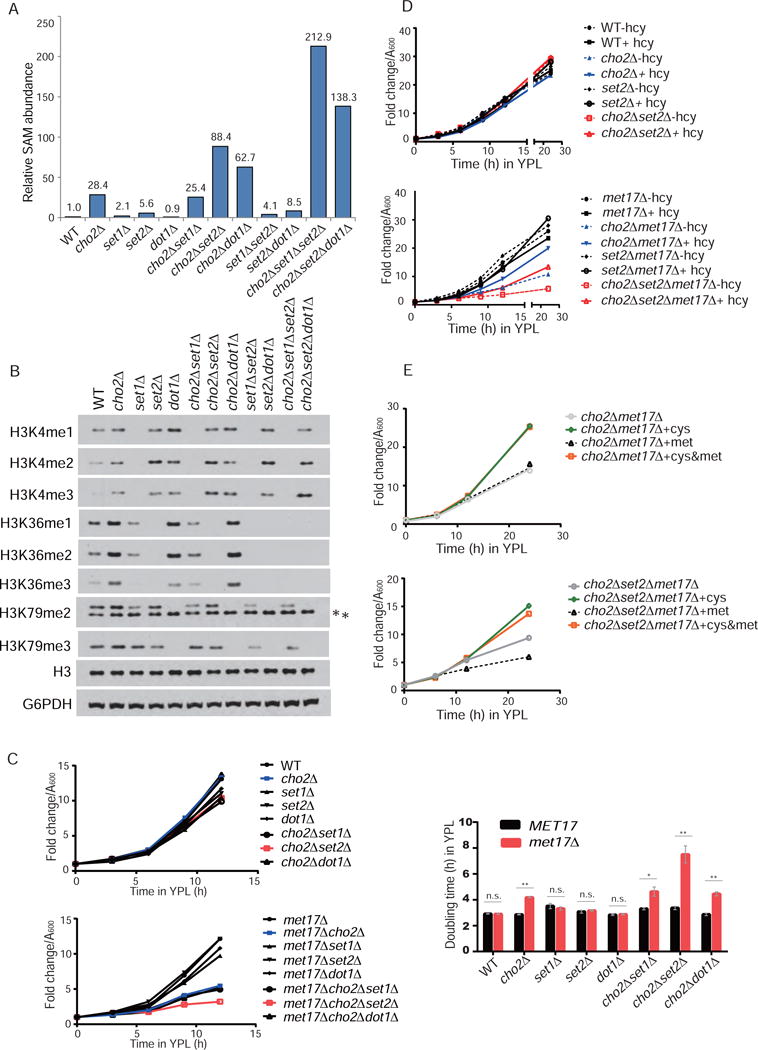
(A) Relative abundance of SAM in the indicated histone methyltransferase mutants, either alone or in cho2Δ, 1 h after switch to SL. The data are representative of two independent experiments.
(B) Levels of methylated H3 at specific lysine sites in indicated strains collected 1 h after the switch to SL. *indicates a non-specific band. The data are representative of at least three independent experiments. See also Figure S6.
(C) Representative growth curves and doubling times of the indicated strains in YPL. Note that deletion of MET17 selectively compromises growth of cho2Δ strains.
(D) Representative growth curves of the indicated strains in YPL with or without 1 mM homocysteine (hcy) supplementation.
(E) The effects of cysteine and methionine on the growth of cho2Δmet17Δ and cho2Δset2Δmet17Δ strains.
However, in cho2Δ cells, SAM levels became strikingly high when histone methylation was blocked by either deletion of SET2 or DOT1. SAM levels increased more than 100- and 200-fold when DOT1 and SET1 were further deleted in cho2Δset2Δ cells, respectively (Figure 6A). The elevated SAM levels in cho2Δset2Δ, cho2Δdot1Δ, and cho2Δset2Δdot1Δ cells led to further increases in levels of mono-, di-, and tri-methylated H3K4 (Figure 6B). Similarly, the cho2Δdot1Δ mutant exhibited increased tri-methylated H3K36 (Figure 6B). Likewise, H3K36A or H3K79A point mutants led to increased levels of mono-, di-, and tri-methylated H3K4, and H3K79A increased mono-, di-, and tri- methylated H3K36 in cho2Δ, respectively (Figure S6A). Therefore, methylation of histones is sensitive to SAM levels and the absence of methylation at a particular site can promote the hypermethylation of another in a compensatory-like manner. These data strongly suggest that in the absence of phospholipid methylation, the histones are then forced to play a more substantial role as a methyl sink to facilitate SAM homeostasis and turnover of SAM to other sulfur-containing metabolites. Our series of epistatic analyses suggest a general hierarchy: PE > H3K36 > H3K79 > H3K4 in terms of cellular preference for methyl sinks. Consistent with this idea, the precise roles of H3K36 and H3K79, and even H3K4 methylation in transcriptional regulation remain uncertain, leading to numerous other proposed functions for methylation at these sites (Howe et al., 2017; Nguyen and Zhang, 2011; Wagner and Carpenter, 2012)
Because SAM can be stored in vacuoles (Chan and Appling, 2003; Schlenk et al., 1970), we examined how disruption of two vacuolar proteins (Vtc1 and Vps33) that reportedly affect SAM homeostasis would affect SAM levels in cho2Δ cells. While deletion of VTC1 had little effect, deletion of VPS33 led to further accumulation of SAM in cho2Δ (Figures S7E). Therefore, Cho2-mediated PE methylation might coordinate with the vacuoles to control intracellular SAM levels.
Inhibition of phospholipid and histone methylation causes dependency on cysteine
Given these metabolic functions for the methylation of PE and histones, it is predictable that cell fitness might be compromised in their absence. However, no significant growth defect was observed when both the methylation of PE and histones were prevented (Figure 6C). A possible explanation is that yeast cells might rely on alternate pathways for cysteine and GSH synthesis, such as the sulfate assimilation pathway that converts sulfate to homocysteine to cysteine directly without the need for transsulfuration (Figure 2A). To test this possibility, we blocked sulfate assimilation to assess growth of these mutants in a met17Δ background. When transsulfuration becomes the sole route for synthesis of sulfur-containing metabolites, deletion of CHO2 led to decreased cell growth with a significant increase in the doubling time (Figure 6C). Strikingly, an additional deletion of SET2, but not SET1 or DOT1, further exacerbated the growth defect of cho2Δmet17Δ mutants with a ~2-fold increase in doubling time (Figure 6C). The growth defects of cho2Δmet17Δ and cho2Δset2Δmet17Δ strains were partially rescued by supplementation of homocysteine (Figure 6D). Moreover, cysteine, but not methionine, completely rescued the growth of these mutants (Figure 6E). Taken together, these findings strongly support an orchestrated metabolic function of PE and histone methylation in facilitating synthesis of cysteine from methionine, without which could lead to dependency on alternative sources of cysteine.
Competition between phospholipids and histones for methyl groups in facilitating synthesis of cysteine from methionine in mammalian cells
We next tested whether the role of phospholipids and histones as methyl sinks to facilitate the synthesis of cysteine from methionine through transsulfuration might be conserved in mammalian cells. Upon ectopic expression of mammalian PE methyltransferase PEMT in HeLa, HEK293T, and HepG2 cells in which no endogenous PEMT could be detected, we observed a marked reduction in the amounts of histone methylation at particular sites which included H3K36me3 and H3K79me3 (Figures 7A, 7C and S6B). Notably, these were the same sites that tended to be hypermethylated in the absence of Cho2p in yeast cells. Moreover, the addition of extra methionine resulted in an increase in amounts of H3K36me3 in cells without PEMT, but this increase was less apparent or absent in cells expressing PEMT (Figures 7A, 7C and S6B), Thus when PE methylation is active, cells become less dependent on histones as a methyl sink. We further observed increases in SAH, cystathionine, and cysteine in PEMT-expressing cell lines with or without additional methionine supplementation, which are hallmarks of increased transsulfuration (Figures 7B, 7D and S6C). Taken together, these data strongly suggest that in mammalian cells, phospholipid methylation also consumes substantial amounts of SAM and that cell types lacking PE methylation become reliant on histone methylation for SAM homeostasis and synthesis of sulfur metabolites.
Figure 7. Overexpression of the mammalian PE methyltransferase PEMT diminishes the methylation of H3K36 and H3K79 and promotes transsulfuration for cysteine synthesis.

(A) Levels of methylated H3 at specific lysine sites and (B) relative abundance of sulfur-containing metabolites in GFP control and PEMT-overexpressing 293T cells.
(C) Levels of methylated H3 at specific lysine sites and (D) relative abundance of sulfur-containing metabolites in GFP control and PEMT-overexpressing HeLa cells. See also Figure S7.
(E) Model depicting the metabolic function provided by the methylation of phospholipids and histones. Cell with PE methylation (top), cell lacking PE methylation (bottom).
DISCUSSION
In this study, we discovered an unforeseen connection between phospholipids and the epigenome, which is driven by the need to establish a proper metabolism of methyl groups. We demonstrated that methylation of the phospholipid PE is the major SAM-consuming methylation reaction which drives sulfur metabolism. Deficiency in this methylation process elevates the SAM/SAH ratio and gives rise to imbalanced cellular methylation potential, leading to hypermethylation of histones and a major protein phosphatase PP2A (Figure 7E). These aberrant methylation events are accompanied by global alterations in cellular metabolism and gene expression. Importantly, histone methylation acts as a compensatory mechanism in the absence of PE methylation to metabolize SAM. Since both phospholipids and histones are abundant cellular components, they have the capacity to transmute SAM in a timely and extensive manner.
Its function in sulfur metabolism may explain why PE methylation has persisted along with the choline pathway despite their functional redundancy in PC synthesis. In mammals, PE methylation is very active in the liver and responsible for ~30% of PC (Sundler and Akesson, 1975). The conventional function of PE methylation for PC synthesis in liver is critical, as substantial amounts of PC are required for hepatic secretion of lipoproteins and bile (Noga et al., 2002). The liver is also the major producer and exporter of glutathione, the synthesis of which is dependent on cysteine availability (Wu et al., 2004). Moreover, methionine alone is capable of supplying sufficient sulfur-containing metabolites and reducing power to mice lacking liver glutathione and thioredoxin reductases (Eriksson et al., 2015), and mice lacking PEMT exhibited a 50% reduction in plasma homocysteine levels (Noga et al., 2003). These considerations all indicate manifesting a high PE methylation activity to convert SAM towards cysteine and glutathione synthesis is likely critical for normal liver function.
However, the activity of the PE methylation pathway in other tissues is less than 1% of that in liver (Vance and Ridgway, 1988). Moreover, many higher eukaryotes beyond yeast do not have a sulfate assimilation pathway, so cysteine production is likely reliant on transsulfuration, especially when it is limiting in the diet or readily depleted for glutathione synthesis. Here, we demonstrate a metabolic function of histone methylation as a methyl sink when PE methylation is absent. Mammalian cell types lacking PE methylation may utilize histones to fulfill this metabolic function of absorbing methyl groups to facilitate the conversion of SAM to other sulfur-containing metabolites. In support of this idea, the correlation to transcription for some methylation sites such as H3K36 and H3K79, is not always clear (Nguyen and Zhang, 2011; Wagner and Carpenter, 2012). In the highly synchronized yeast metabolic cycle, H3K36me3 is the least correlated with transcription of the five “active” modifications surveyed, especially in terms of its timing relative to mRNA peaks (Figure S7D) (Kuang et al., 2014). These considerations are all consistent with our proposed metabolic function of histone methylation. H3K36 methylation appears especially important as a sink, as in the absence of PE methylation, loss of H3K36 methylation led to more accumulation of SAM and increased cysteine dependency compared to loss of methylation at H3K4 or H3K79. Blocking methylation at H3K79 also led to substantial increases in H3K36 methylation (Figure 6B and S6A). H3K36 methylation is also one of the more dynamic histone methylation marks (Mews et al., 2014), perhaps facilitation the utilization of this site as a sink.
Intriguingly, our findings may be relevant to the oncogenic H3K36M mutation that is found in almost all chondroblastomas (Fang et al., 2016; Lu et al., 2016). Inhibition of methylation at H3K36 in mammalian cells by any number of mechanisms led to the widespread, increased methylation at other sites, in particular, H3K27 (Lu et al., 2016). Therefore, the inability to utilize a preferred site (H3K36) as a methyl sink might necessitate the aberrant use of another to support SAM turnover and sulfur metabolism (Figure 6B and S6A), and resulting alterations to the transcriptome could contribute to tumorigenesis.
In closing, we have shown how phospholipid methylation plays a fundamental role in the regulation of SAM homeostasis, sulfur metabolism, and phosphorylation-based signal transduction. In cells without the capacity for phospholipid methylation (e.g., cho2Δ mutants or non-liver cell types), now the histones fulfill this metabolic function by serving as a sink for the methyl groups of SAM. Our findings highlight another example of a non-transcriptional function for a major histone modification. Just as the removal of acetyl groups from histones to produce acetate may have a metabolic or signaling function (Comerford et al., 2014; McBrian et al., 2013), here we show how the installation of methyl groups on histones has a fundamental metabolic function that might in some instances supersede a role in transcriptional regulation. The realization of histones as a methyl group sink may have important implications for our understanding of how dysregulation of epigenetic methylation modifications might be linked to disease, and further underscores the extensive interplay between small molecule metabolites and chromatin.
STAR METHODS
Detailed methods are provided in the online version of this paper and include the following:
KEY RESOURCES TABLE
-
CONTACT FOR REAGENT AND RESOURCE SHARING
As Lead Contact, Benjamin P. Tu is responsible for all reagent and resource requests. Further information and requests for reagents may be directed to and will be fulfilled by the corresponding author, Dr. Benjamin P. Tu (benjamin.tu@utsouthwestern.edu).
- EXPERIMENTAL MODEL AND SUBJECT DETAILS
-
◦Yeast strains and mediaAll yeast strains used in this study are listed in the Key Resources Table. All strains and genetic manipulations were verified by sequencing and phenotype. The prototrophic CEN.PK strain background was used in all experiments. Gene deletions were carried out using either tetrad dissection or standard PCR-based strategies to amplify resistance cassettes with appropriate flanking sequences, and replacing the target gene by homologous recombination (Longtine et al., 1998). Carboxy-terminal tags were similarly made with the PCR-based method PCR to amplify resistance cassettes with flanking sequences. Histone point mutants were provided by Zheng Kuang and Jef Boeke (Kuang et al., 2014).Media used in this study: YPL (1% yeast extract, 2% peptone and 2% lactate); SL (0.17% yeast nitrogen base without amino acids containing 0.5% ammonium sulfate (Difco), 2% lactate); YPD (1% yeast extract, 2% peptone and 2% glucose); and SD (0.17% yeast nitrogen base without amino acids and ammonium sulfate, 0.5% ammonium sulfate, 2% glucose). SL medium used in inositol-related experiments is inositol-free, and the composition is the same as the SL described above except that nitrogen base was replaced by YNB-inositol (Sunrise Science).
-
◦Cell lines and cell cultureAll the mammalian cells used in this study are listed in the Key Resources Table and were cultured in a regular medium containing DMEM with 5% fetal bovine serum. For methionine starvation experiments, we used a methionine restriction medium containing a methionine and cysteine-free DMEM supplemented with 3 μM methionine, 1× glutamax, and 5% fetal bovine serum. To compare methionine starvation effect, cells cultured in regular medium were washed twice with PBS and replenished with the methionine restriction medium with or without addition of methionine for indicated times.
-
◦
- METHOD DETAILS
-
◦Screening methyltransferase mutants for SAM excretionThe SAM auxotroph sam1Δsam2Δ was propagated overnight in liquid YPD (yeast extract peptone dextrose) medium containing 300 μM SAM. Cells equivalent to one OD600 unit were spread onto a YPD plate. Individual methyltransferase mutants were patched onto the plate and then incubated at 30°C for about 7 days.
-
◦Spotting assayCells were pre-cultured in YPL overnight to stationary phase, and 3 μL aliquots of a series of 10-fold dilutions from 0.5 unit of OD600 were spotted onto YPL plates and incubated for 2 days at 30°C.
-
◦Metabolite extraction and quantitationIntracellular metabolites were extracted from yeast and mammalian cell lines using a previous established method (Dutchak et al., 2015; Tu et al., 2007). Care was taken to quench cells quickly and maintain metabolites in acid to minimize oxidation. SAM, SAH, and other cellular metabolites were quantitated by LC-MS/MS with a triple quadrupole mass spectrometer (3200 QTRAP, ABSCIEX) using previously established methods (Tu et al., 2007). Serially diluted standards of SAM and SAH were repeatedly run to ensure their quantitation was within the linear range. Absolute intracellular concentrations of sulfur metabolites including SAM and SAH under these growth conditions were estimated previously (Laxman et al., 2013).
-
◦Determination of Yeast PhospholipidsThin-layer chromatography was used to determine yeast phospholipids as described previously (Vaden et al., 2005; Ye et al., 2013). In brief, yeast phospholipids were extracted with chloroform/methanol (2:1) (v/v), separated on TLC silica gel 60 plates in a one-dimension solvent system, and visualized by iodine staining after carbonization.
-
◦Whole yeast cell extracts preparationUrea and trichloroacetic acid (TCA)-based protocols were used to lyse yeast cells for Western blots. For the urea-based protocol, cells were quenched in 10% TCA for 20 minutes, spun down, washed with acetone. Cell pellets were resuspended in urea buffer containing 50 mM Tris-Cl pH 7.5, 5 mM EDTA, 6 M urea, 1% SDS, 1 mM PMSF, 2 mM sodium orthovanadate, and 50 mM NaF, and lysed by bead beating. For the TCA-based protocol, cells were quickly spun down, washed with 20% TCA, and then flash frozen in liquid nitrogen. The frozen pellet was resuspended in 20% TCA and lysed by bead beating. Lysate and precipitate/debris was mixed with 1 ml 5% TCA and pelleted. The pellet was washed with 0.75 ml 100% cold ethanol and resuspended in 150 μl loading buffer (50 μl 1 M Tris-Cl pH 8.0, 92.5 μl 3X SDS sample buffer and 7.5 μl 100% β-mercaptoethanol) and boiled for 5 min. After collecting supernatants, protein concentration was determined using Pierce BCA protein assay, and the same amount of proteins was separated using NuPAGE Bis-Tris gels.
-
◦Yeast histone Western blotsDetection of each histone modification was performed on a separate gel using freshly prepared antibody. We have used both protocols described above to prepare cell lysates for bulk histone detection, and reproducible results were obtained from both protocols.
-
◦Mammalian histone Western blotsMammalian cells were lysed using Triton Extraction Buffer (TEB buffer containing 1× PBS, 0.5% Triton × 100 (v/v), 2 mM phenylmethylsulfonyl fluroride, 0.02% sodium azide (w/v)). The pellets were collected for histone extraction in 0.2 N hydrogen chloride overnight at 4°C, and the supernatants were used to detect PEMT protein levels. Protein concentrations of both fractions were determined using the Bradford assay. Detecting each histone modification was performed on a separate gel using freshly prepared antibody.
-
◦PP2A Methylation Western blotsTwo identical sets of cell lysates were separated in one NuPAGE Bis-Tris Gel and transferred to a PVDF membrane. After blocking, one set was blotted with the antibody detecting unmethylated PP2A, and the other set was treated with 200 mM sodium hydroxide for 10 minutes to demethylate PP2A before blotting with the same antibody. After incubation with the PP2A antibody, two blots were washed, incubated with secondary antibody for chemiluminescence detection.
-
◦Construction of PEMT overexpression cell linesThe coding sequence of PEMT was amplified from a clone obtained from the Ultimate™ ORF Lite human cDNA collection, and was subsequently cloned into pLVX-IRES-ZsGreen1 using the XhoI and XbaI sites. The constructed PEMT overexpression vector was confirmed by sequencing. The PEMT overexpression and GFP control vectors were then packaged into lentiviral particles in HEK293T cells with the packaging plasmid (pCMV-dR8.91) and the envelope plasmid (a VSV-G expressing plasmid, pMD2.G). After 48 h incubation, the viruses were harvested for transducing desired cell lines. The transduction efficiency was monitored by GFP expression under a fluorescence microscope. Early passages of transduced cell lines were used for experiments.
-
◦Assaying cell viability in hydrogen peroxideCells logarithmically grown in YPL were washed once with SL and resuspended to SL or SL containing 1 mM methionine after OD600 = 1 was reached. A half hour after the switch, an aliquot of untreated control cells were taken, diluted, and spread onto YPD plates. 5 mM H2O2 was added thereafter, and another aliquot of cells was similarly spread onto YPD plates after 6 h incubation. The viability was calculated as the ratio of the numbers of single colonies formed from the cultures after and before the H2O2 treatment.
-
◦Visualizing Opi1-GFP translocation using fluorescence microscopyAll Images were taken under a 100× oil-immersion objective lens with a Deltavision DVRT microscope. Cells grown under indicated conditions were visualized after directly mounted under a coverslip.
-
◦RNA Extraction and Real Time Quantitative PCR (RT-qPCR) AnalysisRNA isolation of five OD600 units of cells under different growth conditions was carried out following the manufacturer’s manual using MasterPure yeast RNA purification kit (epicentre). RNA concentration was determined by A260. 1 μg RNA was reverse transcribed to cDNA using Superscript III Reverse Transcriptase from Invitrogen. Real-time PCR was performed in triplicate with iQ SYBR Green Supermix from BioRad. Transcripts levels of genes were normalized to ACT1. All the primers used in RT-qPCR have efficiency close to 100%, and their sequences are listed in Table S6.
-
◦RNA-seqRNA samples were prepared in two biological replicates as described above. Library construction and sequencing were performed by the UTSW Next Generation Sequencing Core Facility, and detailed procedures can be found from the following website: http://www.utsouthwestern.edu/labs/next-generation-sequencing-core/applications/mrna-seq.html.
-
◦
- QUANTIFICATION AND STATISTICAL ANALYSIS
-
◦RNA-seq data analysis50 bp single-end reads were mapped using Bowtie against yeast genome SacCer2 (bowtie -5 3 -3 5 -p 12 –best ./index/saccer2). The number of reads overlapping yeast genes was calculated in R using the countOverlaps function from the GenomicRanges package. Numerical data are presented in Tables S4–S5. Differential expression was analyzed by DESeq and volcano plots were generated in R.
-
◦Hierarchical clustering and heat mapsThe normalized abundances of metabolites or mRNA transcripts were log2-transformed, centered about the mean, and clustered by Spearman rank correlation with Cluster software (de Hoon et al., 2004) for hierarchical clustering analysis, and the data were visualized as heat maps with Java TreeView (Saldanha, 2004).
-
◦Statistical analysisThe statistical significance in related figures was assessed using the Student’s t test. p values and n in column plots from Student’s t test were specified in corresponding figure legend.
-
◦
-
DATA AND SOFTWARE AVAILABILITY
The RNA sequencing data have been deposited at GEO with accession number: GSE84059.
Supplementary Material
Highlights.
Phospholipid methylation is the major consumer of SAM
Phospholipid methylation enables conversion of SAM to other sulfur metabolites
Lack of phospholipid methylation causes hypermethylation of histones and PP2A
Histones are methyl sinks in the absence of phospholipid methylation
Acknowledgments
This research was supported by grants from the NIH (R01GM094314) and the Welch Foundation (I-1797), and a fellowship from the David and Lucile Packard Foundation.
Footnotes
Publisher's Disclaimer: This is a PDF file of an unedited manuscript that has been accepted for publication. As a service to our customers we are providing this early version of the manuscript. The manuscript will undergo copyediting, typesetting, and review of the resulting proof before it is published in its final citable form. Please note that during the production process errors may be discovered which could affect the content, and all legal disclaimers that apply to the journal pertain.
AUTHOR CONTRIBUTIONS
C.Y. and B.P.T. conceived this study. C.Y. performed all experiments. B.S. made the initial observation that SAM levels were elevated in cho2Δ mutants and assisted with strain construction, Western blots, cell viability, and ChIP assays. Y.W. constructed PEMT overexpression mammalian cell lines and assisted with mammalian experiments. Z.K. analyzed RNA-seq and ChIP-seq data and provided histone point mutants. C.Y. and B.P.T. wrote the manuscript.
SUPPLEMENTAL INFORMATION
Supplemental information includes seven figures and six tables.
References
- Bremer J, Greenberg DM. Methyl transfering enzyme system of microsomes in the biosynthesis of lecithin (phosphatidylcholine) Biochimica et biophysica acta. 1961;46:205–216. [Google Scholar]
- Broach JR. Nutritional control of growth and development in yeast. Genetics. 2012;192:73–105. doi: 10.1534/genetics.111.135731. [DOI] [PMC free article] [PubMed] [Google Scholar]
- Brosnan JT, Brosnan ME. The sulfur-containing amino acids: an overview. The Journal of nutrition. 2006;136:1636S–1640S. doi: 10.1093/jn/136.6.1636S. [DOI] [PubMed] [Google Scholar]
- Cai L, Sutter BM, Li B, Tu BP. Acetyl-CoA induces cell growth and proliferation by promoting the acetylation of histones at growth genes. Molecular cell. 2011;42:426–437. doi: 10.1016/j.molcel.2011.05.004. [DOI] [PMC free article] [PubMed] [Google Scholar]
- Cai L, Tu BP. Driving the cell cycle through metabolism. Annual review of cell and developmental biology. 2012;28:59–87. doi: 10.1146/annurev-cellbio-092910-154010. [DOI] [PubMed] [Google Scholar]
- Carman GM, Han GS. Regulation of phospholipid synthesis in the yeast Saccharomyces cerevisiae. Annu Rev Biochem. 2011;80:859–883. doi: 10.1146/annurev-biochem-060409-092229. [DOI] [PMC free article] [PubMed] [Google Scholar]
- Chan SY, Appling DR. Regulation of S-adenosylmethionine levels in Saccharomyces cerevisiae. The Journal of biological chemistry. 2003;278:43051–43059. doi: 10.1074/jbc.M308696200. [DOI] [PubMed] [Google Scholar]
- Cherest H, Surdin-Kerjan Y, Antoniewski J, de Robichon-Szulmajster H. Effects of regulatory mutations upon methionine biosynthesis in Saccharomyces cerevisiae: loci eth2-eth3-eth10. Journal of bacteriology. 1973;115:1084–1093. doi: 10.1128/jb.115.3.1084-1093.1973. [DOI] [PMC free article] [PubMed] [Google Scholar]
- Comerford SA, Huang Z, Du X, Wang Y, Cai L, Witkiewicz AK, Walters H, Tantawy MN, Fu A, Manning HC, et al. Acetate dependence of tumors. Cell. 2014;159:1591–1602. doi: 10.1016/j.cell.2014.11.020. [DOI] [PMC free article] [PubMed] [Google Scholar]
- de Hoon MJ, Imoto S, Nolan J, Miyano S. Open source clustering software. Bioinformatics. 2004;20:1453–1454. doi: 10.1093/bioinformatics/bth078. [DOI] [PubMed] [Google Scholar]
- Dutchak PA, Laxman S, Estill SJ, Wang C, Wang Y, Wang Y, Bulut GB, Gao J, Huang LJ, Tu BP. Regulation of Hematopoiesis and Methionine Homeostasis by mTORC1 Inhibitor NPRL2. Cell reports. 2015;12:371–379. doi: 10.1016/j.celrep.2015.06.042. [DOI] [PMC free article] [PubMed] [Google Scholar]
- Eriksson S, Prigge JR, Talago EA, Arner ES, Schmidt EE. Dietary methionine can sustain cytosolic redox homeostasis in the mouse liver. Nature communications. 2015;6:6479. doi: 10.1038/ncomms7479. [DOI] [PMC free article] [PubMed] [Google Scholar]
- Fang D, Gan H, Lee JH, Han J, Wang Z, Riester SM, Jin L, Chen J, Zhou H, Wang J, et al. The histone H3.3K36M mutation reprograms the epigenome of chondroblastomas. Science. 2016;352:1344–1348. doi: 10.1126/science.aae0065. [DOI] [PMC free article] [PubMed] [Google Scholar]
- Henry SA, Kohlwein SD, Carman GM. Metabolism and regulation of glycerolipids in the yeast Saccharomyces cerevisiae. Genetics. 2012;190:317–349. doi: 10.1534/genetics.111.130286. [DOI] [PMC free article] [PubMed] [Google Scholar]
- Hickman MJ, Petti AA, Ho-Shing O, Silverman SJ, McIsaac RS, Lee TA, Botstein D. Coordinated regulation of sulfur and phospholipid metabolism reflects the importance of methylation in the growth of yeast. Molecular biology of the cell. 2011;22:4192–4204. doi: 10.1091/mbc.E11-05-0467. [DOI] [PMC free article] [PubMed] [Google Scholar]
- Hinnebusch AG. Translational regulation of GCN4 and the general amino acid control of yeast. Annual review of microbiology. 2005;59:407–450. doi: 10.1146/annurev.micro.59.031805.133833. [DOI] [PubMed] [Google Scholar]
- Howe FS, Fischl H, Murray SC, Mellor J. Is H3K4me3 instructive for transcription activation? Bioessays. 2017;39:1–12. doi: 10.1002/bies.201600095. [DOI] [PubMed] [Google Scholar]
- Kennedy EP, Weiss SB. The function of cytidine coenzymes in the biosynthesis of phospholipides. The Journal of biological chemistry. 1956;222:193–214. [PubMed] [Google Scholar]
- Kuang Z, Cai L, Zhang X, Ji H, Tu BP, Boeke JD. High-temporal-resolution view of transcription and chromatin states across distinct metabolic states in budding yeast. Nature structural & molecular biology. 2014;21:854–863. doi: 10.1038/nsmb.2881. [DOI] [PMC free article] [PubMed] [Google Scholar]
- Laxman S, Sutter BM, Wu X, Kumar S, Guo X, Trudgian DC, Mirzaei H, Tu BP. Sulfur amino acids regulate translational capacity and metabolic homeostasis through modulation of tRNA thiolation. Cell. 2013;154:416–429. doi: 10.1016/j.cell.2013.06.043. [DOI] [PMC free article] [PubMed] [Google Scholar]
- Longtine MS, McKenzie A, 3rd, Demarini DJ, Shah NG, Wach A, Brachat A, Philippsen P, Pringle JR. Additional modules for versatile and economical PCR-based gene deletion and modification in Saccharomyces cerevisiae. Yeast. 1998;14:953–961. doi: 10.1002/(SICI)1097-0061(199807)14:10<953::AID-YEA293>3.0.CO;2-U. [DOI] [PubMed] [Google Scholar]
- Lu C, Jain SU, Hoelper D, Bechet D, Molden RC, Ran L, Murphy D, Venneti S, Hameed M, Pawel BR, et al. Histone H3K36 mutations promote sarcomagenesis through altered histone methylation landscape. Science. 2016;352:844–849. doi: 10.1126/science.aac7272. [DOI] [PMC free article] [PubMed] [Google Scholar]
- Malanovic N, Streith I, Wolinski H, Rechberger G, Kohlwein SD, Tehlivets O. S-adenosyl-L-homocysteine hydrolase, key enzyme of methylation metabolism, regulates phosphatidylcholine synthesis and triacylglycerol homeostasis in yeast: implications for homocysteine as a risk factor of atherosclerosis. The Journal of biological chemistry. 2008;283:23989–23999. doi: 10.1074/jbc.M800830200. [DOI] [PMC free article] [PubMed] [Google Scholar]
- McBrian MA, Behbahan IS, Ferrari R, Su T, Huang TW, Li K, Hong CS, Christofk HR, Vogelauer M, Seligson DB, et al. Histone acetylation regulates intracellular pH. Molecular cell. 2013;49:310–321. doi: 10.1016/j.molcel.2012.10.025. [DOI] [PMC free article] [PubMed] [Google Scholar]
- Mews P, Zee BM, Liu S, Donahue G, Garcia BA, Berger SL. Histone methylation has dynamics distinct from those of histone acetylation in cell cycle reentry from quiescence. Mol Cell Biol. 2014;34:3968–3980. doi: 10.1128/MCB.00763-14. [DOI] [PMC free article] [PubMed] [Google Scholar]
- Nguyen AT, Zhang Y. The diverse functions of Dot1 and H3K79 methylation. Genes & development. 2011;25:1345–1358. doi: 10.1101/gad.2057811. [DOI] [PMC free article] [PubMed] [Google Scholar]
- Noga AA, Stead LM, Zhao Y, Brosnan ME, Brosnan JT, Vance DE. Plasma homocysteine is regulated by phospholipid methylation. The Journal of biological chemistry. 2003;278:5952–5955. doi: 10.1074/jbc.M212194200. [DOI] [PubMed] [Google Scholar]
- Noga AA, Zhao Y, Vance DE. An unexpected requirement for phosphatidylethanolamine N-methyltransferase in the secretion of very low density lipoproteins. The Journal of biological chemistry. 2002;277:42358–42365. doi: 10.1074/jbc.M204542200. [DOI] [PubMed] [Google Scholar]
- Sadhu MJ, Moresco JJ, Zimmer AD, Yates JR, 3rd, Rine J. Multiple inputs control sulfur-containing amino acid synthesis in Saccharomyces cerevisiae. Molecular biology of the cell. 2014;25:1653–1665. doi: 10.1091/mbc.E13-12-0755. [DOI] [PMC free article] [PubMed] [Google Scholar]
- Saldanha AJ. Java Treeview–extensible visualization of microarray data. Bioinformatics. 2004;20:3246–3248. doi: 10.1093/bioinformatics/bth349. [DOI] [PubMed] [Google Scholar]
- Schlenk F, Dainko JL, Svihla G. The accumulation and intracellular distribution of biological sulfoninum compounds in yeast. Arch Biochem Biophys. 1970;140:228–236. doi: 10.1016/0003-9861(70)90027-5. [DOI] [PubMed] [Google Scholar]
- Shi L, Tu BP. Acetyl-CoA induces transcription of the key G1 cyclin CLN3 to promote entry into the cell division cycle in Saccharomyces cerevisiae. Proceedings of the National Academy of Sciences of the United States of America. 2013;110:7318–7323. doi: 10.1073/pnas.1302490110. [DOI] [PMC free article] [PubMed] [Google Scholar]
- Stanevich V, Jiang L, Satyshur KA, Li Y, Jeffrey PD, Li Z, Menden P, Semmelhack MF, Xing Y. The structural basis for tight control of PP2A methylation and function by LCMT-1. Molecular cell. 2011;41:331–342. doi: 10.1016/j.molcel.2010.12.030. [DOI] [PMC free article] [PubMed] [Google Scholar]
- Stipanuk MH. Sulfur amino acid metabolism: pathways for production and removal of homocysteine and cysteine. Annual review of nutrition. 2004;24:539–577. doi: 10.1146/annurev.nutr.24.012003.132418. [DOI] [PubMed] [Google Scholar]
- Sundler R, Akesson B. Regulation of phospholipid biosynthesis in isolated rat hepatocytes. Effect of different substrates. The Journal of biological chemistry. 1975;250:3359–3367. [PubMed] [Google Scholar]
- Sutter BM, Wu X, Laxman S, Tu BP. Methionine inhibits autophagy and promotes growth by inducing the SAM-responsive methylation of PP2A. Cell. 2013;154:403–415. doi: 10.1016/j.cell.2013.06.041. [DOI] [PMC free article] [PubMed] [Google Scholar]
- Tolstykh T, Lee J, Vafai S, Stock JB. Carboxyl methylation regulates phosphoprotein phosphatase 2A by controlling the association of regulatory B subunits. The EMBO journal. 2000;19:5682–5691. doi: 10.1093/emboj/19.21.5682. [DOI] [PMC free article] [PubMed] [Google Scholar]
- Tu BP, Mohler RE, Liu JC, Dombek KM, Young ET, Synovec RE, McKnight SL. Cyclic changes in metabolic state during the life of a yeast cell. Proceedings of the National Academy of Sciences of the United States of America. 2007;104:16886–16891. doi: 10.1073/pnas.0708365104. [DOI] [PMC free article] [PubMed] [Google Scholar]
- Ueland P. Pharmacological and biochemical aspects of S-adenosylhomocysteine and S-adenosylhomocysteine hydrolase. Pharmacol Rev. 1982;34:223–253. [PubMed] [Google Scholar]
- Vaden DL, Gohil VM, Gu Z, Greenberg ML. Separation of yeast phospholipids using one-dimensional thin-layer chromatography. Analytical biochemistry. 2005;338:162–164. doi: 10.1016/j.ab.2004.11.020. [DOI] [PubMed] [Google Scholar]
- van Meer G, Voelker DR, Feigenson GW. Membrane lipids: where they are and how they behave. Nature reviews Molecular cell biology. 2008;9:112–124. doi: 10.1038/nrm2330. [DOI] [PMC free article] [PubMed] [Google Scholar]
- Vance DE. Phospholipid methylation in mammals: from biochemistry to physiological function. Biochimica et biophysica acta. 2014;1838:1477–1487. doi: 10.1016/j.bbamem.2013.10.018. [DOI] [PubMed] [Google Scholar]
- Vance DE, Ridgway ND. The methylation of phosphatidylethanolamine. Prog Lipid Res. 1988;27:61–79. doi: 10.1016/0163-7827(88)90005-7. [DOI] [PubMed] [Google Scholar]
- Wagner EJ, Carpenter PB. Understanding the language of Lys36 methylation at histone H3. Nature reviews Molecular cell biology. 2012;13:115–126. doi: 10.1038/nrm3274. [DOI] [PMC free article] [PubMed] [Google Scholar]
- Wei H, Ashby DG, Moreno CS, Ogris E, Yeong FM, Corbett AH, Pallas DC. Carboxymethylation of the PP2A catalytic subunit in Saccharomyces cerevisiae is required for efficient interaction with the B-type subunits Cdc55p and Rts1p. The Journal of biological chemistry. 2001;276:1570–1577. doi: 10.1074/jbc.M008694200. [DOI] [PMC free article] [PubMed] [Google Scholar]
- Wu G, Fang YZ, Yang S, Lupton JR, Turner ND. Glutathione metabolism and its implications for health. The Journal of nutrition. 2004;134:489–492. doi: 10.1093/jn/134.3.489. [DOI] [PubMed] [Google Scholar]
- Wu X, Tu BP. Selective regulation of autophagy by the Iml1-Npr2-Npr3 complex in the absence of nitrogen starvation. Molecular biology of the cell. 2011;22:4124–4133. doi: 10.1091/mbc.E11-06-0525. [DOI] [PMC free article] [PubMed] [Google Scholar]
- Ye C, Bandara WM, Greenberg ML. Regulation of inositol metabolism is fine-tuned by inositol pyrophosphates in Saccharomyces cerevisiae. The Journal of biological chemistry. 2013;288:24898–24908. doi: 10.1074/jbc.M113.493353. [DOI] [PMC free article] [PubMed] [Google Scholar]
- Zinser E, Sperka-Gottlieb C, Fasch EV, Kohlwein SD, Paltauf F, Daum G. Phospholipid synthesis and lipid composition of subcellular membranes in the unicellular eukaryote Saccharomyces cerevisiae. Journal of bacteriology. 1991;173:2026–2034. doi: 10.1128/jb.173.6.2026-2034.1991. [DOI] [PMC free article] [PubMed] [Google Scholar]
Associated Data
This section collects any data citations, data availability statements, or supplementary materials included in this article.