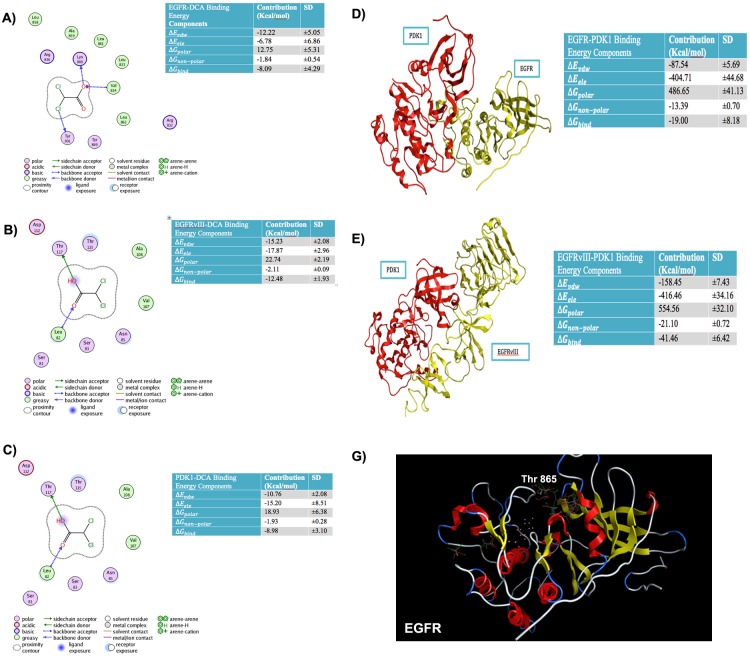
Figure 2. Binding energies and Protein Ligand Interaction fingerprint (PLIF) diagrams.
A. Binding Energies and Protein Ligand Interaction fingerprint (PLIF) diagrams showing atoms of DCA interacting with residues of A. EGFR B. EGFRvIII C. PDK1. Binding energies and structure of best pose for D. PDK1-EGFR complex E. PDK1-EGFRvIII complex. F. Top conformations of DCA docked in site close to TYR869 in case of wild type EGFR whereas this site does not anchor DCA conformations if TYR869 is mutated to Phenylalanine.

