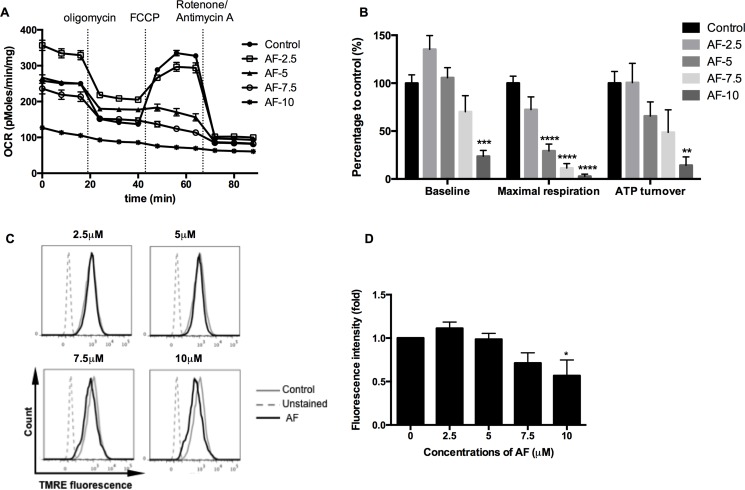
Figure 5. AF induced mitochondrial dysfunction in tumor cells.
4T1 cells were treated with AF for 2 h at indicated concentrations and the respiratory profiles were examined by a Seahorse Analyzer. (A) Dissection of respiratory rates by the sequential injection of oligomycin, FCCP, rotenone and antimycin A at indicated time points. (B) Summarized data on the baseline respiratory rate, maximum respiratory capacity and ATP turnover. Data are shown as mean ± SD (n = 5). (C–D) Representative measurements of ΔΨm in 4T1 cells by flow cytometry and summarized data on membrane potential. Data are shown as mean ± SD (n = 3). One-way ANOVA with Bonferonni's multiple comparison test was used to calculate statistics: *p < 0.05, **p < 0.01, ***p < 0.001, ****p < 0.0001.

