Abstract
Psychophysical recovery from forward masking was measured in adult cochlear implant users of CochlearTM and Advanced BionicsTM devices, in monopolar and in focused (bipolar and tripolar) stimulation modes, at four electrode sites across the arrays, and at two levels (loudness balanced across modes and electrodes). Results indicated a steeper psychophysical recovery from forward masking in monopolar over bipolar and tripolar modes, modified by differential effects of electrode and level. The interactions between factors varied somewhat across devices. It is speculated that psychophysical recovery from forward masking may be driven by different populations of neurons in the different modes, with a broader stimulation pattern resulting in a greater likelihood of response by healthier and/or faster-recovering neurons within the stimulated population. If a more rapid recovery from prior stimulation reflects responses of neurons not necessarily close to the activating site, the spectral pattern of the incoming acoustic signal may be distorted. These results have implications for speech processor implementations using different degrees of focusing of the electric field. The primary differences in the shape of the recovery function were observed in the earlier portion (between 2 and 45 ms) of recovery, which is significant in terms of the speech envelope.
I. INTRODUCTION
Rapid recovery from prior stimuli is important for the auditory system to meet the challenge of continually streaming sequences of sounds, sometimes arriving in quick succession at the ear, as with speech and other sounds in the everyday auditory environment. Mechanisms underlying such recovery in listeners with cochlear implants (CIs) are not as yet fully understood. Previous work indicated that in electrical stimulation, recovery from forward masking proceeds along a time course generally similar to that observed in normally hearing listeners, after accounting for differences in dynamic range (Shannon, 1990). Chatterjee (1999) reported a dual time-constant recovery process in CI patients, later also reported in cortical neuronal responses in the guinea pig (Kirby and Middlebrooks, 2010). Some of the early psychophysical studies in humans were conducted with older devices, small sample sizes, and different stimulation modes. It remains unknown to what extent changes in the stimulation mode might influence the shape of the recovery function in present-day CIs. Stimulation mode controls the shape of the electric field (Kral et al., 1998), the neural excitation pattern (Bierer and Middlebrooks, 2002; Bierer et al., 2010; Srinivasan et al., 2012; Zhu et al., 2012), and possibly the site of excitation along the neuron (Cartee, 2006). A more focused field, stimulating smaller groups of neurons, might result in a different psychophysical recovery function than a broader field. Brown et al. (1996) reported slightly steeper refractory recovery in electrically evoked compound action potential (ECAP) measures in monopolar mode than in bipolar mode. They also reported correspondences between the physiological ECAP recovery and the early portion of psychophysical recovery in the same patients. Thus, if mode-based differences are to be observed in psychophysical recovery, they may be more evident in the rapid part of the recovery function, which likely reflects peripheral processes. It is to be noted that the 1996 study of Brown et al. reported on single-pulse maskers and probes, and that the findings are likely to be further modified by temporal integration, per- and post-stimulus adaptation, facilitation, and accommodation effects when pulse train stimuli are involved.
Neural health is one factor to consider in examining recovery functions. Chatterjee (1999) reported that patients with faster recovery time constants had poorer speech perception than the patients with slower time constants. Nelson and Donaldson (2002) tested a larger sample of CI patients and reported a more complex relation between speech perception outcomes and recovery from forward masking, with strong inter-subject variability. Chatterjee (1999) showed a possible link between the more rapid recovery in the poorer-performing CI users in her study to a lack of temporal integration of the masker. Thus, different mechanisms may contribute to recovery time constants in CI patients, with temporal integration interacting with recovery processes to determine the peripheral contribution to the recovery time constant. Ramekers et al. (2015) also reported a link between slower recovery from forward masking and greater nerve survival in animal studies. In a recent study with humans, Zhou and Pfingst (2016) have drawn links between recovery from forward masking and multipulse integration at threshold as correlated indicators of neural health. They fit their recovery data with a two-time-constant exponential function, as in Chatterjee (1999). The rapid recovery time constant was related to the multipulse integration measure, with faster recovery being correlated with greater multipulse integration, but not with the slower time constant. Zhou and Pfingst (2016) concluded that multipulse integration, a measure of nerve survival in animal models (Kang et al., 2010; Pfingst et al., 2011), is related to peripheral aspects of temporal processing (i.e., the rapid recovery time constant). Taken together, these studies suggest that multiple factors, both peripheral and central, contribute to psychophysical measures of recovery from forward masking in CI patients, and the differences between some of the outcomes underscore the need for further investigation.
Differences in populations of responsive neurons may translate to differences in sensitivity to factors such as masker level and electrode location, depending on the neural health, site of excitation, etc. In monopolar stimulation, detection of the probe at a particular probe delay might occur at any neural site that is most responsive to stimulation within the broad region of neural excitation in the cochlea. Thus, the measured psychophysical recovery function may not reflect the recovery of a single region close to the stimulation site, but rather, might track the recovery of remote neurons that have recovered from the masker. At any given probe delay, the probability that some proportion of the stimulated neurons will be responsive to the probe is likely to be higher when the excitation pattern is broader than when it is more focused. Neurons at the edge of the excitation pattern would be excited less by the masker than neurons near the activation site itself: thus, they may even contribute more to probe detection during the recovery process under the right circumstances. Thus, psychophysical recovery might be more rapid in monopolar mode than in more focused stimulation modes, where the edges of the excitation pattern are closer to the activation site than in monopolar mode. Further, mechanisms of recovery and response might depend on the size of the neural population synchronously stimulated in the different modes. If we could measure recovery physiologically at the site of excitation itself, the measured function might be quite different than that measured psychophysically. However, functionally speaking, the psychophysically measured recovery function is more relevant to patients' hearing with their device, and therefore warrants investigation.
In CI patients, psychophysical sensitivity to temporal changes in the stimulus is often strongly level-dependent (Chatterjee and Robert, 2001; Chatterjee and Yu, 2010) as well as electrode-site-dependent (Garadat et al., 2012; Pfingst et al., 2008; Garadat and Pfingst, 2011). As speech perception requires the listener to attend to changes in stimulation patterns across multiple electrode sites and levels, it is important to quantify CI patients' psychophysical sensitivity at more than one electrode location and level. The objective of the present study was to investigate the dependence, if any, of recovery from forward masking on stimulation mode, and to examine its dependence on masker level and electrode location. Maskers were loudness-balanced across stimulation modes at two levels, corresponding to 40% and 70% of the dynamic range on the reference electrode, respectively. A question of interest related to whether the absolute current levels, which increased from monopolar to focused stimulation modes, played a role in any stimulation-mode-based differences in recovery rates. Using a higher and lower level within each mode served an additional purpose of providing a partial answer to this question. It is possible, however, that the need for higher current levels in more focused modes partially negated mode-based differences by reducing differences in the overall width of the electric field. However, work by Srinivasan et al. (2012) has shown that even at such loudness-balanced levels, focused stimulation results in narrower forward-masked excitation patterns than monopolar stimulation. Loudness-balancing the maskers also ensured greater clinical relevance of the measurements.
The participants in this study used a variety of electrode array types, but all were relatively modern devices. The literature suggests that factors that depend in part on the electrode array, such as insertion depth, insertion trauma, proximity to the spiral ganglion neurons, should be improved in the more modern systems (e.g., Nucleus Contour Advance or Advanced Bionics HiFocus family of electrodes) than in the older systems, but there is high variability across temporal bones/cochleae even when the same individual performs the insertions (e.g., Rebscher et al., 2008). Insertion trauma and distance from spiral ganglion neurons might be the more important factors in determining recovery from forward masking in our study. However, considering that our participants had varying etiologies of hearing loss and durations of deafness, and were implanted by different surgeons, as well as our small sample size, it is not likely that electrode array type can be considered a predictor in the present study.
The recovery function was sampled at five time points, corresponding to probe onset delays of approximately 2, 4, 8, 45, and 128 ms after the masker was turned off. There is a possibility that confusion effects contribute to the results at the earliest delays: that is, the listener is unable to hear the temporal gap between the masker and probe, and cannot tell when the masker ends and the probe begins. In these situations, the listener may also use a perceived elongation of the masker in the probe-present interval over the probe-absent interval, to perform the task. If this is the case, then significant differences in the shape of the function should be observed between probe delays 2 and 8 ms between low and high levels of stimulation (i.e., an interaction between delay and level) because gap-detection thresholds improve at higher levels in CI listeners. Specifically, we should see a steeper fall from 2 to 45 ms at the lower level than at the higher level if confusion effects influence probe detection thresholds in our measurements.
II. METHODS
A. Subjects
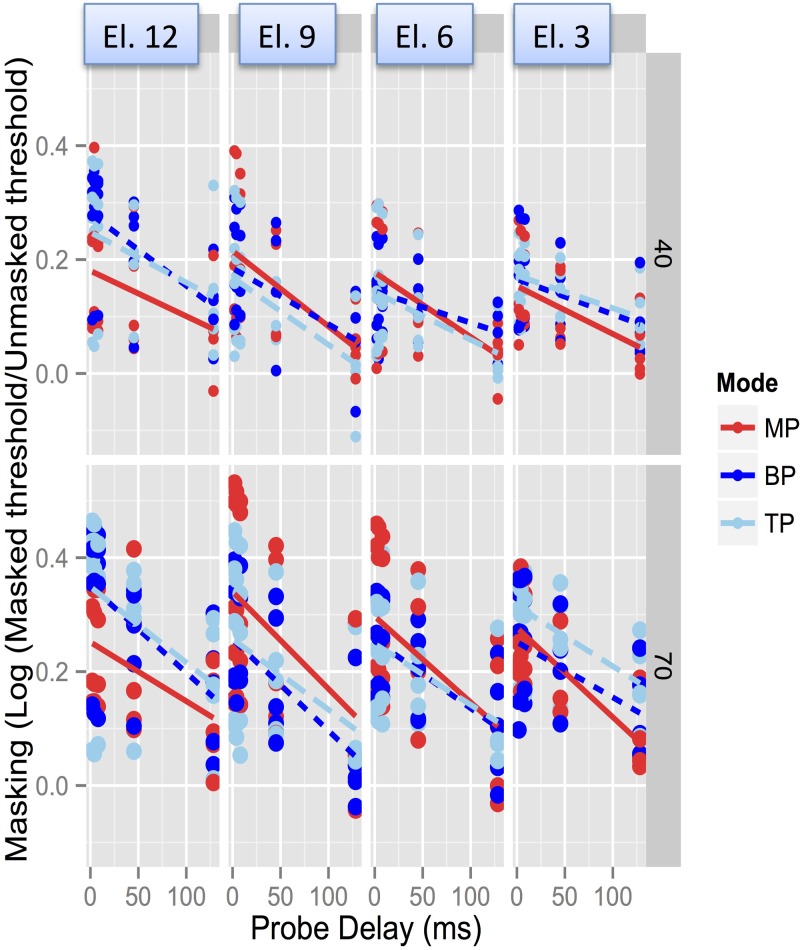
A total of 12 CI adult users (13 ears) participated in this study. Seven of these were Cochlear CorporationTM device users while the remaining five were Advanced BionicsTM device users. Informed consent was obtained from all of the subjects prior to testing. Table I provides relevant demographic information. CH04 was the only child participant in the study. Bilaterally implanted subjects were tested on the earliest implanted side. The exception was Subject N2 who was tested on the later implanted side as her earlier implanted side had an older N-22 device which cannot be stimulated in monopolar mode. Another exception was Subject N3 who was tested on both sides. The right and left (later implanted) sides for N3 are referred to as N3_RE and N3_LE hereafter.
TABLE I.
Relevant information about subjects.
| Subject | Onset of deafness | Stimulation mode | Ear | Device | Gender | Age at implantation (years) | Age at initial testing (years) |
|---|---|---|---|---|---|---|---|
| N1 | Early/prelingual | MP1, BP+1 | L.E.a | CI24RE (CA) | F | 61 | 66 |
| N2 | Early/prelingual | MP1, BP+2 | L.E.a | CI24RE (CA) | F | 16 | 22 |
| N3_RE | Prelingual | MP1, BP+1 | R.E. | CI24R (CA) | M | 18 | 26 |
| N3_LE | Prelingual | MP1, BP+1 | L.E. | CI 24 RE (CA) | M | 23 | 26 |
| N4 | Early/prelingual | MP1, BP+1 | L.E. | CI24R(CS) | F | 41 | 51 |
| N5 | Postlingual | MP1, BP | R.E. | CI512 | F | 50 | 52 |
| N6 | Postlingual | MP1, BP+1 | R.E.a | CI24R(CS) | M | 44 | 54 |
| N7 | Postlingual | MP1, BP+1 | R.E. | CI24R(CS) | F | 51 | 60 |
| C01 | Postlingual | MP1, BP+1, pTP (σ = 0.375) | R.E.a | Clarion 90K 1J | F | 31 | 37 |
| C03 | Postlingual | MP1, BP+1, pTP (σ = 0.45) | L.E. | Clarion CII | M | 55 | 65 |
| C04 | Prelingual | MP1, BP+1, pTP (σ = 0.45) | R.E. | Clarion CII | F | 18 | 29 |
| C05 | Postlingual | MP1, BP+1, pTP (σ = 0.375) | L.E. | Clarion 90K 1J | F | 63 | 69 |
| CH04 | Early/prelingual | MP1, BP+1, pTP (σ = 0.375) | R.E. | Clarion CII | M | 06 | 18 |
Bilateral implantation.
B. Stimuli
1. Cochlear CorporationTM devices
Participants were implanted with Nucleus CI24RE/CI512 systems (i.e., the same electrode array) or with the older-generation CI24R (CA or CS) systems. (Table I). Stimuli were trains of charge-balanced, biphasic current pulses, with the overall duration of each pulse selected to be less than half the period of the train. Participants were stimulated in both bipolar (BP, BP+1, and BP+2) and monopolar (MP1, using the ball ground) modes. These modes will be referred to as BP and MP collectively henceforth. Electrical stimuli were generated and delivered by using a custom research interface (the House Ear Institute Nucleus Research Interface; Shannon et al., 1990; Robert, 2002) and software. Maskers and probes were 1000 pulses/s pulse trains, 300 and 20 ms long, respectively, and all pulses had pulse phase durations (PPDs) of 100 μs and interphase gaps (IPGs) of 40 μs. The relatively long value of the per-phase pulse duration was chosen to ensure that MALs could be obtained in BP mode, as loudness grows more rapidly with current level for longer pulse phase durations (Chatterjee et al., 2000). Stimuli were presented to electrodes (Els) 6, 10, 14, and 18 in each mode. Probe delays (masker offset to probe onset) were 2, 4, 8, 45.25, and 128 ms long, respectively. For ease of readability, we will hereafter refer to the delays as 2, 4, 8, 45, and 128 ms, respectively. Masker levels were fixed at loudness-balanced levels corresponding to 70% and 40% of the dynamic range (DR) on a fixed reference electrode and mode (see below). Not every participant was tested at both levels. Subjects N2 and N6 were only tested at 40% DR level as loudness balancing at the 70% DR level across modes proved to be a challenging task for them. The reason for this difficulty is unclear, but we speculate that perceptual differences between modes (such as pitch/timbre/other attributes) were magnified at the higher level and made it more difficult for these patients to focus on loudness alone. Due to limited availability, subject N3 was tested only at 70%DR on both sides. Thus, N2, N4, N5, N6, and N7 (6 subjects) were tested at the 40% DR level, and N3_RE, N3_LE, N4, N5, and N7 were tested at the 70% DR level (5 subjects, 6 ears).
2. Advanced BionicsTM devices
All participants were either Clarion–CII or HiRes 90 k (HiFocus family of electrodes) device users (Table I). Stimuli were presented in monopolar (MP), bipolar (BP), or partial tripolar (TP) mode. Masker and probe pulse trains were presented at 997.84 pulses/s and were 300.65 and 20.04 ms in duration, respectively. All pulse trains consisted of periodic, biphasic current pulses; phases were symmetric and had PPD of 96.984 μs and IPG of 43.104 μs. Probe delays were 2.004, 4.009, 8.017, 45.352, and 128.277 ms long. For ease of readability, we will hereafter refer to the delays as 2, 4, 8, 45, and 128 ms, respectively. Stimuli were presented at loudness-balanced levels corresponding to 70% and 40% DR on a reference electrode. Stimuli were delivered via the Bionic Ear Data Collection System (BEDCS) research interface software and hardware provided by Advanced BionicsTM.
C. Procedure
1. Threshold and MAL
Detection threshold was measured using a 2-down, 1-up, 2-interval, 2-alternative, forced-choice (2I-2AFC) adaptive procedure. The maximal acceptable level (MAL) was determined by a subjective measure, in which the subject increased the current level of the stimulus in incremental steps until the loudness reached a maximally tolerable level. Both measures were repeated several times and the means were calculated to obtain the final threshold and MAL. The dynamic range (DR) was calculated as the difference in μA between the two.
2. Loudness balancing
a. Cochlear CorporationTM device users.
The 40% and 70% DR levels were calculated for El 18 MP. Stimuli on El 6 (MP and BP), El 10 (MP and BP), El 14 (MP and BP), and El 18 (BP) were then loudness balanced to El 18 MP at each of the two levels. Note that in these devices, El 22 is most apical and El 1 is most basal. A double-staircase, 2I-2AFC adaptive procedure (Jesteadt, 1980) was used for loudness balancing the experimental electrodes to the reference electrode. In each trial, the listener heard the two signals (presented in random order) and indicated which sounded the louder, with instructions to ignore pitch/other quality differences. The descending (2-down, 1-up) and ascending (2-up, 1-down) staircases were interleaved, with trials presented randomly from each. At the end of the run, the mean of the last few reversal points obtained for the descending and ascending tracks were averaged. At least two repetitions were conducted for each condition. The final loudness-balanced level was calculated from the mean of all repetitions.
b. Advanced BionicsTM device users.
Dynamic range was calculated, based on MAL and thresholds, for El 3 (MP mode). In these devices, electrodes are numbered 1–16, apical-basal. The stimulus on El. 3 (MP mode) served as the reference electrode. Stimuli on El 6 (MP, BP, TP), El 9 (MP, BP, TP), El 12 (MP, BP, TP), and El 3 (BP and TP) were then loudness balanced to El 3 (MP) at 40% and 70% DR levels. Owing to time and technical limitations, a subjective adjustment procedure was used for loudness-balancing, in which subjects heard the reference stimulus followed by the experimental stimulus, and were asked whether the experimental stimuli were louder or softer than the reference. Depending on the response, the experimenter increased or decreased the level on the experimental stimulus until the subject indicated satisfaction with the loudness match. This procedure was repeated at least twice. The average of the repetitions was calculated and used as the loudness balanced values for the electrode. The same method was used for all electrodes across modes.
3. Adaptive methods for measuring recovery from forward masking
Recovery from forward masking was measured using a 2I-2AFC adaptive procedure. The masker was presented at one of the loudness-balanced levels in both intervals. Randomly, in one of the intervals, the masker was followed by a 20-ms probe presented at the same electrode, pulse rate and stimulation mode as the masker. The masker-probe delay was a parameter of interest. Thresholds for the probe were measured in the masked and unmasked condition using the same procedure (in the unmasked condition, the masker was absent in both intervals).
a. Cochlear CorporationTM device users.
For each adaptive track, a minimum of 8 reversals were required within 55 trials. If 10 reversals were achieved within 55 trials, the track was stopped. Of the 8 to 10 reversals achieved, the initial (first four reversals) and final (last four to eight reversals) step sizes were 1 and 0.5 dB, 0.6 and 0.3 dB, or 0.4 and 0.2 dB depending on current levels. The first four reversal points were discarded, and the mean of the remaining reversal points was calculated to obtain the threshold. Typically, the mean threshold from two runs was calculated as the final threshold. Subject N2 was only available for limited periods of time, so a longer single run of 70 trials with a minimum of 12 and a maximum of 14 reversals was used in her case for all threshold measures in the experiment (in this case also, the first four reversal points were discarded, and the mean of the remaining reversal points was calculated).
b. Advanced BionicsTM device users.
The maximum number of trials for each run was set at 55, as with Cochlear CorporationTM device users, with the run stopping after 10 reversals. The initial step size was 15 μA or less and was halved after the first three reversals. The first four reversal points were discarded, and the mean of the remaining reversal points was calculated. The mean threshold from two runs was calculated as the final threshold.
D. Data analyses
Data analyses were conducted in Sigmaplot 12.0 and in the statistical software package r v. 3.12 (R Core Team, 2014), using the lme4 (Bates et al., 2014), nlme (Pinheiro et al., 2014), and multcomp (Hothorn et al., 2008) packages for linear mixed effects analyses and for post hoc analyses.
III. RESULTS
A. Preliminary analyses
To compare relative effects across subjects, electrodes and modes, we used the ratio of the masked to the unmasked probe thresholds (Tm/T0) as the measure of masking.
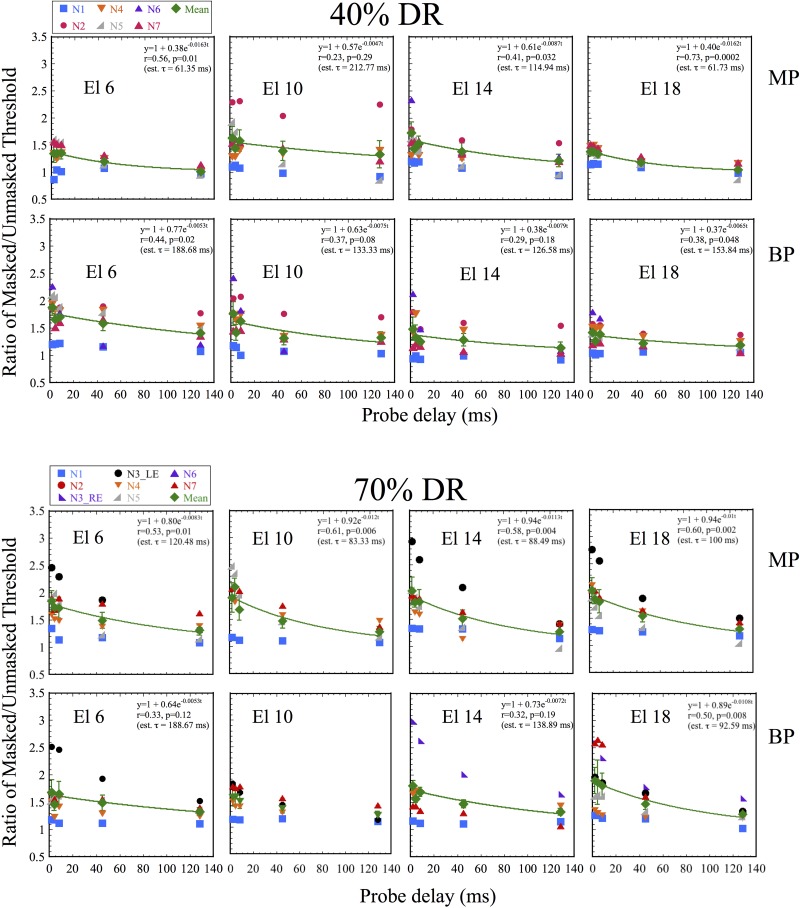
Figure 1 shows results obtained with CochlearTM device users with maskers presented at 40% and 70% DR levels (top and bottom sections), and using MP and BP modes (upper and lower panels within each section). Within each row, panels from left to right indicate data obtained on electrodes 6, 10, 14, and18, basal to apical. Symbols represent data obtained with individual subjects, with the diamonds showing the across-subject means. The lines show the best-fitting exponential fits to the pooled data (i.e., combining data across subjects for each electrode), using the equation y = 1 + ae−t/τ, where the inverse of the time constant τ determines the estimated rate at which masked threshold converges with unmasked threshold (i.e., a ratio of 1.0). Estimated values of τ are shown in the insets. A single exponential function was used to fit the data, as the set of probe delays was too small to allow for greater precision in time. Outlier analyses were conducted using Tukey's method (Tukey, 1977) at each masker level. None of the data fell below the acceptable range (lower quartile − 1.5 interquartile range). In some instances, initial portions of the recovery function fell well above the upper fence (third quartile + 1.5 interquartile range) and data obtained in those conditions were excluded from Fig. 1, from the calculation of the means in Fig. 1, and from the curve-fit to estimate the time constant. At the 40% DR level, these comprised subject N2's data at Els. 6 and 18 in MP mode, and subject N5's data at Els. 10 and 14 in BP mode. At the 70% DR level, excluded datasets included subject N3's RE data at all electrodes in MP mode, N3's LE data at El. 10 in MP mode; N3's RE data at Els. 6 and 10 in BP mode, N3's LE data at El. 14 in BP mode, and N5's data at Els. 10 and 14 in BP mode.
FIG. 1.
(Color online) Masking levels (ratio of Masked/Unmasked thresholds, Tm/T0) for individual CochlearTM users plotted against probe delay (ms). Upper and lower sections show results obtained with 40% and 70% DR level maskers, respectively. Within each section, upper and lower panels show results obtained in MP and BP stimulation modes. Each panel shows data obtained on a different electrode. From left to right, individual panels show results obtained on electrodes located from base to apex along the intracochlear array. Within each panel, different symbols show results with different subjects (identified in the legend in the top left hand corner of each section). The lines show exponential fits to the data pooled across subjects for each electrode. Insets show the fit parameters and the estimated time constant (τ). In one condition (El. 10, 70% DR) it was not possible to achieve a reasonable fit to the data.
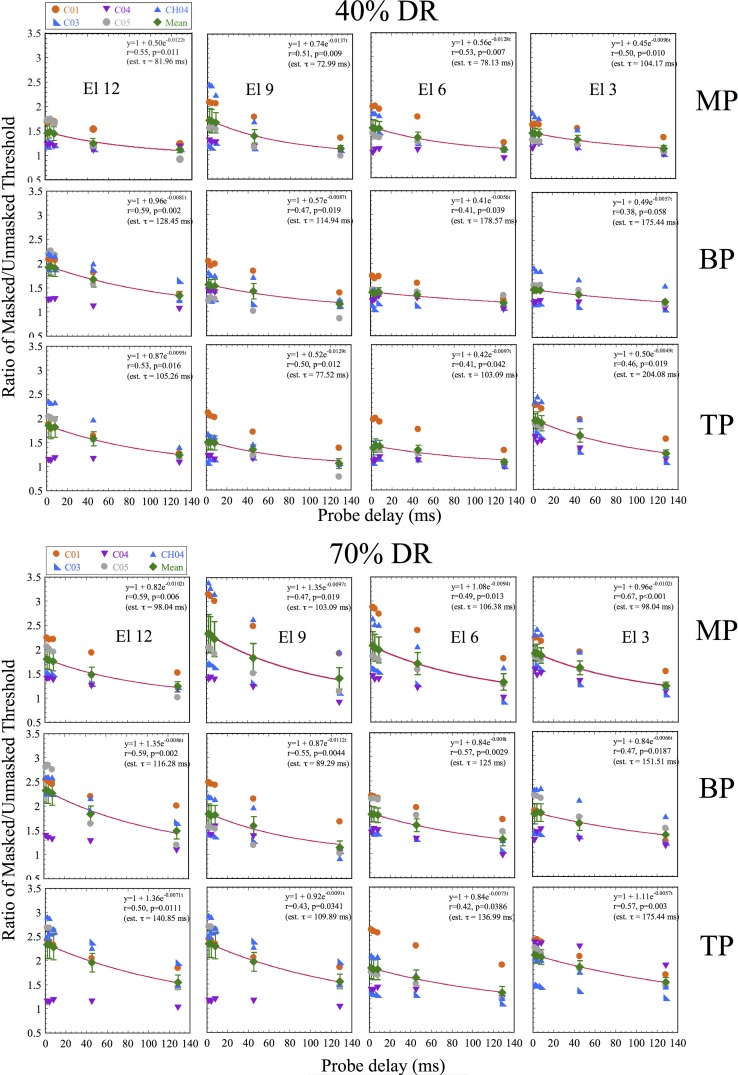
Similarly, Fig. 2 shows results obtained with Advanced BionicsTM users, in each of the three modes. Again, none of the data fell below the acceptable range using Tukey's method. Data falling well above the upper fence and excluded from the figure and curve fits included: at the 40% DR level, CH04's data at El. 12 in MP mode and C03's data at El. 12 in TP mode. At the 70% DR level, only CH04's data at El. 12 in MP mode were excluded.
FIG. 2.
(Color online) Masking levels vs probe delay, as in Fig. 1, but for Advanced BionicsTM device users. From left to right, panels show results obtained with electrodes from base to apex. From top to bottom, results are shown for stimulation in MP, BP, and TP mode. The top half shows results obtained with 40% DR maskers and the bottom half shows results obtained with 70% DR maskers. Lines show exponential fits to the pooled data as in Fig. 1, and insets show fit parameters and estimated time constants.
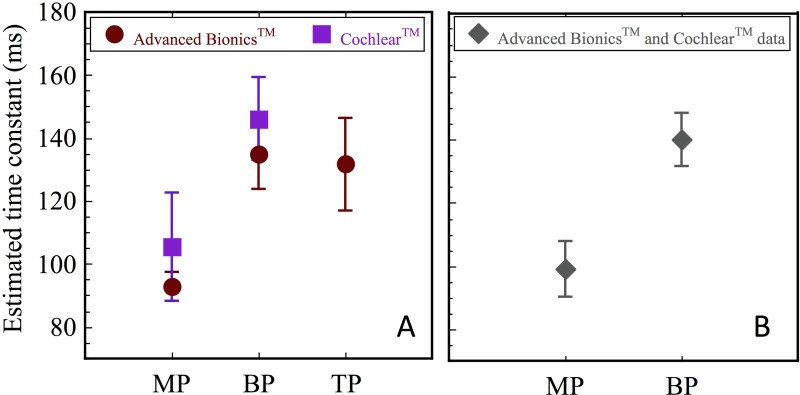
Figure 3A shows across-electrode means and standard errors of the time constants estimated from the curve fits shown in Figs. 1 and 2, for the different stimulation modes and each of the two devices; data were pooled across levels as initial tests showed no effects of level. Paired-t tests (one way, Bonferroni correction for multiple comparisons) showed significant differences between MP and BP modes (p = 0.017) and between MP and TP modes (p = 0.021) in AB users, but no differences between BP and TP modes. CochlearTM users did not show significant effects of mode, but the patterns seemed similar. Considering only the MP and BP modes, no significant differences were found between AB and CochlearTM users' time constants (t-test). Combining the time constants obtained across the two devices and levels [Fig. 3(B)], paired t-tests on the data showed a significant difference between MP [mean estimated time constant = 99.12 ms, standard error (s.e.) = 8.74 ms] and BP (mean estimated time constant = 140.14 ms, s.e. = 8.28 ms) stimulation modes (p = 0.005). These analyses suggested significant effects of mode, with a more rapid recovery in monopolar mode than in bipolar and tripolar modes. However, interactions with electrode sites and levels seemed likely, and given the strong intersubject variation in the data, additional analyses taking these factors and including random subject-based effects into account were conducted.
FIG. 3.
(Color online) (A) Mean estimated time constants calculated across electrodes and subjects, for stimulation in the different modes. Error bars show +/− 1 s.e. Results obtained with CochlearTM and Advanced BionicsTM devices are shown in squares and circles, respectively. (B) Mean estimated time constants calculated across electrodes, levels, and subjects for stimulation in MP and BP mode: combined data from CochlearTM and Advanced BionicsTM users combined. Error bars show +/− 1 s.e.
B. Effects and interactions of probe delay, mode, electrode, and level
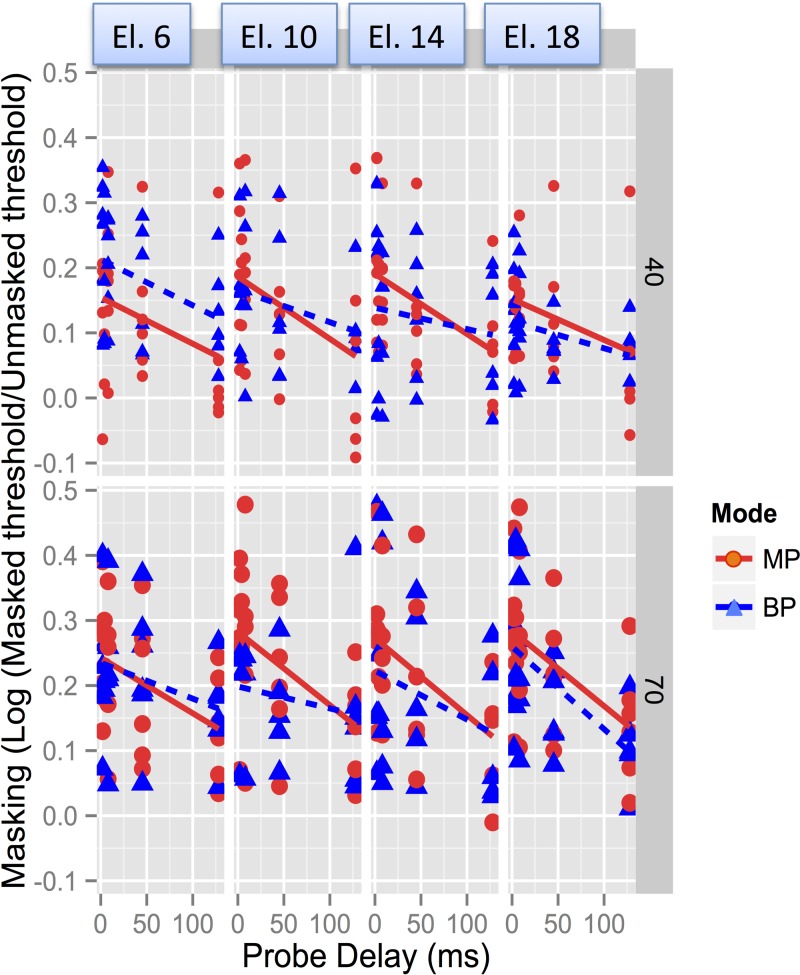
A linear mixed-effects (LME) modeling approach was taken to study the effects of the different factors of interest and to incorporate subject-based random effects into the analyses. The LME model being a regression analysis, is tolerant of missing data and widely favored for repeated-measures data with strong expected inter-subject variation, such as those in our study. As the recovery functions we observed were well approximated by an exponential shape on linear axes, we used log10(Tm/T0) as the output variable (masking), and linear probe delay as the primary fixed-effect/input variable for the LME analyses. The transformation to semi-log axes results in a linear function, more suited to the LME regression approach (Figs. 4 and 5). Outlier analyses were conducted at each of the two levels of maskers (40% and 70% DR), and individual data points falling above the upper fence (third quartile + 1.5 interquartile range) or below the lower fence (first quartile − 1.5 interquartile range) were excluded from analyses.
FIG. 4.
(Color online) Data obtained with CochlearTM devices, plotted as log (Tm/T0) against linear delay in ms. The top and bottom panels show results obtained at 40% and 70% DR levels, respectively. From left to right, the plots show results with the four electrodes from base to apex. Circles and triangles correspond to MP and BP stimulation modes, respectively.
FIG. 5.
(Color online) Similar to Fig. 4, but with data obtained in Advanced BionicsTM users, log Tm/T0 vs Delay for 40% and 70% DR (top and bottom), and each of the four electrodes (basal to apical, left to right). Lines show linear regression, shaded areas show confidence intervals. MP, BP, and TP data are shown in circles, triangles, and squares, respectively.
1. LME: Results with CochlearTM devices
Outlier analyses (see above) showed that while none of the data fell below the lower fence, some data were above the upper fence, particularly the masking ratios at the shortest delays. At the 40% DR level, 5.58% of the data were excluded from analyses. At the 70% DR level, the proportion increased to 10.22%. In the LME model, fixed effects were probe delay (Delay), stimulation mode (Mode), stimulating electrode (Electrode), and masker level (Level), and subject-based random intercepts and slopes were included for the factor Delay. Inclusion of subject-based random effects for the other factors either did not improve the model fit or resulted in lack of convergence. Visual inspection of residuals plots provided additional confirmation of the model fit.
Results showed significant effects of Delay (F1,7.71 = 31.4, p = 0.0006), Electrode (F1,389.02 = 6.43, p = 0.0116), Mode (F1,388.91 = 7.68, p = 0.006), and Level (F1,392.46 = 110.01, p < 0.0001). Significant interactions were observed between Delay and Mode (F1,388.84 = 11.46, p = 0.0008), between Mode and Electrode (F1,388.73 = 17.18, p < 0.0001) and Level and Electrode (F1,389.02 = 6.78, p = 0.0096). The interaction between Mode and Level was marginal (F1,388.87 = 4.04, p = 0.045). A marginal three-way interaction between Mode, Electrode and Level was also found (F1,388.75 = 3.94, p = 0.047).
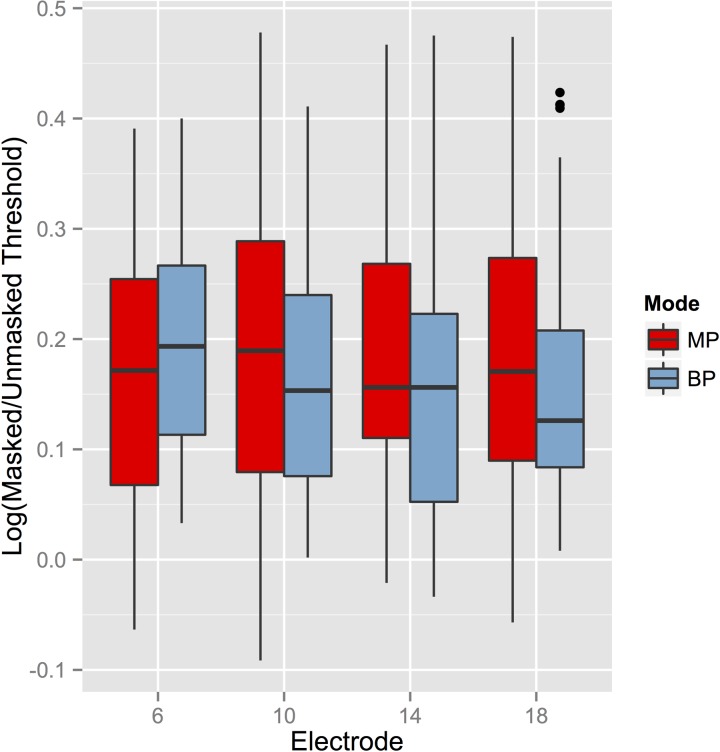
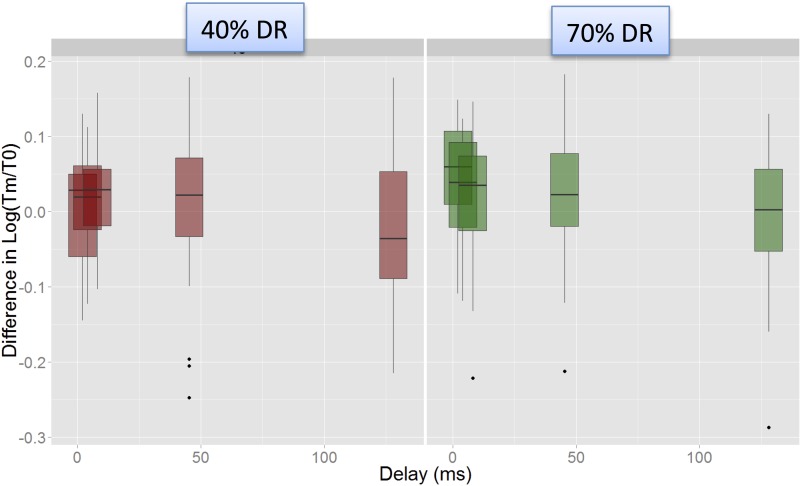
Post hoc Tukey comparisons showed that the longest delay (128 ms) was associated with significantly lower levels of masking than all others, with the exception of the 45.25 ms delay. None of the other comparisons reached significance. Post hoc analysis of the effect of Electrode showed that the most basal electrode was associated with significantly greater masking than the most apical electrode (p = 0.008); none of the other differences were significant. Similar analysis of the interaction between Electrode and Mode showed significantly greater masking when the masker was on the most basal electrode rather than the most apical electrode in BP mode (p = 0.04), but not in MP mode, and no other significant differences were found (Fig. 6). The interactions between Delay, Level, and Mode were investigated by a linear-mixed-effects model analysis to study the relation between the MP-BP difference in log(Tm/T0) with Delay and Level as fixed effects, including subject-based random intercepts. Results showed a significant effect of Delay (F1,182 = 8.17, p = 0.0048), with the MP-BP masking difference decreasing with increasing probe delay, but no significant effects of Level (Fig. 7). Thus, the marginal three-way interaction between Mode, Level, and Delay was not supported by the post hoc analysis.
FIG. 6.
(Color online) Boxplots illustrating the mode-electrode interaction in CochlearTM users. Log(Tm/T0) was significantly higher on El. 6 than on El. 18 in BP mode, but not in MP mode. Data collapsed across levels and delays.
FIG. 7.
(Color online) MP-BP difference in log(Tm/T0) [masking] for each delay, and for the two levels, in CochlearTM users. The difference in masking between modes decreases significantly with increasing delay, but there is no significant effect of level (left and right panels) on the MP-BP difference in masking. Data collapsed across electrodes.
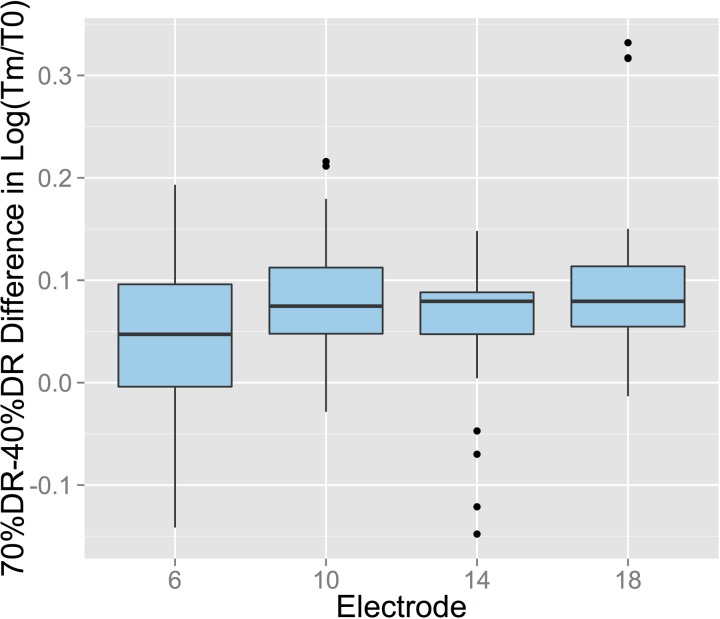
The Electrode-Level interaction was examined by conducting pairwise t-tests (Bonferroni correction) on the difference in the log of the masking ratio between 70% and 40% DRs, obtained at different electrodes (Fig. 8). The level-based masking difference was significantly greater on electrode 18 than on electrode 6 (p = 0.006), but no other differences were found.
FIG. 8.
(Color online) Difference in log(Tm/T0) obtained with 70% DR and 40% DR maskers for each electrode, calculated across levels and delays in CochlearTM users. These data illustrate the Electrode-Mode interaction. The difference was significant between electrodes 6 and 18, but no other differences were found.
2. LME: Results with Advanced BionicsTM devices
Fixed effects included Delay, Mode, Electrode, and Level; random effects included subject-based random intercepts and slopes for all four factors (the model showed successive significant improvements with the inclusion of each random effect). Results showed significant main effects of Delay (F1,5.4 = 40.40, p = 0.0011) and Level (F1,6.6 = 54.15, p = 0.0002). Significant interactions were observed between Delay and Mode (F1,569.76 = 6.129, p = 0.014), Delay and Electrode (F1,569.78 = 6.46, p = 0.011, and Delay and Level (F1,569.64 = 18.07, p < 0.0001).
Post hoc pairwise t-tests investigating the effect of Delay showed that masking was not significantly different between delays of 2, 4, and 8 ms, while all other comparisons were significantly different: thus, masking was less at 45 ms than at 2, 4, or 8 ms, and less at 128 ms than at all other delays (all p values <0.01 after Bonferroni corrections for multiple comparisons).
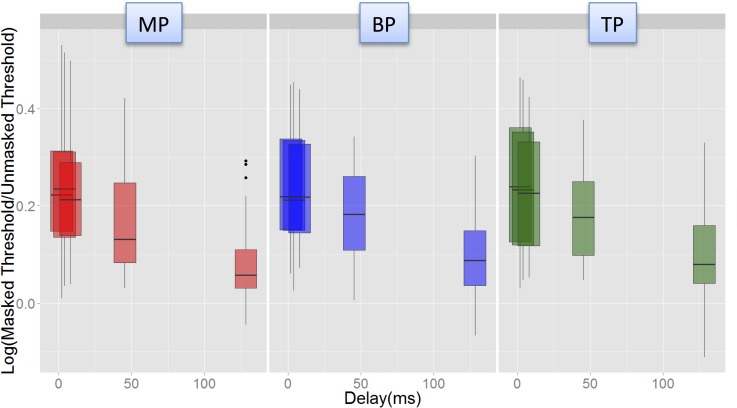
Post hoc Tukey analyses showed that the interaction between Delay and Mode was chiefly due to a steeper recovery from forward masking in MP mode than in BP or TP modes at shorter probe delays. For instance, the masking was significantly different between 2 and 45 ms (p = 0.024), and between 4 and 45 ms (p = 0.02), in MP mode, but not in BP or TP modes. In all modes, the masking at 128 ms delay was significantly lower than that at other delays. This is illustrated in Fig. 9, which plots the recovery data for each mode, pooled across masker levels and electrodes.
FIG. 9.
(Color online) Illustration of the Delay-Mode interaction in the Advanced BionicsTM data. Masking (log Tm/T0) vs Delay plotted for each of the three modes (left to right). Data were pooled across electrodes and levels. Steeper recovery was observed between the two shortest delays and the 45 ms delay in MP mode, but not in the other modes.
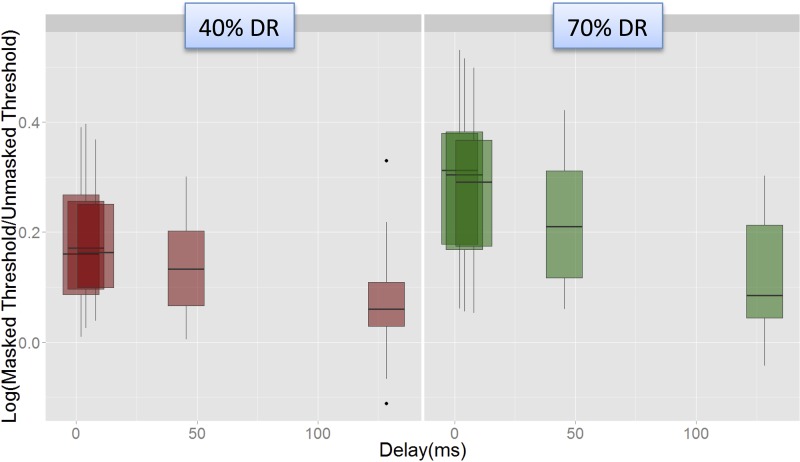
The interaction between Delay and Level appeared to be driven by a steeper fall in masking from the shorter delays (2, 4, and 8 ms) to the 45.25 ms delay at the higher level than at the lower level (i.e., there was a significant difference in masking between the 45.25 ms delay and the 8 ms delay at the 70% DR level, but not at the 40% DR level). This is shown in Fig. 10, which shows the variation in masking with delay for each of the two levels, pooled across electrodes and modes.
FIG. 10.
(Color online) Illustration of the Level-Delay interaction in the Advanced BionicsTM data. Masking (log Tm/T0) plotted against Delay for the two levels. Steeper fall in masking was observed between the shortest delays and the 45 ms delay at the 70% DR level, but not at the 40% DR level.
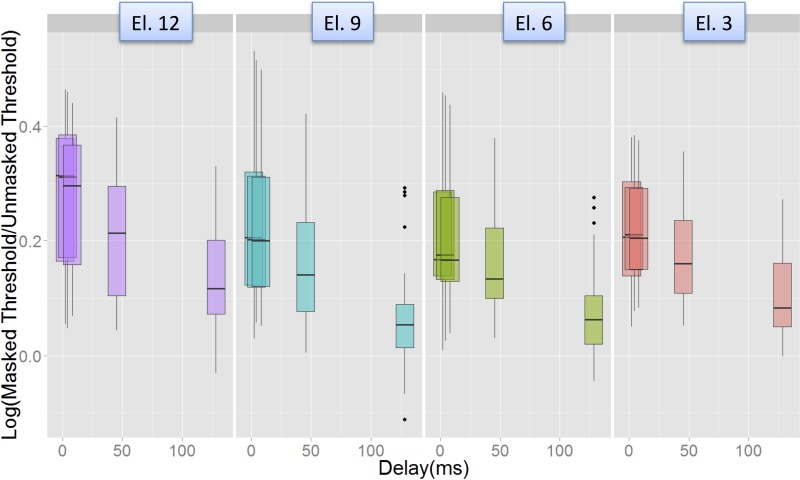
Post hoc Tukey comparisons suggested that the interaction between Delay and Electrode was driven by higher levels of masking on Electrode 12 than on Electrode 6 at the shortest delays (2 ms, p = 0.06 and 4 ms, p = 0.029). The variation of recovery across electrodes, pooled across levels and modes, is shown in Fig. 11.
FIG. 11.
(Color online) Illustration of the Electrode-Delay interaction in the Advanced BionicsTM data. Masking (log Tm/T0) vs Delay for each of the four electrodes. Masking was significantly higher on El. 12 than on El. 6 at the shortest delays (2 and 4 ms), but not at the other delays.
IV. DISCUSSION
A. Summary of results
-
(1)
As in previous studies, recovery from forward masking was reasonably well-approximated by an exponential function in most instances. Estimates of time constants based on best-fits to pooled recovery functions across subjects and electrodes suggested more rapid recovery in MP than for BP or TP stimulation mode.
-
(2)
In both devices, LME analyses accounting for effects of level, electrode site, and subject-based variations, confirmed that MP stimulation mode resulted in a steeper recovery than more focused modes. The difference in masking between MP and more focused modes was greater at the shorter delays and decreased with increasing delay.
-
(3)
Significant effects of electrode site were observed across modes and levels in CochlearTM devices, with the most basal electrode producing more masking than the most apical electrode. However, this result needs to be considered in view of significant interactions between electrode and mode, with the basal-apical difference being significant for BP mode but not MP. Thus, the BP mode data likely dominated the significant main effect of electrode.
-
(4)
Significant effects of masker level (70% DR masking >40% DR masking) were observed in both devices, and significant interactions between level and electrode were observed in CochlearTM devices. Post hoc analyses showed that the level effect was smaller on the most basal electrode than on the most apical electrode (i.e., the 70% DR masking and 40% DR masking were more similar on the basal electrode and more different on the apical electrode). In Advanced BionicsTM devices, masker level interacted with probe delay, with a steeper recovery at intermediate delays at the higher level than at the lower level.
-
(5)
Stimulating electrode location interacted with probe delay in Advanced BionicsTM devices, with different shapes of recovery across electrodes. The most basal electrode (El. 12) showed significantly more masking at the shortest delays than one of the more apical electrodes (El. 6). Thus, recovery was also steeper on the most basal electrode than on El. 6.
B. Mechanisms and significance
The results of the present study indicate that stimulation mode can influence shapes and rates of recovery from forward masking. This can have important implications in speech perception, as the primary differences appear at short and intermediate probe delays (2–45 ms) which are important in phoneme recognition, syllable boundaries and formant transitions. An important issue to consider here is whether the absolute current level, which increased for more focused stimulation modes, was an important contributor to the effect of mode. In CochlearTM devices, increasing level did not change the shape of the recovery function (i.e., masker level did not interact with probe delay), but in Advanced BionicsTM devices, increasing level resulted in a steepening of the recovery function. This is the opposite of the mode effect (i.e., focusing the mode resulted in a shallower recovery function in both device types, although the current level increased). We therefore infer that the absolute current level of the masker did not contribute to the observed differences between modes. When level-effects were observed (i.e., in the Advanced BionicsTM device users), the effect was in the same direction as that obtained when broadening the stimulating field using stimulation mode (i.e., steeper recovery functions for higher levels as well as broader stimulation mode). This suggests that one contributing factor to the mode-based differences observed here may result from the spread of excitation and/or the activation of faster-recovering groups of neurons. It may be argued that, other than broadening the field, increasing masker level also has the second effect of evoking stronger responses from the stimulated neurons and increase recovery time constants. However, the results show either no effect on the time course of recovery or a steeping of the function at the higher level. Further, previous work has shown no appreciable effects of masker level on recovery time constants (Chatterjee and Shannon, 1998; Chatterjee, 1999).
While there were notable similarities in the main results across devices, some differences were observed in the interactions. For instance, the level-dependence of the slope of recovery was observed in Advanced BionicsTM devices but not in CochlearTM devices. Effects of electrode site, and interactions between electrode site and mode, were also different across devices. Specific reasons for these differences are unclear: we speculate that underlying mechanisms may be related to differences between electrode design and electric field shape.
Some concerns might arise because the sample size was relatively small in the present study. Sources of variability in the CI population are likely numerous and difficult to control for. In the present study, several steps were taken to ensure statistical rigor. First, visual inspection of the residuals indicated that normality assumptions were not violated. Statistical comparisons between successively more complex models were used to select the final model fit, and more parameters were only included if they showed a significant improvement over the simpler versions. Among the CochlearTM users, one concern was that the data from the two ears of Subject N3 might be internally correlated. A Pearson correlation analysis of the two datasets was conducted (after outlier analyses, some data were excluded, and the remaining number of points was 21). The result showed no significant correlation (r = 0.27, t(19) = 1.22, p = 0.24), suggesting that their inclusion in the analyses did not violate the rule of independence. Note that these data were only available for the 70% DR masker level, so the issue did not arise for the 40% DR level. These steps ensured a reasonable degree of reliability of the results.
In the Introduction, we had discussed “confusion effects” between the masker and probe, in which the listener cannot hear the gap between the two and detects the probe as an extension of the masker (Neff, 1985, 1986). This can steepen the recovery function at early probe delays. We had hypothesized that if such effects were present in our results, the early portion of the recovery function should be steeper at the lower masker level than at the higher level, as gap-detection thresholds are strongly level-dependent in CI users. The results do not show such effects: the recovery function either showed no interaction with masker level (CochlearTM users) or showed the opposite effect, with steeper recovery in the early part of the function at the higher level (Advanced BionicsTM users). In previous work (Chatterjee and Shannon, 1998; Chatterjee, 1999) we had not observed major changes in the shape of the recovery function with level, either. Based on these findings, we infer that confusion effects did not play a significant role in our present experiments.
The present results showing steeper recovery in MP than in focused modes are consistent with the findings of Brown et al. (1996) indicating steeper recovery in ECAP measures with monopolar mode than with bipolar mode in users of the Ineraid CI. This is reassuring given the differences between devices and methodologies across the studies.
We speculate that MP stimulation, by activating a larger neural population, may result in better psychophysically measured temporal resolution by one of two mechanisms: 1) by exciting more neurons in a synchronized manner, a larger summed and temporally precise response may propagate to central nuclei or 2) by allowing the “best” (fastest-recovering) neural groups to respond, no matter what their location re: the activation site. This may not be the most desirable scenario, as the improved temporal response is obtained at the cost of spectral resolution. The present results also reinforce the notion that focused stimulation spotlights responses of local groups of neurons which may have varying levels of damage and recover more slowly from prior stimulation. The level-effect observed in Advanced BionicsTM devices (steeper recovery at higher levels) may reflect the greater sensitivity obtained with a larger neural population responding, as well.
In both devices, electrode-based differences in main effects and interactions suggest site-dependencies in recovery that may reflect differences in nerve survival or electrode-neural distance across-sites. Such differences are also problematic for auditory coding, as across-site variations in the forward masking recovery time after prior stimuli are likely distort the spectral shape of the neural response pattern evoked by future stimuli.
Previous studies (Chatterjee, 1999; Nelson and Donaldson, 2001) have reported nonmonotonic recovery functions using bipolar stimulation modes. The present study did not allow the time-resolution to capture such nonmonotonicity, but if such effects are stronger in more focused stimulation modes, they might also contribute to apparently shallower recovery functions, particularly at the intermediate probe delays.
Chatterjee and Kulkarni (2014) reported steeper temporal integration of pulse phase duration in MP vs more focused modes. It is possible that the greater temporal sensitivity in MP mode arises from similar underlying causes in both studies. Considered together, the two sets of results combine to underscore the possibility that listeners' sensitivity to temporal changes may be altered with stimulation mode. Whether such changes are desirable or not, will depend on underlying mechanisms and their impact on both spectral and temporal coding.
There has been some speculation regarding the contributions of peripheral and central processes to recovery from forward masking in electrical hearing (Shannon and Otto, 1990). As mentioned in the Introduction, using single-pulse stimuli, Brown et al. (1996) showed that ECAP recovery functions recorded in the auditory nerve were similar to the early recovery phase in psychophysical measurements in the same subjects. A later, slower recovery observed in the psychophysical measurements was, however, not observed in the ECAP measurements. This important observation provided an early indication that rapid recovery from forward masking might be peripherally determined, and that later mechanisms of recovery might be more central in origin. Using pulse trains, Chatterjee (1999) focused on the early and late aspects of recovery, and similar conclusions were reached by Kirby and Middlebrooks (2010) in their neurophysiological recordings from guinea pig cortex. The present results suggest that some portion of recovery up to 45 ms is more susceptible to factors such as spread of excitation, supporting the idea that the early part of the recovery function is likely to be more peripherally driven. Such a conclusion is further supported by recent work in humans suggesting a relation between multipulse temporal integration, a predictor of nerve survival in the periphery, and the rate of recovery from forward masking (Zhou and Pfingst, 2016).
ACKNOWLEDGMENTS
This work was supported by NIH Grant No. R01 DC004786 and by startup funds from Boys Town National Research Hospital. Portions of the findings were presented at the 2013 meetings of the Association for Research in Otolaryngology and the Conference on Implantable Auditory Prostheses. We thank Shuman He for her constructive comments on the manuscript.
References
- 1. Bates, D. , Maechler, M. , Bolker, B. , and Walker, S. (2014). “ lme4: Linear mixed-effects models using Eigen and S4. R package version 1.1-7,” http://CRAN.R-project.org/package=lme4> (Last viewed 9/1/2016).
- 2. Bierer, J. A. , Bierer, S. M. , and Middlebrooks, J. C. (2010). “ Partial tripolar cochlear implant stimulation: Spread of excitation and forward masking in the inferior colliculus,” Hear. Res. 270, 134–142. 10.1016/j.heares.2010.08.006 [DOI] [PMC free article] [PubMed] [Google Scholar]
- 3. Bierer, J. A. , and Middlebrooks, J. C. (2002). “ Auditory cortical images of cochlear-implant stimuli: Dependence on electrode configuration,” J. Neurophysiol. 87(1), 478–492. 10.1152/jn.00212.2001 [DOI] [PubMed] [Google Scholar]
- 4. Brown, C. J. , Abbas, P. J. , Borland, J. , and Bertschy, M. R. (1996). “ Electrically evoked whole nerve action potentials in Ineraid cochlear implant users: Responses to different stimulating electrode configurations and comparison to psychophysical responses,” J. Speech Hear. Res. 39(3), 453–467. 10.1044/jshr.3903.453 [DOI] [PubMed] [Google Scholar]
- 5. Cartee, L. A. , Miller, C. A. , and van den Honert, C. (2006). “ Spiral ganglion cell site of excitation I: Comparison of scala tympani and intrameatal electrode responses,” Hear. Res. 215(1), 10–21. 10.1016/j.heares.2006.02.012 [DOI] [PubMed] [Google Scholar]
- 6. Chatterjee, M. (1999). “ Temporal mechanisms underlying recovery from forward masking in multielectrode-implant listeners,” J. Acoust. Soc. Am. 105(3), 1853–1863. 10.1121/1.426722 [DOI] [PubMed] [Google Scholar]
- 7. Chatterjee, M. , Fu, Q. J. , and Shannon, R. V. (2000). “ Effects of phase duration and electrode separation on loudness growth in cochlear implant listeners,” J. Acoust. Soc. Am. 107(3), 1637–1644. 10.1121/1.428448 [DOI] [PubMed] [Google Scholar]
- 8. Chatterjee, M. , and Kulkarni, A. M. (2014). “ Sensitivity to pulse phase duration in cochlear implant listeners: Effects of stimulation mode,” J. Acoust. Soc. Am. 136(2), 829–840. 10.1121/1.4884773 [DOI] [PMC free article] [PubMed] [Google Scholar]
- 9. Chatterjee, M. , and Robert, M. E. (2001). “ Noise enhances modulation sensitivity in cochlear implant listeners: Stochastic resonance in a prosthetic sensory system?,” J. Assoc. Res. Otolaryngol. 2(2), 159–171. 10.1007/s101620010079 [DOI] [PMC free article] [PubMed] [Google Scholar]
- 10. Chatterjee, M. , and Shannon, R. V. (1998). “ Forward masked excitation patterns in multielectrode electrical stimulation,” J. Acoust. Soc. Am. 103(5), 2565–2572. 10.1121/1.422777 [DOI] [PubMed] [Google Scholar]
- 11. Chatterjee, M. , and Yu, J. (2010). “ A relation between electrode discrimination and amplitude modulation detection by cochlear implant listeners,” J. Acoust. Soc. Am. 127, 415–426. 10.1121/1.3257591 [DOI] [PMC free article] [PubMed] [Google Scholar]
- 12. Garadat, S. N. , and Pfingst, B. E. (2011). “ Relationship between gap detection thresholds and loudness in cochlear-implant users,” Hear. Res. 275, 130–138. 10.1016/j.heares.2010.12.011 [DOI] [PMC free article] [PubMed] [Google Scholar]
- 13. Garadat, S. N. , Zwolan, T. A. , and Pfingst, B. E. (2012). “ Across-site patterns of modulation detection: Relation to speech recognition,” J. Acoust. Soc. Am. 131, 4030–4041. 10.1121/1.3701879 [DOI] [PMC free article] [PubMed] [Google Scholar]
- 14. Hothorn, T. , Bretz, F. , and Westfall, P. (2008). “ Simultaneous inference in general parametric models,” Biom. J. 50(3), 346–363. 10.1002/bimj.200810425 [DOI] [PubMed] [Google Scholar]
- 15. Jesteadt, W. (1980). “ An adaptive procedure for subjective judgements,” Percept. Psychophys. 28(1), 85–88. 10.3758/BF03204321 [DOI] [PubMed] [Google Scholar]
- 16. Kang, S. Y. , Colesa, D. J. , Swiderski, D. L. , Su, G. L. , Raphael, Y. , and Pfingst, B. E. (2010). “ Effects of hearing preservation on psychophysical responses to cochlear implant stimulation,” J. Assoc. Res. Otolaryngol. 11, 245–265. 10.1007/s10162-009-0194-7 [DOI] [PMC free article] [PubMed] [Google Scholar]
- 17. Kirby, A. E. , and Middlebrooks, J. C. (2010). “ Auditory temporal acuity probed with cochlear implant stimulation and cortical recording,” J. Neurophysiol. 103(1), 531–542. 10.1152/jn.00794.2009 [DOI] [PMC free article] [PubMed] [Google Scholar]
- 18. Kral, A. , Hartmann, R. , Mortazavi, D. , and Klinke, R. (1998). “ Spatial resolution of cochlear implants: The electrical field and excitation of auditory afferents,” Hear. Res. 121(1), 11–28. 10.1016/S0378-5955(98)00061-6 [DOI] [PubMed] [Google Scholar]
- 19. Neff, D. L. (1985). “ Stimulus parameters governing confusion effects in forward masking,” J. Acoust. Soc. Am. 78(6), 1966–1976. 10.1121/1.392653 [DOI] [PubMed] [Google Scholar]
- 20. Neff, D. L. (1986). “ Confusion effects with sinusoidal and narrow-band noise forward maskers,” J. Acoust. Soc. Am. 79(5), 1519–1529. 10.1121/1.393678 [DOI] [PubMed] [Google Scholar]
- 21. Nelson, D. A. , and Donaldson, G. S. (2001). “ Psychophysical recovery from single-pulse forward masking in electric hearing,” J. Acoust. Soc. Am. 109(6), 2921–2933. 10.1121/1.1371762 [DOI] [PubMed] [Google Scholar]
- 22. Nelson, D. A. , and Donaldson, G. S. (2002). “ Psychophysical recovery from pulse-train forward masking in electric hearing,” J. Acoust. Soc. Am. 112(6), 2932–2947. 10.1121/1.1514935 [DOI] [PubMed] [Google Scholar]
- 23. Pfingst, B. E. , Burkholder-Juhasz, R. A. , Xu, L. , and Thompson, C. S. (2008). “ Across-site patterns of modulation detection in listeners with cochlear implants,” J. Acoust. Soc. Am. 123(2), 1054–1062. 10.1121/1.2828051 [DOI] [PMC free article] [PubMed] [Google Scholar]
- 24. Pfingst, B. E. , Colesa, D. J. , Hembrador, S. , Kang, S. Y. , Middlebrooks, J. C. , Raphael, Y. , and Su, G. L. (2011). “ Detection of pulse trains in the electrically stimulated cochlea: Effects of cochlear health,” J. Acoust. Soc. Am. 130, 3954–3968. 10.1121/1.3651820 [DOI] [PMC free article] [PubMed] [Google Scholar]
- 25. Pinheiro, J. , Bates, D. , DebRoy, S. , Sarkar, D. , and R Core Team (2014). “ nlme: Linear and nonlinear mixed effects models,” R package version 3.1-120, http://CRAN.R-project.org/package=nlme> (Last viewed 9/1/2016).
- 26.R Core Team (2014). “ R: A language and environment for statistical computing,” R Foundation for Statistical Computing, Vienna, Austria, http://www.R-project.org/ (Last viewed 9/1/2016).
- 27. Ramekers, D. , Versnel, H. , Strahl, S. B. , Klis, S. F. , and Grolman, W. (2015). “ Recovery characteristics of the electrically stimulated auditory nerve in deafened guinea pigs: Relation to neuronal status,” Hear. Res. 321, 12–24. 10.1016/j.heares.2015.01.001 [DOI] [PubMed] [Google Scholar]
- 28. Rebscher, S. J. , Hetherington, A. , Bonham, B. , Wardrop, P. , Whinney, D. , and Leake, P. A. (2008). “ Considerations for the design of future cochlear implant electrode arrays: Electrode array stiffness, size and depth of insertion,” J. Rehabil. Res. Dev. 45(5), 731–748. 10.1682/JRRD.2007.08.0119 [DOI] [PMC free article] [PubMed] [Google Scholar]
- 29. Robert, M. E. (2002). House Ear Institute Nucleus Research Interface User's Guide ( House Ear Institute, Los Angeles, CA: ), pp. 1–45. [Google Scholar]
- 30. Shannon, R. V. (1990). “ Forward masking in patients with cochlear implants,” J. Acoust. Soc. Am. 88(2), 741–744. 10.1121/1.399777 [DOI] [PubMed] [Google Scholar]
- 31. Shannon, R. V. , Adams, D. D. , Ferrel, R. L. , Palumbo, R. L. , and Grandgenett, M. (1990). “ A computer interface for psychophysical and speech research with the Nucleus cochlear implant,” J. Acoust. Soc. Am. 87(2), 905–907. 10.1121/1.398902 [DOI] [PubMed] [Google Scholar]
- 32. Shannon, R. V. , and Otto, S. R. (1990). “ Psychophysical measures from electrical stimulation of the human cochlea,” Hear. Res. 47, 159–168. 10.1016/0378-5955(90)90173-M [DOI] [PubMed] [Google Scholar]
- 33. Srinivasan, A. G. , Shannon, R. V. , and Landsberger, D. M. (2012). “ Improving virtual channel discrimination in a multi-channel context,” Hear. Res. 286, 19–29. 10.1016/j.heares.2012.02.011 [DOI] [PMC free article] [PubMed] [Google Scholar]
- 34. Tukey, J. W. (1977). Exploratory Data Analysis ( Addison-Wesley, Reading, MA: ). [Google Scholar]
- 35. Zhou, N. , and Pfingst, B. E. (2016). “ Evaluating multipulse integration as a neural-health correlate in human cochlear-implant users: Relationship to forward-masking recovery,” J. Acoust. Soc. Am. 139(3), EL70–EL75. 10.1121/1.4943783 [DOI] [PMC free article] [PubMed] [Google Scholar]
- 36. Zhu, Z. , Tang, Q. , Zeng, F.-G. , Guan, T. , and Ye, D. (2012). “ Cochlear-implant spatial selectivity with monopolar, bipolar and tripolar stimulation,” Hear. Res. 283, 45–48. 10.1016/j.heares.2011.11.005 [DOI] [PMC free article] [PubMed] [Google Scholar]


