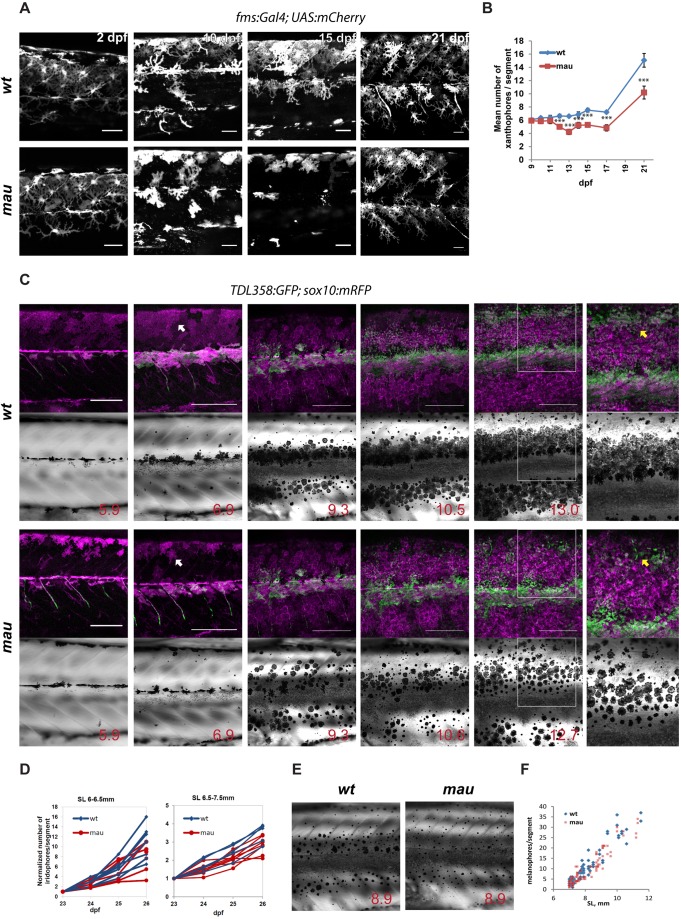
Fig. 5.
Development of the mau phenotype in aqp3atVE1/tVE1. (A) Xanthophores labelled by Tg(fms:GAL4; UAS:mCherry) in wild-type and in aqp3atVE1/tVE1 (mau) larvae. By 15 dpf, the numbers and the area covered by xanthophores are reduced in the mutants, but xanthophores later recover. (B) Numbers of xanthophores per segment in the mid-trunk of pre-metamorphic fish (n=8-10 fish); data points represent mean±s.e.m. ***P<0.0001, unpaired t-test. (C) Representative example of recurrent imaging of individual fish carrying Tg(TDL358:GFP) (green, labelling iridophores) and Tg(sox10:mRFP) (magenta, labelling all the pigment cells) in wild type and in mau. Standard length (SL) is indicated. White arrows point to contracted xanthophores [labelled in mau, Tg(sox10:mRFP)], whereas the wild-type xanthophores are spread and cover the entire flank of the fish. Yellow arrows indicate the position of the second light stripe. In mau, iridophores are present in the area but fail to form a continuous light stripe. (D) Increase in iridophore numbers per segment over the course of 4 days. The quantifications were obtained from recurrent imaging in the mid-trunk segments of the fish during the initial formation of the light stripe (SL 6-6.5 mm), and upon completion of the first light stripe (SL 6.5-7.5 mm). (E) mau melanophores are scattered and not confined to the dark stripe region. (F) Numbers of flank melanophores per segment in the mid-trunk (two segments above the anus) imaged in metamorphic wild-type and mau fish. Each data point represents the number of melanophores in one segment. Scale bars: 50 µm in A; 250 µm in C.

