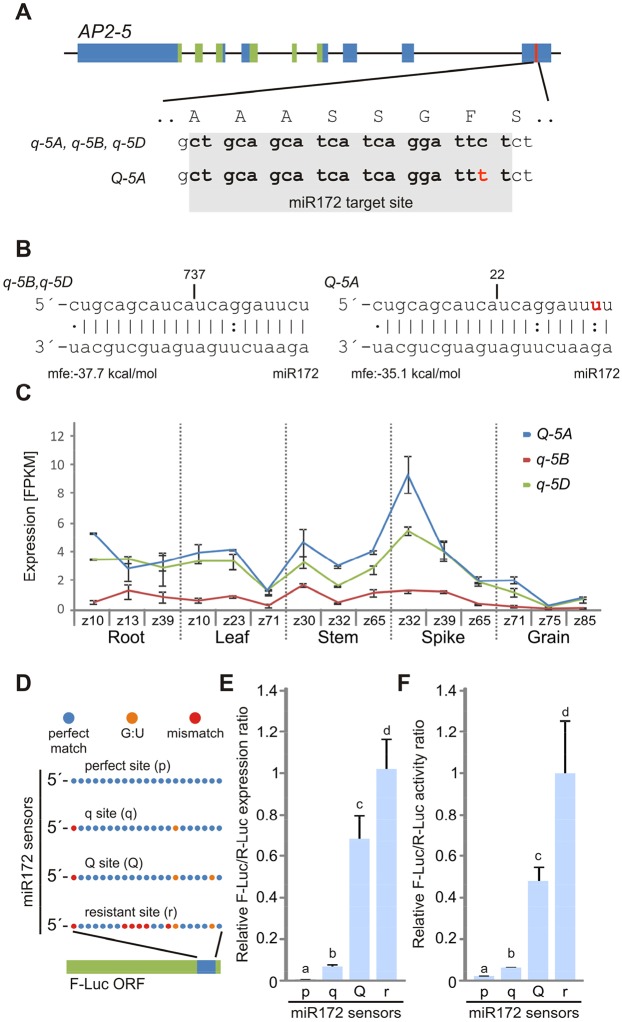
Fig. 1.
The Q allele has a weaker miR172 target site than the q allele. (A) Genomic structure of the wheat AP2-5 gene and sequence variation at the miR172 target site between Q and q alleles in different homoeologs. The regions encoding the AP2 domains are indicated in green and the miR172 target site is in red. The q alleles in the three wheat homoeologs harbor identical miR172 target sites. The single nucleotide polymorphism in the Q-5A allele is indicated in red. (B) Schematic representation of the interaction between miR172 and q/Q target sites. The 5′ ends of the degradome products are indicated at the top by a vertical line along with the number of detected reads. The predicted energy of the interactions is indicated beneath the sequences. mfe, minimum free energy (see the supplementary Materials and Methods). (C) Expression of AP2-5 homoeologs in different tissues and developmental stages from hexaploid wheat. z, Zadoks scale (Zadoks et al., 1974). (D) Schematic of firefly luciferase sensors (F-Luc) with different miR172 target sites, with red indicating a mismatch, orange a G:U interaction and blue a perfect match with miR172 within the target site. (E,F) N. benthamiana leaves were co-infiltrated with F-Luc sensors and a vector overexpressing miR172. Renilla luciferase (R-Luc) was used as an internal control. Expression was first normalized to R-Luc and then adjusted using the miR172-resistant sensor. (E) Relative transcript levels of each F-Luc sensor estimated by qRT-PCR. (F) Relative luciferase activity of each F-Luc sensor. Bars represent mean±s.e.m. of six (qPCR) and three (luciferase) replicates, and different letters on top indicate statistically significant differences (P<0.05) by non-parametric Student–Newman–Keuls test.

