

Abstract
Background
The current study examined independent and interactive effects of polymorphisms of the mu opioid receptor gene (OPRM1, A118G) and variable number tandem repeats of the dopamine transporter gene (DAT1, SLC6A3) on alcohol consumption and subjective responses to alcohol in 127 young, healthy, social drinkers.
Methods
Participants completed an in-person assessment, which included self-reported alcohol drinking patterns and blood sampling for DNA, and in a second visit, a cumulative alcohol dosing procedure with subjective ratings across multiple time points and breath alcohol concentrations (0.03–0.1%). DNA was analyzed for OPRM1 AA vs. AG/GG (*G) genotypes, DAT1 10-repeat allele (A10) vs. 9 or lesser alleles (A9), and ancestral informative markers.
Results
There were significant epistatic interactions between OPRM1 and DAT1 genotypes. Subjective high assessment scale scores after alcohol consumption were highest in *G and A9 carriers, and lowest in *G and A10 carriers. Negative subjective effects were also highest in *G and A9 carriers. Effects were similar in a sensitivity analysis limited to Caucasian subjects. There were independent and epistatic interactions on drinking. The OPRM1 *G allele was independently associated with fewer heavy drinking days. The A9 allele was associated with a greater number of drinking days, which was attenuated in carriers of the *G allele.
Conclusions
These findings highlight the biological importance of interactions between these two genes, and interactions between brain opioid and dopamine systems.
Keywords: Alcohol, mu opioid receptor gene, dopamine transporter gene, polymorphism, intermediate phenotype, A118G
Introduction
Alcohol use disorder (AUD) has a strong genetic component with heritability estimates of about 50% (Oroszi and Goldman, 2004). AUD is polygenetic, with many genes likely contributing to AUD risk in different individuals, in different ways, and in interaction with the environment (Buhler et al., 2015). One strategy for increasing our understanding of genetic risk factors involved in AUD is the use of intermediate phenotypes for specific traits associated with the disorder. Intermediate phenotypes are those that: 1) are associated with risk for the disorder, 2) are associated with causes rather than effects of the disorder, 3) vary continuously in the general population, and 4) are detectable in unaffected family members of individuals with the disorder associated with that phenotype (Bearden and Freimer, 2006). The strength of studying intermediate phenotypes is that they may be less polygenic, and closer in proximity to genetic effects; this should increase statistical power to find gene associations with individual traits associated with AUD. Level of alcohol response meets basic criteria for an intermediate phenotype, and, as a result, alcohol administration under controlled human laboratory conditions is a useful tool to explore this genetic contribution to AUD risk (Salvatore et al., 2015).
One of the most common variants encoding the mu opioid receptor gene (OPRM1, gene ID 4988,) is a non-synonymous single nucleotide polymorphism (A118G SNP, rs1799971) (Bond et al., 1998). In vitro studies have shown that the minor allele (G) of this SNP is associated with a three-fold increase in binding affinity for the endogenous opioid peptide beta-endorphin (Bond et al., 1998), reduced receptor expression (Zhang et al., 2005), lower level of receptor glycosylation and a reduced receptor half-life (Wang et al., 2012). In vivo human PET imaging studies by our laboratory and others have corroborated the in vitro findings demonstrating that G allele carriers have lower mu-opioid receptor binding than AA homozygotes in alcohol dependent and healthy controls (Weerts et al., 2013), and in smokers and healthy controls (Ray et al., 2011). This SNP has been associated with AUD in some populations (Setiawan et al., 2012), and in some laboratory alcohol administration studies, G allele carriers showed increased subjective responses to alcohol consumption, enhanced reactivity to alcohol cues, and greater sensitivity to naltrexone reducing these effects (Ray and Hutchison, 2004, Ray and Hutchison, 2007, van den Wildenberg et al., 2007)
As reviewed by Gardner (2011), the primary reward circuitry consists of an ‘in-series’ circuit linking the ventral tegmental area, nucleus accumbens and ventral pallidum via the medial forebrain bundle. The mesolimbic dopamine (DA) circuits include DAergic projections from the ventral tegmental area and substantia nigra to the ventral striatum (which contains the nucleus accumbens), limbic structures (amygdala, hippocampus, cingulate), and frontal cortex. The nucleus accumbens receives inputs from the prefrontal cortex, amygdala and hippocampus. In addition, the ventral striatum projects to the ventral pallidum and to the ventral tegmental area and substantia nigra, which, project back to the prefrontal cortex, via the medial dorsal nucleus of the thalamus (Haber and Knutson, 2010). Activation of mu opioid receptors in the ventral tegmental area, or activation of mu opioid and delta opioid receptors via release of beta-endorphin and enkephalin in the nucleus accumbens increases extracellular DA in the nucleus accumbens (Gianoulakis, 2009). DAergic neurotransmission in the ventral striatum is also modulated via opioid peptide inputs in the hypothalamus. These interactions between opioid peptides and DA in the mesocorticolimbic circuit are thought to contribute to the rewarding effects of alcohol and the persistence of alcohol craving and consumption (for review see Oswald and Wand, 2004).
One possible source of the variability in prior studies examining the role of the A118G SNP in alcohol effects is a functional interaction between the A118G SNP and dopamine transporter gene (DAT1, gene ID SLC6A3) (Anton et al., 2012). The rationale for focusing on the DA transporter is its role in the regulation of DAergic transmission by clearing DA via uptake from the synaptic cleft. The DAT1 gene is located on chromosome 5q15.3 and contains a 40-base-pair variable number tandem repeat (VNTR) in the 3′ untranslated region (Vandenbergh et al., 1992). A common VNTR polymorphism in DAT1 results in alleles with 10 and with 9 or lesser VNTRs (rs28363170). The 10-repeat allele (A10) is associated with higher DAT1 expression in the striatum than 9- or lesser-repeat alleles (A9), suggesting higher synaptic DA in A9 carriers (Heinz et al., 2000). The A9 has been associated with AUD (Bhaskar et al., 2012), and more severe alcohol-withdrawal symptoms (van der Zwaluw et al., 2009).
Indeed, there is some evidence for functional interactions of the OPRM1 gene and the DA system. In human PET studies, striatal DA response to alcohol administration was limited to OPRM1 G carriers (Ramchandani et al., 2011); a similar response to smoked nicotine was observed (Domino et al., 2012). These studies did not evaluate DAT1 A9 vs A10 genotypes. Two recent exploratory studies provide some evidence for epistatic interactions between these two polymorphisms. Specifically, non-treatment seeking alcoholics who were carriers of both OPRM1 AA and DAT1 A9 alleles showed greater alcohol-induced stimulation to oral alcohol administration in a lab-bar, and improved drinking outcomes in response to naltrexone treatment (Anton et al., 2012). The second study in non-treatment seeking heavy drinkers reported that OPRM1 G carriers who were also DAT1 A10 homozygotes had steeper increases in alcohol-induced stimulation and vigor (Ray et al., 2014). Clearly, additional studies are needed to understand the independent vs. epistatic effects of DAT1 and OPRM1 genotypes.
Building on this prior research the current study focused on whether DAT1 A9 and A10 genotypes independently or in epistatic interaction with the OPRM1 G-allele influence alcohol consumption, and subjective responses to orally administered alcohol in young, healthy, social drinkers. Our choice of candidate genotypes was based on 1) the well-established interactions between opioidergic and DAergic systems, 2) the demonstrated functional significance of the A118G SNP and the DAT VNTRs, and 3) prior exploratory studies showing epistatic interactions between OPRM1*G and DAT A9 vs A10 alleles. The two prior studies (Anton et al., 2012, Ray et al., 2014) selected subjects based on prospectively determined A118G genotype, and then completed retrospective DAT1 genotyping on the selected subjects. To better understand of the role of DAT1 A9 vs A10 alleles in alcohol response, and examine epistatic interactions with OPRM1*G alleles, subjects in the current study were genotyped for both DAT1 (A9 vs A10) and OPRM1 (AA vs *G) genotypes after completion of the alcohol sensitivity sessions. We opted to study social drinkers rather than persons with AUD to minimize the effects of heavy alcohol exposure on outcome measures. Our apriori hypotheses were 1) DAT1 A9 carriers would show greater negative subjective effects of alcohol than A10 carriers independent of OPRM1 genotype, 2) that increased positive and stimulant subjective responses to alcohol in OPRM1 *G carriers would be dependent upon DAT1 A9 vs. A10 genotype. Since alcohol sensitivity differs depending on intensity and frequency of alcohol drinking, we also examined whether there were independent or epistatic genotype effects on self-reported measures of drinking outside the laboratory.
Materials and Methods
Subjects
Male and female healthy volunteers between the ages of 21 and 30 were recruited for participation via newspaper, radio and other advertisements from the greater Baltimore area. Subjects who appeared to qualify for research participation based on a telephone screen were invited for an interview. Subjects provided written informed consent using a Johns Hopkins Institutional Review Board approved informed consent document and then completed an in-person assessment interview with a Masters-level research assistant with experience in administrating structured diagnostic interviews. The interview included the Mini-International Neuropsychiatric Interview (M.I.N.I.) (Sheehan et al., 1998) and/or the Semi-Structured Assessment for the Genetics of Alcoholism (SSAGA)(Bucholz et al., 1994) to assess the presence or absence of drug and alcohol problems as well as other Axis I DSM IV disorders. Subjects completed a medical examination, with standard laboratory tests (i.e., complete blood count, comprehensive metabolic panel, and urinalysis), and an alcohol breathalyzer test and urine toxicology screen. Recent patterns of alcohol consumption were determined via the 90-day Time Line Follow Back (TLFB) (Sobell and Sobell, 1992) administered by research staff who complete rigorous training and are recertified on the instrument at 6-month intervals. Subjects were excluded from study participation if they met current or lifetime DSM-IV diagnostic criteria for either drug or alcohol abuse or dependence, met current or lifetime DSM-IV diagnostic criteria for any Axis I disorder, had a positive urine drug toxicology test or urine pregnancy test (females) at screening or on test days, or had any ongoing health problems.
To minimize adverse reactions to alcohol administration, nondrinkers were excluded from study participation, and female and male participants met the following inclusion and criteria: report drinking at least two and three standard drinks, at least twice a month on the TLFB, and indicate some binge drinking (4 or more, or 5 or more drinks per occasion) respectively, in their past. Subjects whose weekly average alcohol intake exceeded NIAAA recommendations (i.e., >7 drinks/week for women or >14 drinks/week for men) were excluded. Additional exclusion criteria were: (a) smoking 3 or more cigarettes per day, (b) current use of prescription medications and/or use of psychoactive medications within the past 90 days, (c) treatment in the last 6 months with antidepressants, neuroleptics, sedative hypnotics, glucocorticoids, appetite suppressants, opiates, or DA medications. A total of 145 subjects completed the alcohol sensitivity sessions. The Johns Hopkins Institutional Review Board approved all procedures.
Laboratory Alcohol Sensitivity Procedures
On the session day, subjects arrived in the morning (9 am) and completed a urine toxicology screen, alcohol breathalyzer test, and urine pregnancy test; all individuals who participated in the study had negative findings. Subjects consumed a standardized 300 calorie breakfast and lunch to control for possible dietary effects on alcohol absorption, and completed within-session cumulative alcohol dosing (CAD) and a battery of subjective response instruments (see below). Breakfast was consumed two hrs. before the placebo drink, and lunch was consumed 45 min after the last alcohol drink (see below). Subjects were in a quiet laboratory room, and carefully monitored throughout the session. Following completion of the laboratory session, all subjects were admitted to the Johns Hopkins Clinical Research Unit for monitoring of any alcohol reactions. Subjects were discharged the following morning as approved by the study physician.
Cumulative Alcohol Dosing (CAD)
CAD was initiated between 11am and 12pm. Subjects consumed 1 placebo drink followed by 3 active alcohol drinks administered at 45-min intervals to progressively increase breath alcohol content (BAC) (0.03–0.1%) over 2 hrs. A terminal BAC of 0.1% was selected based on our experience in previous studies (Turkkan et al., 1988, Uhart et al., 2013), and to target BAC reached during binge/heavy drinking. Doses for each subject were determined using a Computerized Blood Alcohol Calculator (Fisher et al., 1987) which adjusts for age, height, weight, gender differences in body water, and time spent drinking, to target similar BAC in males and females. The Johns Hopkins Investigational Drug Services prepared each 120 mL drink by mixing the appropriate mL of 95% ethanol (Spectrum Chemicals) in calorie-free Cherry Kool-Aid using a w/v metric. A placebo drink was utilized in order to account for expectation of alcohol effects that are independent of pharmacological effects of alcohol. Subjects were blind to the drink contents and were told “During the session you will receive alcohol drinks or placebo drinks. Drinks may contain different amounts of alcohol”. All drinks were blinded by floating 1 mL ethanol on top of the drink and by placing an ethanol-soaked wristband around the glass to deliver a strong alcohol odor. Subjects were instructed to sip each drink over a 10-min period, and were monitored by staff to ensure compliance. Medical personnel were available, if any adverse effects occurred (e.g., vomiting, dizziness). Early stopping rules were in effect; subjects could refuse drinks at any time, and additional drinks would not be administered if maximum BAC (0.1%) was reached, or adverse effects occurred. In the current study, none of the sessions was terminated early due to adverse effects, elevated BAC, or subject refusal of drinks.
Determination of Breath Alcohol Content (BAC)
BAC was measured 15 minutes after consumption of placebo (+25) and each alcohol drink (+ 70, +115, +160) and then at 45 min intervals (+205, +250, + 295) until the end of the session using an Alco-Sensor IV Instrument (Intoximeters Inc., St Louis, MO). BAC results were not viewable by the participant, and they were not informed of BAC results.
Subjective response Assessment Instruments
During the alcohol sensitivity procedure, subjects completed the Biphasic Alcohol Effects Scale (BAES) (Martin et al., 1993), the 13-item Subjective High Assessment Scale (SHAS) (Schuckit, 1980), Profile of Mood State Tension and Anxiety (POMS-TA) subscale (McNair et al., 1992), and the Drug Effects Questionnaire Visual Analog Scale (DEQ VAS) (McCaul et al., 1990, Preston and Bigelow, 1991) using a laptop computer (see Supplemental Methods A.). For all instruments, subjects rated each item on how they felt “right now” at eight time points over a 5-hr period: at baseline (−25 min), five minutes after consumption of the placebo drink (+15), and each alcohol drink (+60, +105, +150 min), and at 45-minute intervals for the remainder of the session (+195, +240, +285 min).
Genotyping and Ancestry Informative markers (AIM)
A total of 85 males and 42 females (n=127) completed the alcohol sensitivity sessions, consented to genetic sampling, and had adequate material for genotyping; Thirty-six of these subjects were included in a previous study (Uhart et al., 2013), which was completed using the same procedures, at the same site, with the same investigative team, and the same inclusion/exclusion criteria. Procedures for genotyping are in Supplemental Methods B. Based on known race/ethnicity differences in genotype frequency distributions (Chen et al., 2012), we determined genetic ancestry for each subject using AIM determined from a panel of 96 markers using GoldenGate Genotyping Assay (Mahon et al., 2013) and a set of 22 microsatellite markers, with allele 1 and allele 2 plus Duff-ag, which have a high efficiency at clustering individuals into population subgroups. Data were analyzed using Structure (v.2.3.2) (Stephens et al., 2012), and assumed a model with the possibility of admixture and correlated allele frequencies between populations; all other parameters were kept at their default values. In order to increase the accuracy of inferred genetic ancestry, the AIMs were used to generate component coordinates (C1 and C2) using a large data set (n=546), which included participants for the current study as well as other research participants who completed genotyping procedures for other studies conducted in our laboratory. Individual C1 and C2 coordinates were included in our statistical models as covariates.
OPRM1 A118G SNP genotypes in our sample included A/A (n=94), A/G (n=31) and G/G (n=2). In these same subjects, DAT1 VNTR included 10/10 (n=63), 10/9 (n=50), 10/<9 (n=3), 9/9 (n=9) and <9/<9 (n=2). The frequency of the OPRM1 A allele was 219 (86.2%), and the G allele frequency was 35 (13.8%). DAT1 A10 frequency was 179 (70.5%) and DAT1 A9 frequency was 75 (29.5%). Hardy–Weinberg tests indicated OPRM1 and DAT1 genotype frequencies were in equilibrium. The expected Hardy-Weinberg frequencies are 94.4, 30.2, and 2.4 for OPRM1. The expected Hardy-Weinberg frequencies for DAT1 are 63.1, 52.9, and 11.1, respectively. The p-values were 0.759 for OPRM1 genotypes and 0.975 for DAT1 genotypes.
Statistical Analyses
The choice of statistical modeling was based on distribution of the data, and the assumptions of the statistical test. For all analyses, DAT1 genotype groups were carriers of 9 or less VNTR alleles (10/9, 10/<9, 9/9, and <9/<9) which were grouped together as A9, and 10 VNTR allele homozygotes (10/10) were grouped together as A10. For OPRM1, heterozygote (A/G) and homozygote (G/G) G-allele carriers were grouped together as *G and A allele homozygotes (A/A) were grouped together as AA. We tabulated the number of participants in each combined genotype subgroup: DAT1 A9/OPRM1*G, DAT1 A10/OPRM1*G, DAT1 A9/OPRM1 A/A, DAT1 A10/OPRM1 A/A. Chi-square test results didn’t show dependence between the frequency of the polymorphisms of the two genes ( = 0.065, p=0.799). That is, presence of one genotype did not predict presence of any other genotype.
We then examined whether OPRM1 and DAT1 genotypes, alone or in interaction with each other, were associated with differences in recent alcohol consumption or subjective effects of alcohol in the CAD procedure. Drinking data was not normally distributed across the 90-day period of the TLFB. We did not use log-transformations, as these do not address the bound range (0–90) and non-drinking days (0 drinks) do not transformed properly. Instead, we constructed three generalized linear regression models (GLRM) to examine three main TLFB measures: 1) average standard drinks per drinking day, 2) number of drinking days, and 3) number of heavy drinking days (i.e., 4 or more drinks for women and 5 or more drinks for men). Assuming the probability of a participant having a drink on any given day remains the same during the 90 day period, the total number of drinking days follows a binomial distribution (e.g., non-drinking day=0, drinking day=1). The same assumption and modeling was applied to number of heavy drinking days to determine the relative risk. The number of drinks per drinking day is counting data, and was modeled using a GLRM with Poisson distribution using log link function (Nelder and Wedderburn, 1972, Kiernan et al., 2011) to determine the odds ratio. The independent variables included in the models were OPRM1 genotype, DAT1 genotype, and their interaction term, sex, AIM components (C1, C2) and their interaction term; sex and AIM components were included in the model to control for known sex and ancestral origin differences (covariates). The adjusted least square mean odds ratio (number of drinking days and number of heavy drinking days) or relative risk (number of drinks per drinking day) were calculated between genotypes and the interaction terms.
We further tested if CAD subjective measures were associated with OPRM1 and DAT1 polymorphisms. We constructed mixed-effect models with random intercept. The dependent variables in these models were BAES stimulation subscale, BAES sedation subscale, positive effects on DEQ VAS, and negative effects on DEQ VAS, SHAS score, and POMS-TA subscale. The independent variables included DAT1 genotype (A10 vs A9), OPRM1 genotype (AA vs *G), and time, as categorical variables; 2-order and 3-order interactions between DAT1 genotype, OPRM1 genotype, and time were also included in the model. Since there were genotype differences on pre-assessment TLFB drinking (see results), we included number of drinking days in all subsequent models as a covariate. Other covariates included were sex and AIM component values (C1, C2). We also compared the BAC peak and area under the curve (AUC) between the genotypes using GLRM.
For all analyses, we were testing specific hypotheses, and models were solved using SAS 9.4 mixed procedure. Specifically, DAT1 genotype, OPRM1 genotype, their interaction terms and covariates were all included in the models; we tested whether DAT1 and OPRM1 genotype independently or in epistatic interaction predicted subjective response scores on the SHAS, BAES stimulation and sedation subscales, DEQ VAS positive and negative effects subscales, and TLFB drinking measures (number of drinking days, number heavy drinking days and average drinks per drinking day). We ran full diagnosis on all the statistical models included in this manuscript to make sure all mathematical assumptions for the models were met and the models were valid. Significance level was set at P= 0.05, uncorrected. We were testing multiple correlated hypotheses, under carefully controlled testing conditions and number of subjects tested; given our sample size, we felt a Bonferroni correction would be too conservative for this exploratory analysis.
Results
Participant characteristics
Study subjects were young adult (mean age 24.3 years) males (66.9%) and females (33.1%), who were primarily Caucasian (72.4%) and were non-smokers (93.7%) or light smokers (< 2 days/week). There were no significant differences in demographic variables across genotype groups or subgroups with the exception of significant effects of self-reported race on the distribution of OPRM1 genotype, and OPRM1 × DAT1 subgroups (Table 1a, b). As shown in Figure S1, the distribution of AIM component scores (C1, C2) for individual subjects and self-reported race revealed three population clusters which generally aligned with the three primary self-reported race categories (Caucasian/white, African American/Black, and Asian). Since some individuals C1, C2 coordinates differed from their self-reported race, C1, C2 values were included in all statistical models to adjust for genetic race/ancestral differences.
Table 1.
Demographics of study subjects (n=127). A. Number (n) and percentage (%) of subjects per group by gender, self-reported race and smoking status. B. Group means (standard deviation, SD) for age, education, and cigarette use. C. Group mean (SD) patterns of alcohol use reported on the 90-day time line follow back (C). P shows level significance for group comparisons for Sections A and B. For Section C, DD=drinking day, HDD=heavy drinking day.
| ALL | DAT1
|
OPRM1
|
DAT1 & OPRM1
|
||||||||||
|---|---|---|---|---|---|---|---|---|---|---|---|---|---|
| A10 | A9 | P | AA | AG/GG | P | A10 & AA | A10 &*G | A9 & AA | A9 & *G | P | |||
|
A. N (%) per group
| |||||||||||||
| Sex: | |||||||||||||
| Male | 85 (66.9) | 41 (65.1) | 44 (68.8) | 60 (63.8) | 25 (75.8) | 27 (58.7) | 14 (82.4) | 33 (68.8) | 11 (68.8) | ||||
| Female | 42 (33.1) | 22 (34.9) | 20 (31.3) | 0.66 | 34 (36.2) | 8 (24.2) | 0.21 | 19 (41.3) | 3 (17.7) | 15 (31.3) | 5 (31.3) | 0.357 | |
| Race: | |||||||||||||
| Asian | 10 (7.9) | 5 (3.9) | 5 (3.9) | 2 (1.6) | 8 (6.3) | 1 (2.2) | 4 (23.5) | 1 (2.1) | 4 (25.0) | ||||
| AA | 20 (15.8) | 13 (10.2) | 7 (5.5) | 20 (15.8) | 0 (0) | 13 (28.3) | 0 (0.0) | 7 (14.6) | 0 (0.0) | ||||
| White | 92 (72.4) | 42 (33.1) | 50 (39.4) | 69 (54.3) | 23 (18.1) | 30 (65.2) | 12 (70.6) | 39 (81.3) | 11 (68.8) | ||||
| Other | 5 (3.9) | 3 (2.4) | 2 (1.6) | 0.416 | 3 (2.4) | 2 (1.6) | <0.001 | 2 (4.4) | 1 (5.9) | 1 (2.1) | 1 (6.3) | <0.001 | |
| Smoking status: | |||||||||||||
| Non-smokers1 | 119 (93.7) | 59 (93.7) | 60 (93.8) | 88 (93.6) | 31 (93.9) | 43 (93.5) | 16 (94.1) | 45 (93.8) | 15 (93.8) | ||||
| Smoker2 | 7 (5.5) | 3 (4.8) | 4 (6.3) | 6 (6.4) | 1 (3.0) | 3 (6.5) | 0 (0.0) | 3 (6.3) | 1 (6.3) | ||||
| Unknown | 1 (0.1) | 1 (1.6) | 0 (0.0) | 1.0 | 0 (0) | 1 (3.0) | 0.232 | 0 (0.0) | 1 (5.9) | 0 (0.0) | 0 (0.0) | 0.474 | |
|
B. Group Means (SD)
| |||||||||||||
| Age | 24.3 (2.6) | 24.0 (2.7) | 24.6 (2.6) | 0.259 | 24.4 (2.5) | 24.1 (3.0) | 0.628 | 23.9 (2.5) | 24.4(3.3) | 24.8 (2.5) | 23.8 (2.8) | 0.292 | |
| Education | 15.4 (1.3) | 15.2 (1.2) | 15.5 (1.4) | 0.170 | 15.4 (1.3) | 15.3 (1.3) | 0.807 | 15.2 (1.2) | 15.4(1.2) | 15.6 (1.4) | 15.3 (1.4) | 0.328 | |
| # of cigs per smoking day3 | 1.13 (0.35) | 1.0 (0) | 1.25 (0.5) | 0.391 | 1.14 (0.38) | 1.0 (—) | 0.721 | 1.0 (0) | — (—) | 1.33 (0.5) | 1.0 (—) | 0.605 | |
|
C. Group Mean (SD) Alcohol Use Reported in the 90-day Time Line Follow Back4:
| |||||||||||||
| # of DD | 20.5 (12.5) | 17.5 (10.6) | 23.5 (13.6) | — | 21 (12.9) | 19.5 (11.6) | — | 17.1 (9.8) | 18.4 (12.6) | 24.5 (14.4) | 20.6 (10.7) | — | |
| # of HDD | 3.7 (4.1) | 3.4 (3.3) | 3.9 (4.8) | — | 4.1 (4.4) | 2.6 (2.7) | — | 3.9 (3.4) | 2.3 (2.7) | 4.3 (5.3) | 2.9 (2.6) | — | |
| # of drinks per DD | 3.2 (1.5) | 3.5 (1.6) | 2.9 (1.4) | — | 3.2 (1.6) | 3.0 (1.1) | — | 3.5 (1.7) | 3.4 (1.2) | 3.0 (1.5) | 2.5 (0.8) | — | |
Defined no current smoking and has not smoked 100 cigarettes in lifetime as reported on the SSAGA.
Defined as having smoked more than 100 cigarettes in lifetime determined as reported on the SSAGA, and any current smoking. One subject met criteria for life-time nicotine dependence on the SSAGA.
Data for cigarettes per smoking day are for current smokers only (N=7). Individuals currently smoking 3 or more cigarettes per smoking day were excluded from study participation (exclusion criteria)
Drinking data were not normally distributed. See Table 2 for odds ratio and relative risk analysis results.
Recent alcohol drinking patterns
Table 1c shows pattern of alcohol drinking as reported on the TLFB at assessment. Using the GLRM for genotype groups and their interaction for the three 90-day TLFB drinking measures, significant genotype and epistatic interactions for DAT1 and OPRM1 were found. The odds ratio of reporting more drinking days was significantly greater for A9 carriers vs A10 carriers (Table 2a). There was, however, a significant epistatic interaction, where OPRM1 *G allele appeared to attenuate the effects of the DAT1 A9 on number of drinking days (Table 2a). As shown in Table 2b, the relative risk for drinks per drinking day did not show significant differences between genotype groups. As shown in Table 2c, the odds ratio of heavy drinking days was significantly lower for OPRM1 *G carriers than for OPRM1 AA. There were no epistatic interactions between OPRM1 and DAT1 on number of heavy drinking days. Sex, which was included in all models as an apriori decision, was significant for number of drinking days (p=0.001), number of heavy drinking days (p=0.004) and number of drinks per drinking day (p=0.008).
Table 2.
Analyses of odds ratio and relative risk were based on binominal distribution of drinking data as reported in the 90-day TLFB interview at assessment. The GLRM included OPRM1 genotype, DAT1 genotype groups, and their interaction terms, and adjusted for sex, and ancestral origin (C1,C2 coordinates). Results shown are the significance level (P) and the odds ratio (95% confidence interval, CI) or relative risk (95% confidence interval, CI) for (A) number of drinking days, (B) drinks per drinking day, and (C) number of heavy drinking days. The genotypes listed in the first column of the interaction terms specifies the direction of interaction. The values in the last column of the same row represent magnitude of the interaction.
| A. Number of Drinking Days | P | Odds ratio (95% CI) |
|---|---|---|
| DAT1 A9 vs A101 | = 33.28, p = <0.001 | 1.356 (1.222, 1.503) |
| OPRM1 *G vs AA2 | = 2.57, p = 0.110 | 0.913 (0.817, 1.021) |
| DAT1 A9 × OPRM *G3 | = 5.51, p = 0.019 | 0.781 (0.635, 0.960) |
| B. Drinks per Drinking Day | P | Relative risk (95% CI) |
|
| ||
| DAT1 A9 vs A101 | = 3.37, p =0.068 | 0.804 (0.637, 1.016) |
| OPRM1 *G vs AA2 | = 0.8, p = 0.375 | 0.891 (0.689, 1.151) |
| DAT1 A9 × OPRM1 *G3 | = 0.15, p = 0.703 | 0.913 (0.572, 1.457) |
| C. Number of Heavy Drinking Days | P | Odds ratio (95% CI) |
|
| ||
| DAT1 A9 vs A101 | = 1.86, p = 0.174 | 1.185 (0.928, 1.512) |
| OPRM1 *G vs AA2 | = 21.24, p = <0.001 | 0.545 (0.415, 0.715) |
| DAT1 A9 × OPRM1 *G3 | = 0.70, p = 0.402 | 1.231 (0.757, 2.004) |
DAT1 A10 is the reference group.
OPRM1 AA is the reference group.
DAT1 A9 × OPRM1 *G is reference subgroup in comparison to each of the other 3 genotype subgroups (DAT1 A9 × OPRM1 AA, DAT1 A10 × OPRM1 AA, DAT1 A10 × OPRM1 *G)
Reference groups for each row are indicated in the footnotes. Significant p are in BOLD text
Breath Alcohol Content (BAC)
As shown in figure 1, BAC during the CAD followed a typical inverted U-shape function, and target BAC was reached (group mean ± SD = 0.105% ±0.2% BAC). There were no genotype differences in peak BAC or in area under the dose effect curve.
Figure 1.
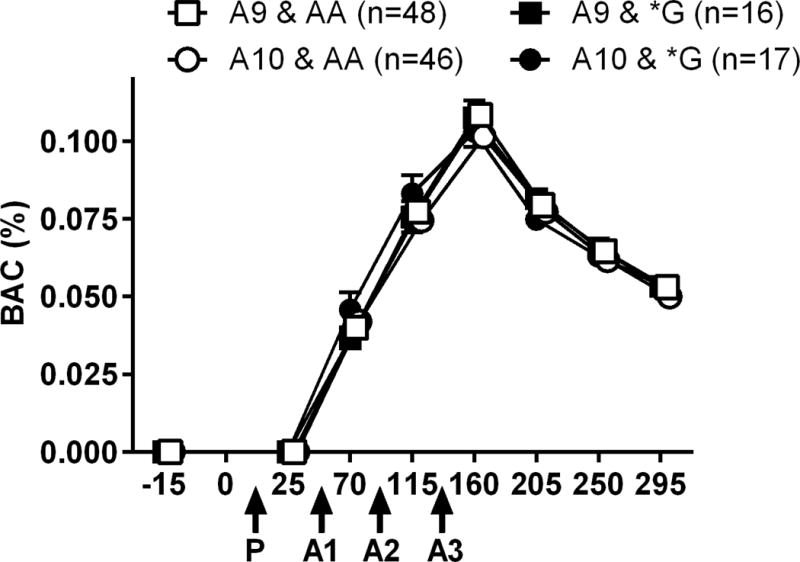
Breath Alcohol Content (BAC) during the cumulative alcohol dosing procedure. Data are mean +SEM BAC for each genotype subgroup as determined at baseline, 15 min after consumption of each drink, and at 45-minute intervals for the remainder of the session. The x-axis is the time line for the session, and administration times of the placebo drink (P) and each active alcohol drink (A1, A2, A3) are indicated with arrows. Data points are slightly displaced on the x-axis for visual clarity.
Subjective response measures during cumulative alcohol dosing procedure
There was a significant main effect of alcohol across time for the POMS tension and anxiety subscale (F7, 856 = 3.05, p=0.004), BAES sedation (F7, 856 = 34.02, p<0.001), BAES stimulant (F7, 856 = 24.46, p <0.001), DEQ VAS positive (F7, 856 = 61.29, p<0.001), DEQ VAS negative (F7, 856 = 21.44, p<0.001), and SHAS scores (F7, 856 = 80.39, p<0.001). Mean DEQ VAS positive effects, BAES stimulation and SHAS scores increased progressively after the each alcohol drink, and peaked after consumption of all 3 alcohol drinks (135 min) when BAC peaked (0.1%). Mean DEQ VAS negative subjective effects, and BAES sedative scale scores increased and peaked on the descending limb of the BAC (270 min).
There was a significant 2-way time × DAT1 genotype interaction (F7, 856 = 2.79, p = 0.007) and a significant 3-way time × DAT1 gentype × OPRM1 genotype interaction (F7, 856 = 2.32, p = 0.024) for SHAS scores (epistatic interaction). As shown in figure 2, the DAT1 A9 carriers had higher SHAS scores across time points, when compared to the A10 carriers, and carriers of both DAT1A9 and OPRM1 *G alleles had the highest SHAS scores. In contrast, carriers of both DAT1A10 and OPRM1 *G alleles had lowest SHAS scores.
Figure 2.
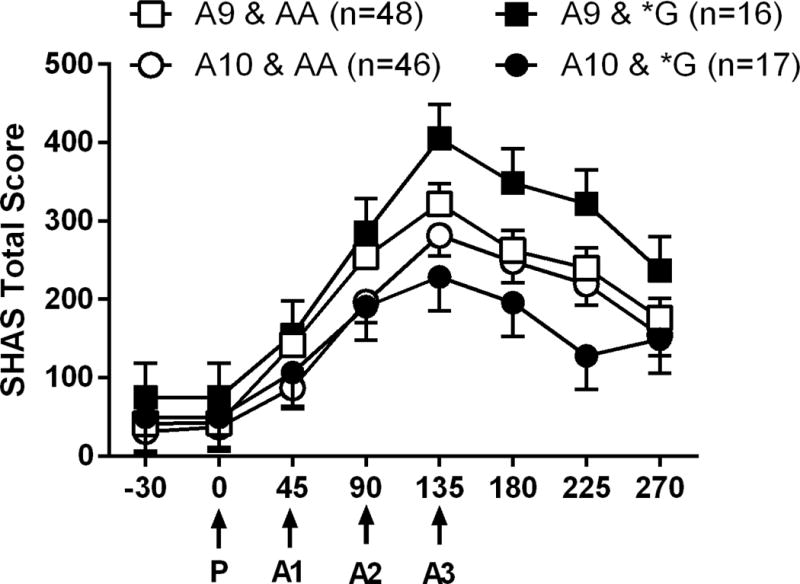
Mean total SHAS scores reported at each time point during the cumulative alcohol dosing procedure. The x-axis is the time line for the session, and administration times of the placebo drink (P) and each active alcohol drink (A1, A2, A3) are indicated with arrows. Data are adjusted means (SEM) for each of the genotype subgroups. Means were adjusted for sex, AIMs and number of drinking days.
We completed several sensitivity analyses. First, we completed a sensitivity analysis in Caucasian subjects, as they were our largest racial demographic with sufficent numbers in all genotype groups. Similar effects were obtained; there was a significant 2-way interaction for time × DAT1 genotype (F7, 613 = 2.76, p = 0.011) and a significant 3-way interaction for time × DAT1 gentype × OPRM1 genotype (F7, 613 = 2.69, p = 0.010) on SHAS scores. Second, we added BAC as a covariate and examined effects in all subjects and then in Caucasians only. Adding BAC, did not alter the findings. Specifically, when BAC was added to the model in all subjects, there was a significant 2-way interaction for time × DAT1 genotype (F7, 801 = 2.14, p = 0.037) and a significant 3-way interaction for time × DAT1 gentype × OPRM1 genotype (F7, 801 = 2.28, p = 0.027) on SHAS scores. In Caucasians only, there was a significant 2-way interaction for time × DAT1 genotype (F7, 591 = 2.65, p = 0.011) and a significant 3-way interaction for time × DAT1 gentype × OPRM1 genotype (F7, 613 = F7, 591 = 2.67, p = 0.010) on SHAS scores.
There was a significant 2-way interaction for time × DAT1 genotype (F7, 856 = 2.17, p = 0.035) on DEQ VAS negative scores. Across time points, the DAT1 A9 carriers had higher DEQ VAS negative scores when compared to the A10 carriers, independent of OPRM1 genotype. A significant 3-way interaction for time × DAT1 gentype × OPRM1 genotype (F7, 856 = 2.31, p = 0.025) indicated an epistatic interaction; carriers of both DAT1 A9 and OPRM1 *G alleles had the highest DEQ VAS negative scores across time points (Figure 3).
Figure 3.
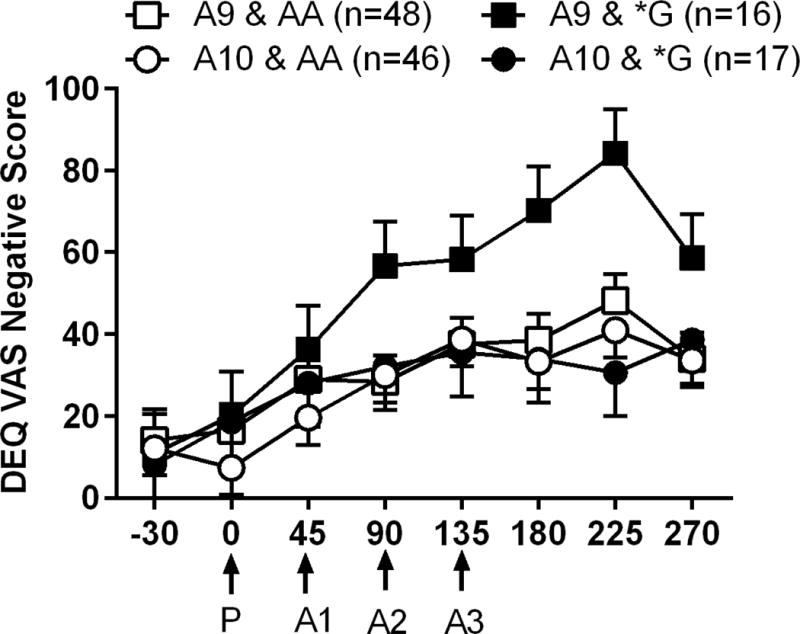
Mean DEQ VAS negative scores reported at each time point during the cumulative alcohol dosing procedure. Other details as in Figure 2.
We repeated the same senstivity analyses as above for SHAS. In Caucasians, there was a significant 2-way time × DAT1 genotype interaction (F7, 613 = 2.20 p= 0.032) and a significant 3-way time × DAT1 gentype × OPRM1 genotype interaction (F7, 613 = 2.50, p = 0.016) on DEQ VAS negative scores. Second, when we added BAC as a covariate and examined effects in all subjects and then in Caucasians only. Findings were similar. Specifically, in all subjects there was a significant 2-way interaction for time × DAT1 genotype (F7, 801 = 2.08, p = 0.043) and a significant 3-way interaction for time × DAT1 gentype × OPRM1 genotype (F7, 801 = 2.46, p = 0.017) on DEQ VAS negative scores. In Caucasians only, there was a significant 2-way interaction for time × DAT1 genotype (F7, 591 = 2.18, p = 0.034) and a significant 3-way interaction for time × DAT1 gentype × OPRM1 genotype (F7, 591 = 2.41, p = 0.02) on DEQ VAS negative scores.
There were no significant 2-way or 3-way interactions effects on any of the other subjective measures (BAES stimulant or sedative scales, DEQ VAS positive score, or POMS tension anxiety scales) (Figure 4), and no significant independent effects of OPRM1 genotype for any of the subjective measures (all, p>0.1).
Figure 4.
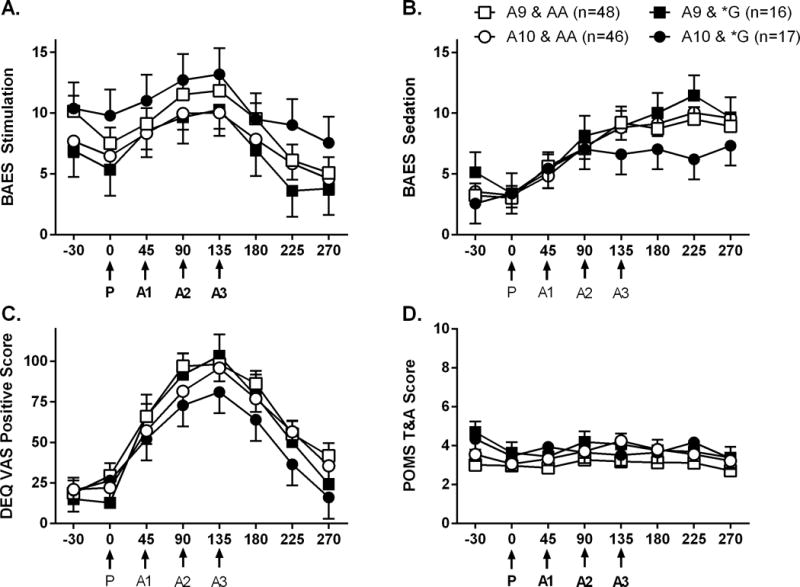
Mean total scores for A. stimulation and B. sedation subscales of the Biphasic Alcohol Effects Scale (BAES), C. positive effects on the Drug Effects Questionairre Visual Analog Scale (DEQ VAS), and D. the Tension and Anxiety subscale of the Profile of Mood States scale (POMS T&A) as reported at each time point during the cumulative alcohol dosing procedure. Other details as in Figure 2.
Discussion
Major genetic association findings of the current study pertain to subjective responses to alcohol and patterns of alcohol consumption. We detected an epistatic interaction between DAT1 and OPRM1 genotypes where the magnitude of subjective responses for OPRM1 *G carriers was dependent on which DAT1 VNTR was also present. Carriers of both DAT1 A9 and OPRM1 G alleles had higher SHAS and DEQ VAS negative scores when compared to the other three genotype subgroups. In contrast, carriers of both DAT1 A10 and OPRM1 G had the lowest SHAS scores. We did not identify an epistatic interaction between DAT1 and OPRM1 on alcohol-induced stimulation, sedation or the positive subjective effects of alcohol.
A second novel finding of the current study was the independent and epistatic interactions of DAT1 and OPRM1 genes on recent drinking patterns as reported on the TLFB interview during the 90 days preceding the assessment interview. DAT1 A9 allele was associated with a greater number of drinking days, but this effect was attenuated in OPRM1 *G carriers. The OPRM1 *G allele was independently associated with fewer heavy drinking days, but did not affect average number of drinks per drinking day over the 90-day TLFB period. There were no epistatic effects of DAT1 A9 and OPRM1 *G genotypes on number of heavy drinking days or average number of drinks per drinking day.
Our data provide further support for the importance of interactions between OPRM1 *G and DAT VNTR polymorphisms. Although early studies indicated *G allele carriers had higher subjective ratings of alcohol intoxication, stimulation, and positive mood across rising BAC than AA homozygotes (Ray and Hutchison, 2004, Ray and Hutchison, 2007, Ray et al., 2013), subsequent analyses indicated that effects were limited to *G-carriers who were also DAT1 A10 homozygotes (Ray et al., 2014). An opposite effect was reported by Anton et al (2012); non-treatment seeking alcoholics who were carriers of both OPRM1 AA and DAT1 A9 alleles showed greater alcohol-induced stimulation after consumption of a single priming drink. Although not significant in the current study, carriers of both OPRM1*G and DAT1 A10 had higher stimulation BAES scores as seen in the Ray et al., 2013. Neither the Anton study nor the Ray study found genotype differences in sedative or negative subjective effects as found in the current study. It is notable that the overall sample of our current study (n=127) was three times larger, and the Caucasian sample (n=92) was twice as large as the prior study conducted by Ray and colleagues (n=43).
We recognize the current study has some key differences from prior studies that warrant consideration. First, there are differences in sampling techniques. Prior studies that examined OPRM1 A118G × DAT1 VTNR interactions used a combination of prospective and retrospective genotyping. Subjects were selected and matched based on prospective OPRM1 *G genotype and demographic variables, then DAT1 VTNR were retrospectively genotyped. In the current study, all genotyping was completed retrospectively (after the sensitivity sessions) and no one was excluded from participation based on genotype results. The advantage of prospective genotyping is the ability to increase the sample size for minor alleles through oversampling, and balanced genotype groups for testing genetic associations. The disadvantage is that the sample is not random, which may bias sampling in unknown ways, particularly when balancing groups and examining epistatic interactions between different genes. Second, there are differences in route, alcohol-dosing procedures (single bolus vs. cumulative dosing), and maximum BAC reached. Some prior studies have used the intravenous route and peak BAC levels are often less than 0.08%. The current study used oral alcohol administration, as this is the route in the natural environment. We also targeted a maximum BAC of 0.1% over 2 hours of drinking to mimic BAC reached during binge drinking. The higher BAC in the current study may be relevant for the greater sedative and aversive effects of alcohol, as detected by the SHAS and DEQ VAS, when compared to lower BAC achieved in some studies.
Two primary models have been proposed to describe the relationship of alcohol response and AUD risk, the low level of response (LLR) model and the differentiator model (DM) (Morean and Corbin, 2010). The LLR model proposes that individuals who experience decreased sensitivity to alcohol intoxication are at greater risk for AUD. In early longitudinal studies linking LLR and AUD risk, LLR was determined using the SHAS (Schuckit and Smith, 2000), which is primarily sensitive to the sedative and negative subjective effects of alcohol (Ray et al., 2016). In contrast, the DM addresses a broader range of alcohol effects. As reviewed by King et al. (2011), the DM proposes greater risk is associated with increased sensitivity to alcohol’s positive and stimulant effects on the ascending limb of the BAC curve, as well as decreased sensitivity to alcohol’s sedative and negative effects on the descending limb. DAT1 A9 and OPRM1*G carriers, who showed higher SHAS scores and greater negative effects of alcohol when compared to other genotype subgroups, would be at lower risk for AUD based on both the LLR and DM models. We did not, however, detect genotype differences for stimulation or positive subjective effects of alcohol, as would be predicted by the DM. This may reflect the quantitative and qualitative differences in stimulation and positive subjective effects in light/moderate drinkers vs. heavy drinkers as proposed by Holdstock and colleagues (2000). Following administration of 0.6 or 0.8 g/kg alcohol, light/moderate drinkers report greater negative effects and more sedation when compared to heavy drinkers, despite similar BAC (peak 0.06 and 0.08 g/dL). In this group of light/moderate social drinkers, the OPRM1 A118G SNP interacts with the DAT1 A9 vs. A10 allele to determine the sedative and negative effects of alcohol and drinking.
To date, the evidence for a role of the OPRM1 A118 SNP in AUD risk has been mixed, with different studies reporting higher or lower frequency of the G-allele in AUD populations (Berrettini, 2015). The associations of the OPRM1 G-allele in epistatic interactions with DAT1 A9 and. A10 alleles on alcohol sensitivity and heavy drinking frequency in the current study have important implications for AUD risk. Epidemiological studies have identified a strong relationship between frequency of binge and heavy drinking in young adulthood and risk for the development of an AUD later in life (Hasin et al., 2001, Jennison, 2004). Moreover, excessive quantity and frequency of drinking also have strong genetic components, and are key factors contributing to AUD (Kendler et al., 2012). Thus, our data would suggest that the OPRM1 G allele in interaction with DAT1 A9 might contribute to protection against heavy drinking.
Clinical and preclinical data provide strong evidence that the rewarding and aversive effects of alcohol are mediated via interactions between opioid and dopamine systems. Acute alcohol induces release of endorphins and stimulates dopamine release in the nucleus accumbens, both of which correlate with subjective responses to alcohol (Volkow et al., 2017). Dopaminergic neurotransmission in the nucleus accumbens is regulated by the DAT and opioid inputs, and such interactions are thought to contribute to the positive and aversive subjective effects of alcohol, and patterns of alcohol consumption. Indeed, prior studies have shown decreased DAT1 expression and lower DAT availability in DAT1 A9 carriers than A10 homozygotes, consistent with increased dopaminergic tone in A9 carriers (Mill et al., 2002, Fuke et al., 2001, Heinz et al., 2000). The OPRM1 *G allele is associated with lower global mu-opioid receptor availability (Ray et al., 2011, Weerts et al., 2013) and greater dopamine release in response to alcohol (Ramchandani et al., 2011), cigarette smoking (Domino et al., 2012), or pain (Pecina et al., 2015) challenges. The stimulatory effects of acute alcohol are also associated with its effects on dopamine release. Thus, it may be that the higher dopaminergic tone in DAT A9 carriers in interaction with OPRM1 genotype effects on mu opioid receptor function and dopamine neurotransmission in response to acute alcohol results in either enhanced (OPRM1*G carriers) or reduced (AA homozygotes) sensitivity to the sedative and aversive effects of alcohol.
The current study has a number of strengths, which help validate the findings and add to the growing literature on epistatic interactions between these polymorphisms. First, to extend beyond prior studies, we selected a population of social drinkers and controlled for individual differences in recent drinking in our analyses. Prior studies have established that there are differences in alcohol response in the laboratory, which are dependent on prior drinking behavior in the community. Heavy drinkers reported greater acute positive subjective effects and stimulation, and less sedative effects when compared to social drinkers administered controlled doses of alcohol (King et al., 2011). Social drinkers reported greater “high” than heavy drinkers after ingesting high ethanol doses (0.56–1 g/kg), and time since last drink altered responses to acute alcohol administration (Turkkan et al., 1988). Second, we restricted smoking in our inclusion/exclusion criteria to reduce the impact of nicotine use and dependence. Both the OPRM1 A118G SNP and DAT1 VTNR polymorphism have been associated with nicotine initiation, use and dependence (Verhagen et al., 2012). Smoking also has been shown to alter availability of both DA D2 receptors and mu opioid receptors in the brain (Scott et al., 2007, Weerts et al., 2014). By excluding regular smokers, we reduced the possible impact of cigarette smoking on opioid and dopamine receptors, and downstream opioid and dopamine effects on alcohol sensitivity. Third, the current study adjusted for key biological variables such as sex and ancestral origin in our analyses. Importantly, the study of the intermediate phenotype of subjective alcohol response in populations that span the continuum of alcohol consumption patterns ranging from social drinkers to the chronic relapsing heavy drinker is consistent with NIH research domain criteria objectives (Ray et al., 2016, Litten et al., 2015). Such an approach is also supported by Bearden and Freimer (2006), since meaningful phenotypes should vary continuously in the general population (i.e. normal distribution). Examination of alcohol response across different populations is critical to our understanding of the strength of genetic associations with individual differences in alcohol response.
We acknowledge there are limitations in the study. First, while sample size is relatively large for alcohol challenge studies, it is small with regard to genetic analysis. Second, the sample size for genotype groups was insufficient for analysis of data disaggregated by sex or race/ancestral origin, or for correction for testing multiple hypotheses. Sex-related effects of OPRM1 G allele have been shown for experimental pain thresholds (Fillingim et al., 2005), magnitude of cortisol response to pharmacological blockade of the mu-opioid receptor by naloxone (Lovallo et al., 2015), and alcohol-induced DA release (Ramchandani et al., 2011). Third, the frequency of the OPRM1 G-allele differs substantially across different race/ethnicities (Oroszi and Goldman, 2004). To address this concern, sex and ancestral origin were covariates in our analyses. We also completed sensitivity analyses with the subsample of Caucasian participants. Fourth, focusing on two genotypes out of many does not account for the influence of other genes that affect alcohol sensitivity and consumption, or possible bias due to genome wide polygenic effects. For example, genetic polymorphisms of GABAA -α2 receptors, and GABAA-α6 receptors, nicotinic acetylcholine receptors, serotonin receptors, and the serotonin transporter have been reported to affect alcohol response (for review see Uhart et al., 2013, Radel and Goldman, 2001, Ray et al., 2016). It is also important to consider that other OPRM1 and DAT1 gene variants may also contribute to individual differences in alcohol response, and that nonsystematic variations in genotype frequency, sampling techniques, and variation in LD structure with other risk loci across studies may be significant factors. Fifth, the laboratory cumulative alcohol dosing procedure also may affect subjective responses. The procedure used a standard volume drink containing Kool-Aid and grain alcohol, with each drink consumed within 10 minutes, and drinks administered at regular intervals over 2 hour period. While these procedures permit blinding of the placebo drink, controlled dosing and BAC achieved, drinks are less palatable than an individual’s preferred drink, and the timing of consumption may be slower or faster than it would be in the natural environment. Despite these caveats, this carefully controlled laboratory study provides evidence of a role of the DAT1 VNTR polymorphism in alcohol response, and supports future examinations of epistatic interactions between DAT1 and OPRM1 genes in larger studies. Validity of these findings would be strengthened by the examination of the same genes in different populations, as well as replication in the same population. Future studies should expand sampling to better address biological variables like sex and racial/ethnic differences, and systematically investigate factors that may influence findings (e.g., magnitude of recent alcohol use and tolerance, co-morbid cigarette smoking or other drug use in heavy drinkers)
The current study provides support for the influence of the interactive effects of DAT1 and OPRM1 genes on subjective effects and patterns of alcohol consumption. Novel findings were the epistatic interactions between OPRM1*G and DAT1 A9 alleles on alcohol drinking frequency and negative subjective effects of alcohol. The current findings do not, however, provide any evidence of interactive effects of OPRM1 and DAT1 genotypes on the stimulant or positive subjective effects of alcohol in social drinkers. If replicated in a larger sample, these data suggest a modest protective effect of the OPRM1 gene in epistatic interaction with the DAT1 gene. These findings also may help explain some of the variability in results observed in prior studies of the OPRM1 A118G polymorphism. In conclusion, these findings highlight the biological importance of interactions between these two genes, and by extension interactions between brain opioid and dopamine systems in modulating individual differences in alcohol response.
Supplementary Material
Acknowledgments
Supported by NIH grants R01AA012837 (ME McCaul), R01AA10158 and R01MH076953 (GS Wand), R01AA017704 (EM Weerts) and U01AA020890 (GS Wand and ME McCaul).
Footnotes
The authors have no conflicts of interest.
References
- Anton RF, Voronin KK, Randall PK, Myrick H, Tiffany A. Naltrexone modification of drinking effects in a subacute treatment and bar-lab paradigm: influence of OPRM1 and dopamine transporter (SLC6A3) genes. Alcohol Clin Exp Res. 2012;36:2000–2007. doi: 10.1111/j.1530-0277.2012.01807.x. [DOI] [PMC free article] [PubMed] [Google Scholar]
- Bearden CE, Freimer NB. Endophenotypes for psychiatric disorders: ready for primetime? Trends Genet. 2006;22:306–313. doi: 10.1016/j.tig.2006.04.004. [DOI] [PubMed] [Google Scholar]
- Berrettini W. Alcohol addiction and the mu-opioid receptor. Prog Neuropsychopharmacol Biol Psychiatry. 2015 doi: 10.1016/j.pnpbp.2015.07.011. [DOI] [PubMed] [Google Scholar]
- Bhaskar LV, Thangaraj K, Wasnik S, Singh L, Raghavendra Rao V. Dopamine transporter (DAT1) VNTR polymorphism and alcoholism in two culturally different populations of south India. Am J Addict. 2012;21:343–347. doi: 10.1111/j.1521-0391.2012.00244.x. [DOI] [PubMed] [Google Scholar]
- Bond C, LaForge KS, Tian M, Melia D, Zhang S, Borg L, Gong J, Schluger J, Strong JA, Leal SM, Tischfield JA, Kreek MJ, Yu L. Single-nucleotide polymorphism in the human mu opioid receptor gene alters beta-endorphin binding and activity: possible implications for opiate addiction. Proc Natl Acad Sci U S A. 1998;95:9608–9613. doi: 10.1073/pnas.95.16.9608. [DOI] [PMC free article] [PubMed] [Google Scholar]
- Bucholz KK, Cadoret R, Cloninger CR, Dinwiddie SH, Hesselbrock VM, Nurnberger JI, Jr, Reich T, Schmidt I, Schuckit MA. A new, semi-structured psychiatric interview for use in genetic linkage studies: a report on the reliability of the SSAGA. J Stud Alcohol. 1994;55:149–158. doi: 10.15288/jsa.1994.55.149. [DOI] [PubMed] [Google Scholar]
- Buhler KM, Gine E, Echeverry-Alzate V, Calleja-Conde J, de Fonseca FR, Lopez-Moreno JA. Common single nucleotide variants underlying drug addiction: more than a decade of research. Addict Biol. 2015;20:845–871. doi: 10.1111/adb.12204. [DOI] [PubMed] [Google Scholar]
- Chen D, Liu L, Xiao Y, Peng Y, Yang C, Wang Z. Ethnic-specific meta-analyses of association between the OPRM1 A118G polymorphism and alcohol dependence among Asians and Caucasians. Drug Alcohol Depend. 2012;123:1–6. doi: 10.1016/j.drugalcdep.2011.10.012. [DOI] [PubMed] [Google Scholar]
- Domino EF, Evans CL, Ni L, Guthrie SK, Koeppe RA, Zubieta JK. Tobacco smoking produces greater striatal dopamine release in G-allele carriers with mu opioid receptor A118G polymorphism. Prog Neuropsychopharmacol Biol Psychiatry. 2012;38:236–240. doi: 10.1016/j.pnpbp.2012.04.003. [DOI] [PubMed] [Google Scholar]
- Fillingim RB, Kaplan L, Staud R, Ness TJ, Glover TL, Campbell CM, Mogil JS, Wallace MR. The A118G single nucleotide polymorphism of the mu-opioid receptor gene (OPRM1) is associated with pressure pain sensitivity in humans. The journal of pain : official journal of the American Pain Society. 2005;6:159–167. doi: 10.1016/j.jpain.2004.11.008. [DOI] [PubMed] [Google Scholar]
- Fisher HR, Simpson RI, Kapur BM. Calculation of blood alcohol concentration (BAC) by sex, weight, number of drinks and time. Canadian journal of public health = Revue canadienne de sante publique. 1987;78:300–304. [PubMed] [Google Scholar]
- Fuke S, Suo S, Takahashi N, Koike H, Sasagawa N, Ishiura S. The VNTR polymorphism of the human dopamine transporter (DAT1) gene affects gene expression. Pharmacogenomics J. 2001;1:152–156. doi: 10.1038/sj.tpj.6500026. [DOI] [PubMed] [Google Scholar]
- Gardner EL. Addiction and brain reward and antireward pathways. Advances in psychosomatic medicine. 2011;30:22–60. doi: 10.1159/000324065. [DOI] [PMC free article] [PubMed] [Google Scholar]
- Gianoulakis C. Endogenous opioids and addiction to alcohol and other drugs of abuse. Curr Top Med Chem. 2009;9:999–1015. doi: 10.2174/156802609789630956. [DOI] [PubMed] [Google Scholar]
- Haber SN, Knutson B. The reward circuit: linking primate anatomy and human imaging. Neuropsychopharmacology. 2010;35:4–26. doi: 10.1038/npp.2009.129. [DOI] [PMC free article] [PubMed] [Google Scholar]
- Hasin D, Paykin A, Endicott J. Course of DSM-IV alcohol dependence in a community sample: effects of parental history and binge drinking. Alcohol Clin Exp Res. 2001;25:411–414. [PubMed] [Google Scholar]
- Heinz A, Goldman D, Jones DW, Palmour R, Hommer D, Gorey JG, Lee KS, Linnoila M, Weinberger DR. Genotype influences in vivo dopamine transporter availability in human striatum. Neuropsychopharmacology. 2000;22:133–139. doi: 10.1016/S0893-133X(99)00099-8. [DOI] [PubMed] [Google Scholar]
- Holdstock L, King AC, de Wit H. Subjective and objective responses to ethanol in moderate/heavy and light social drinkers. Alcohol Clin Exp Res. 2000;24:789–794. [PubMed] [Google Scholar]
- Jennison KM. The short-term effects and unintended long-term consequences of binge drinking in college: a 10-year follow-up study. Am J Drug Alcohol Abuse. 2004;30:659–684. doi: 10.1081/ada-200032331. [DOI] [PubMed] [Google Scholar]
- Kendler KS, Aggen SH, Prescott CA, Crabbe J, Neale MC. Evidence for multiple genetic factors underlying the DSM-IV criteria for alcohol dependence. Mol Psychiatry. 2012;17:1306–1315. doi: 10.1038/mp.2011.153. [DOI] [PMC free article] [PubMed] [Google Scholar]
- Kiernan K, Tobias R, Gibbs P, Tao J. SAS Global Forum: CONTRAST and ESTIMATE Statements Made Easy: The LSMESTIMATE Statement [SAS Statistics and Data Analysis, via SAS.com] 2016 Available at: https://support.sas.com/resources/papers/proceedings11/351-2011.pdf. Accessed 10/31/2016.
- King AC, de Wit H, McNamara PJ, Cao D. Rewarding, stimulant, and sedative alcohol responses and relationship to future binge drinking. Arch Gen Psychiatry. 2011;68:389–399. doi: 10.1001/archgenpsychiatry.2011.26. [DOI] [PMC free article] [PubMed] [Google Scholar]
- Litten RZ, Ryan ML, Falk DE, Reilly M, Fertig JB, Koob GF. Heterogeneity of alcohol use disorder: understanding mechanisms to advance personalized treatment. Alcohol Clin Exp Res. 2015;39:579–584. doi: 10.1111/acer.12669. [DOI] [PubMed] [Google Scholar]
- Lovallo WR, Enoch MA, Acheson A, Cohoon AJ, Sorocco KH, Hodgkinson CA, Vincent AS, Glahn DC, Goldman D. Cortisol Stress Response in Men and Women Modulated Differentially by the Mu-Opioid Receptor Gene Polymorphism OPRM1 A118G. Neuropsychopharmacology. 2015;40:2546–2554. doi: 10.1038/npp.2015.101. [DOI] [PMC free article] [PubMed] [Google Scholar]
- Mahon PB, Zandi PP, Potash JB, Nestadt G, Wand GS. Genetic association of FKBP5 and CRHR1 with cortisol response to acute psychosocial stress in healthy adults. Psychopharmacology (Berl) 2013;227:231–241. doi: 10.1007/s00213-012-2956-x. [DOI] [PMC free article] [PubMed] [Google Scholar]
- Martin CS, Earleywine M, Musty RE, Perrine MW, Swift RM. Development and validation of the Biphasic Alcohol Effects Scale. Alcohol Clin Exp Res. 1993;17:140–146. doi: 10.1111/j.1530-0277.1993.tb00739.x. [DOI] [PubMed] [Google Scholar]
- McCaul ME, Turkkan JS, Svikis DS, Bigelow GE. Alcohol and secobarbital effects as a function of familial alcoholism: acute psychophysiological effects. Alcohol Clin Exp Res. 1990;14:704–712. doi: 10.1111/j.1530-0277.1990.tb01230.x. [DOI] [PubMed] [Google Scholar]
- McNair DM, Lorr M, Droppleman LF. EDITS manual profile of mood states. Educational and Industrial Testing Service; San Diego: 1992. [Google Scholar]
- Mill J, Asherson P, Browes C, D’Souza U, Craig I. Expression of the dopamine transporter gene is regulated by the 3′ UTR VNTR: Evidence from brain and lymphocytes using quantitative RT-PCR. Am J Med Genet. 2002;114:975–979. doi: 10.1002/ajmg.b.10948. [DOI] [PubMed] [Google Scholar]
- Morean ME, Corbin WR. Subjective response to alcohol: a critical review of the literature. Alcohol Clin Exp Res. 2010;34:385–395. doi: 10.1111/j.1530-0277.2009.01103.x. [DOI] [PubMed] [Google Scholar]
- Nelder J, Wedderburn R. Generalized Linear Models. Series A (General) Journal of the Royal Statistical Society. 1972;135:370–384. [Google Scholar]
- Oroszi G, Goldman D. Alcoholism: genes and mechanisms. Pharmacogenomics. 2004;5:1037–1048. doi: 10.1517/14622416.5.8.1037. [DOI] [PubMed] [Google Scholar]
- Oswald LM, Wand GS. Opioids and alcoholism. Physiol Behav. 2004;81:339–358. doi: 10.1016/j.physbeh.2004.02.008. [DOI] [PubMed] [Google Scholar]
- Pecina M, Love T, Stohler CS, Goldman D, Zubieta JK. Effects of the Mu opioid receptor polymorphism (OPRM1 A118G) on pain regulation, placebo effects and associated personality trait measures. Neuropsychopharmacology. 2015;40:957–965. doi: 10.1038/npp.2014.272. [DOI] [PMC free article] [PubMed] [Google Scholar]
- Preston KL, Bigelow GE. Subjective and discriminative effects of drugs. Behav Pharmacol. 1991;2:293–313. [PubMed] [Google Scholar]
- Radel M, Goldman D. Pharmacogenetics of alcohol response and alcoholism: the interplay of genes and environmental factors in thresholds for alcoholism. Drug Metab Dispos. 2001;29:489–494. [PubMed] [Google Scholar]
- Ramchandani VA, Umhau J, Pavon FJ, Ruiz-Velasco V, Margas W, Sun H, Damadzic R, Eskay R, Schoor M, Thorsell A, Schwandt ML, Sommer WH, George DT, Parsons LH, Herscovitch P, Hommer D, Heilig M. A genetic determinant of the striatal dopamine response to alcohol in men. Mol Psychiatry. 2011;16:809–817. doi: 10.1038/mp.2010.56. [DOI] [PMC free article] [PubMed] [Google Scholar]
- Ray LA, Bujarski S, MacKillop J, Courtney KE, Monti PM, Miotto K. Subjective response to alcohol among alcohol-dependent individuals: effects of the mu-opioid receptor (OPRM1) gene and alcoholism severity. Alcohol Clin Exp Res. 2013;37(Suppl 1):E116–124. doi: 10.1111/j.1530-0277.2012.01916.x. [DOI] [PMC free article] [PubMed] [Google Scholar]
- Ray LA, Bujarski S, Roche DJ. Subjective Response to Alcohol as a Research Domain Criterion. Alcohol Clin Exp Res. 2016;40:6–17. doi: 10.1111/acer.12927. [DOI] [PubMed] [Google Scholar]
- Ray LA, Bujarski S, Squeglia LM, Ashenhurst JR, Anton RF. Interactive effects of OPRM1 and DAT1 genetic variation on subjective responses to alcohol. Alcohol Alcohol. 2014;49:261–270. doi: 10.1093/alcalc/agt183. [DOI] [PMC free article] [PubMed] [Google Scholar]
- Ray LA, Hutchison KE. A polymorphism of the mu-opioid receptor gene (OPRM1) and sensitivity to the effects of alcohol in humans. Alcohol Clin Exp Res. 2004;28:1789–1795. doi: 10.1097/01.alc.0000148114.34000.b9. [DOI] [PubMed] [Google Scholar]
- Ray LA, Hutchison KE. Effects of naltrexone on alcohol sensitivity and genetic moderators of medication response: a double-blind placebo-controlled study. Arch Gen Psychiatry. 2007;64:1069–1077. doi: 10.1001/archpsyc.64.9.1069. [DOI] [PubMed] [Google Scholar]
- Ray R, Ruparel K, Newberg A, Wileyto EP, Loughead JW, Divgi C, Blendy JA, Logan J, Zubieta JK, Lerman C. Human Mu Opioid Receptor (OPRM1 A118G) polymorphism is associated with brain mu-opioid receptor binding potential in smokers. Proc Natl Acad Sci U S A. 2011;108:9268–9273. doi: 10.1073/pnas.1018699108. [DOI] [PMC free article] [PubMed] [Google Scholar]
- Salvatore JE, Gottesman II, Dick DM. Endophenotypes for Alcohol Use Disorder: An Update on the Field. Curr Addict Rep. 2015;2:76–90. doi: 10.1007/s40429-015-0046-y. [DOI] [PMC free article] [PubMed] [Google Scholar]
- Schuckit MA. Self-rating of alcohol intoxication by young men with and without family histories of alcoholism. J Stud Alcohol. 1980;41:242–249. doi: 10.15288/jsa.1980.41.242. [DOI] [PubMed] [Google Scholar]
- Schuckit MA, Smith TL. The relationships of a family history of alcohol dependence, a low level of response to alcohol and six domains of life functioning to the development of alcohol use disorders. J Stud Alcohol. 2000;61:827–835. doi: 10.15288/jsa.2000.61.827. [DOI] [PubMed] [Google Scholar]
- Scott DJ, Domino EF, Heitzeg MM, Koeppe RA, Ni L, Guthrie S, Zubieta JK. Smoking modulation of mu-opioid and dopamine D2 receptor-mediated neurotransmission in humans. Neuropsychopharmacology. 2007;32:450–457. doi: 10.1038/sj.npp.1301238. [DOI] [PubMed] [Google Scholar]
- Setiawan E, Pihl RO, Benkelfat C, Leyton M. Influence of the OPRM1 A118G polymorphism on alcohol-induced euphoria, risk for alcoholism and the clinical efficacy of naltrexone. Pharmacogenomics. 2012;13:1161–1172. doi: 10.2217/pgs.12.99. [DOI] [PubMed] [Google Scholar]
- Sheehan DV, Lecrubier Y, Sheehan KH, Amorim P, Janavs J, Weiller E, Hergueta T, Baker R, Dunbar GC. The Mini-International Neuropsychiatric Interview (M.I.N.I.): the development and validation of a structured diagnostic psychiatric interview for DSM-IV and ICD-10. J Clin Psychiatry. 1998;59(Suppl 20):22–33. quiz 34–57. [PubMed] [Google Scholar]
- Sobell LC, Sobell MB. Timeline followback: A technique for assessing self-reported alcohol consumption. In: LITTEN RZ, ALLEN J, editors. Measuring alcohol consumption: Psychosocial and biological methods, Measuring alcohol consumption: Psychosocial and biological methods. Humana Press; New Jersey: 1992. pp. 41–72. [Google Scholar]
- Stephens MA, McCaul ME, Weerts EM, Wand G. Serotonin transporter-linked polymorphic region (5-HTTLPR) genotype is associated with cortisol responsivity to naloxone challenge. Psychopharmacology (Berl) 2012;224:223–230. doi: 10.1007/s00213-012-2742-9. [DOI] [PubMed] [Google Scholar]
- Turkkan JS, Stitzer ML, McCaul ME. Psychophysiological effects of oral ethanol in alcoholics and social drinkers. Alcohol Clin Exp Res. 1988;12:30–38. doi: 10.1111/j.1530-0277.1988.tb00129.x. [DOI] [PubMed] [Google Scholar]
- Uhart M, Weerts EM, McCaul ME, Guo X, Yan X, Kranzler HR, Li N, Wand GS. GABRA2 markers moderate the subjective effects of alcohol. Addict Biol. 2013;18:357–369. doi: 10.1111/j.1369-1600.2012.00457.x. [DOI] [PMC free article] [PubMed] [Google Scholar]
- van den Wildenberg E, Wiers RW, Dessers J, Janssen RG, Lambrichs EH, Smeets HJ, van Breukelen GJ. A functional polymorphism of the mu-opioid receptor gene (OPRM1) influences cue-induced craving for alcohol in male heavy drinkers. Alcohol Clin Exp Res. 2007;31:1–10. doi: 10.1111/j.1530-0277.2006.00258.x. [DOI] [PubMed] [Google Scholar]
- van der Zwaluw CS, Engels RC, Buitelaar J, Verkes RJ, Franke B, Scholte RH. Polymorphisms in the dopamine transporter gene (SLC6A3/DAT1) and alcohol dependence in humans: a systematic review. Pharmacogenomics. 2009;10:853–866. doi: 10.2217/pgs.09.24. [DOI] [PubMed] [Google Scholar]
- Vandenbergh DJ, Persico AM, Hawkins AL, Griffin CA, Li X, Jabs EW, Uhl GR. Human dopamine transporter gene (DAT1) maps to chromosome 5p15.3 and displays a VNTR. Genomics. 1992;14:1104–1106. doi: 10.1016/s0888-7543(05)80138-7. [DOI] [PubMed] [Google Scholar]
- Verhagen M, Kleinjan M, Engels RC. A systematic review of the A118G (Asn40Asp) variant of OPRM1 in relation to smoking initiation, nicotine dependence and smoking cessation. Pharmacogenomics. 2012;13:917–933. doi: 10.2217/pgs.12.76. [DOI] [PubMed] [Google Scholar]
- Volkow ND, Wiers CE, Shokri-Kojori E, Tomasi D, Wang GJ, Baler R. Neurochemical and metabolic effects of acute and chronic alcohol in the human brain: Studies with positron emission tomography. Neuropharmacology. 2017 doi: 10.1016/j.neuropharm.2017.01.012. [DOI] [PubMed] [Google Scholar]
- Wang YJ, Huang P, Ung A, Blendy JA, Liu-Chen LY. Reduced expression of the mu opioid receptor in some, but not all, brain regions in mice with OPRM1 A112G. Neuroscience. 2012;205:178–184. doi: 10.1016/j.neuroscience.2011.12.033. [DOI] [PMC free article] [PubMed] [Google Scholar]
- Weerts EM, McCaul ME, Kuwabara H, Yang X, Xu X, Dannals RF, Frost JJ, Wong DF, Wand GS. Influence of OPRM1 Asn40Asp variant (A118G) on [11C]carfentanil binding potential: preliminary findings in human subjects. Int J Neuropsychopharmacol. 2013;16:47–53. doi: 10.1017/S146114571200017X. [DOI] [PubMed] [Google Scholar]
- Weerts EM, Wand GS, Kuwabara H, Xu X, Frost JJ, Wong DF, McCaul ME. Association of smoking with mu-opioid receptor availability before and during naltrexone blockade in alcohol-dependent subjects. Addict Biol. 2014;19:733–742. doi: 10.1111/adb.12022. [DOI] [PMC free article] [PubMed] [Google Scholar]
- Zhang Y, Wang D, Johnson AD, Papp AC, Sadee W. Allelic expression imbalance of human mu opioid receptor (OPRM1) caused by variant A118G. J Biol Chem. 2005;280:32618–32624. doi: 10.1074/jbc.M504942200. [DOI] [PubMed] [Google Scholar]
Associated Data
This section collects any data citations, data availability statements, or supplementary materials included in this article.