

Abstract
OBJECTIVE
The study evaluates lipids profile changes during gestation in pregnancies with and without preeclampsia and/or gestational diabetes.
STUDY DESIGN
Lipid profiles were assessed between year prior and after pregnancy in 9911 women without cardiovascular comorbidities.
RESULTS
Lipid levels during gestation varied substantially with a nadir following conception and a peak at delivery. Compared to preconception levels total cholesterol levels increased from 164.4 mg/dL to 238.6 mg/dL and triglycerides (TGs) from 92.6 mg/dL to 238.4 mg/dL. The composite endpoint (gestational diabetes mellitus or preeclampsia) occurred in 1209 women (12.2%). Its prevalence increased with levels of TG—from 7.2% in the group with low TGs (<25th percentile adjusted for the gestational month) to 19.8% in the group with high TGs (>75th percentile), but was not associated with high-density lipoprotein levels. In multivariate analysis higher TGs levels, but not low high-density lipoprotein, were associated with the primary endpoint.
CONCLUSION
Lipid levels change substantially during gestation. Abnormal levels of TGs are associated with pregnancy complications.
Keywords: adverse outcomes, gestation, lipids
A number of diseases affecting the cardiovascular system emerge during pregnancy. Gestational diabetes mellitus is a risk factor for the development of type 2 diabetes and gestational hypertension is associated with an elevated risk for developing subsequent systemic hypertension.1–3 Gestational diabetes and hypertension can contribute to maternal and fetal risk of developing peri- and postpartum complications.4,5
The third component of the metabolic syndrome associated with insulin resistance, ie, dyslipidemia, is a well known cardiovascular risk factor. However, lipid physiology and pathophysiology during pregnancy has not been studied extensively in large population-based cohorts. Values for total cholesterol (TC), low-density lipoprotein (LDL), high-density lipoprotein (HDL), and triglycerides (TGs) during pregnancy and their changes with gestational age are not well described. Similarly, the association between pregnancy outcomes and abnormal levels of lipids prior to conception and during the gestation has not been studied substantially.
This population-based study was aimed to provide a description of lipids profile by gestational age during pregnancy. We sought to test the hypothesis that elevated TG levels and low levels of HDL assessed during gestation are associated with pregnancy complications such as preeclampsia and gestational diabetes mellitus.
Materials and Methods
Study population
In the current study, we used a database with data on all deliveries between January 2000 and February 2006 in the Soroka University Medical Center. The study population was limited to women who during the study period had 1 of the lipids tests performed (analyzed in the single laboratory) in a time frame between 12 months prior to singleton pregnancy and 12 months following the delivery (Figure 1). The database included information on maternal comorbidities, perinatal assessment, maternal and fetal complications. Fasting glucose levels during gestation were assessed as well. Women with ischemic heart disease, stroke, peripheral vascular disease, diabetes mellitus diagnosed prior to conception, dyslipidemia, or hypertension were excluded from the study population.
FIGURE 1. Flowchart of the study population.
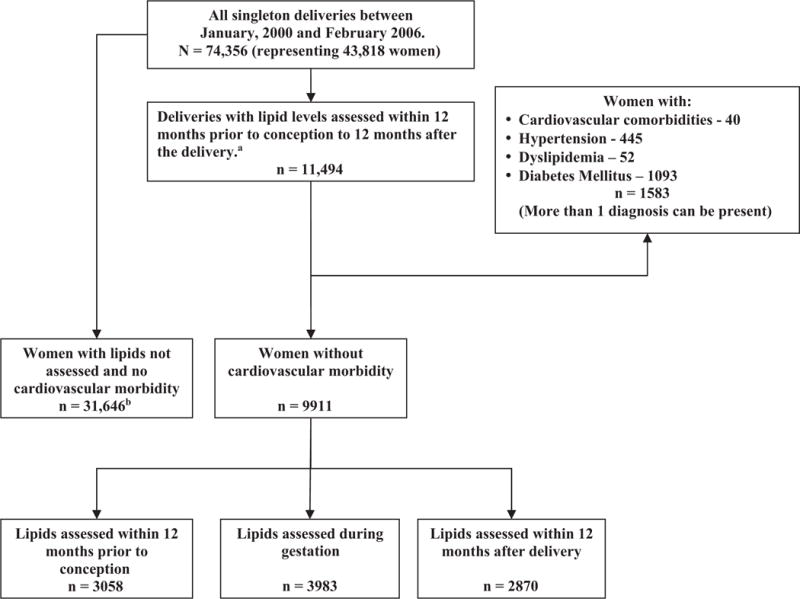
aIn case a woman had >1 pregnancy during the defined period, and ≥1 lipidograms, a gestation with the conception closest to the lipidogram date was chosen; bChosen at random from 52,815 deliveries during study period with no lipids analysis between 12 months prior to conception and 12 months following the delivery.
Lipids levels measurement
We used a cross-sectional approach, ie, each subject (woman-lipids test) was included only once into the analysis. The time of performing lipidogram was related to the nearest estimated conception date (assigned value “0”), and calculated as (Date of lipidogram – [delivery date-gestational age]) in months. In women who delivered after 40 weeks and the test was done after delivery, the time of the test was assigned to the 10th month. If a subject had more than 1 pregnancy during the defined period, the pregnancy with the conception closest to the lipidogram date was chosen. If a woman had more than 1 lipidogram for the chosen pregnancy, only 1 test closest to delivery date was used for analysis. Women with preeclampsia or gestational diabetes mellitus (GDM) were excluded from definition of the lipids distribution for the respective gestational month.
Results for each individual test (TC, HDL, LDL, and TGs) during pregnancy were divided into 3 groups: “low level” (levels <25th percentile); “intermediate level” (between 25th and 75th percentiles); and “upper level” (levels >75th percentile) of the distribution for the respective gestational month.
Definitions
We considered the composite of preeclampsia and gestational diabetes mellitus to be the primary endpoint in the study. The outcome diagnoses were made by the treating physician according to standard definitions used in our institution. Preeclampsia was defined as blood pressure of 140/90 mmHg after 20 weeks’ gestation and proteinuria of ≥0.1 g/L of protein in random specimen. GDM was diagnosed by universal screening.
Preterm delivery was defined as delivery prior 37 weeks of gestation, small for gestational age (SGA) as birthweight below 10th percentile for gestational age, and large for gestational age (LGA) weight above 90th percentile. Repeated spontaneous abortion was defined as 2 or more spontaneous abortions.
Data analysis
The data on continuous variables with normal distribution were presented as mean ± SD, and median with interquartile range (IQR) for not normally distributed variables. Categorical data were shown in counts and percentages. Difference in categorical variables was assessed by χ2 for general association, χ2 for trend, and Cochran Mantel-Haenszel row mean score tests. A t test and a Mann-Whitney test were applied to continuous variables.
Association between low HDL, high TGs, and the primary composite outcome was assessed by 2 multivariable logistic regressions. Variable selection in multivariable modeling was based on clinical and statistical significance. Forward stepwise regression with stay criterion of 0.10 was used to determine potential significant predictors. Two-sided P value of <.05 was considered significant.
Results
Overall, 9911 women with singleton pregnancy and no cardiovascular morbidity had lipid profiles assessed within the study time frame. Of these, 3058 women had lipid profile assessment before conception and 3983 during pregnancy. An additional 2870 results of lipids tests were obtained within 12 months following the delivery (Figure 1).
Maternal characteristics, peripartum complications, and neonatal outcomes of the study population are described in Table 1. The study population was composed of women 29.6 years old on average, with 4.1% over the age of 40. The median number of pregnancies was 3.0 (IQR 2; 5), while the number of deliveries was 3.0 (IQR 1; 4). A rate of the perinatal mortality (intra- and postpartum) in the study cohort was 1.26% (125 cases; 95% confidence interval [CI], 1.04–1.48). Women with lipids tests were older than untested counterparts (29.6 ± 5.9 vs 28.8 ± 5.9), experienced more spontaneous abortion (6.2% vs 4.9%), and had a higher rate of the infertility treatments (2.9% vs 1.8%).
TABLE 1.
Maternal characteristics, peripartum complications, neonatal outcomes, and lipidogram results among study and control populations
| Characteristics | Study population with lipids assessment, N = 9911 | Women with no lipids assessment n = 31,646 | ||
|---|---|---|---|---|
| Within 12 months before the gestation n = 3058 | During the gestation n = 3983 | Within 12 months after the delivery n = 2870 | ||
| Maternal characteristics | ||||
| Age (y), mean ± SD | 29.5 ± 6.0 | 29.7 ± 5.7 | 29.8 ± 6.0 | 28.8 ± 5.9 |
| Gravidity, mean ± SD | 4.2 ± 3.2 | 3.7 ± 2.7 | 4.3 ± 3.1 | 3.6 ± 2.7 |
| Median | 3 | 3 | 3 | 3 |
| Parity, mean ± SD | 3.6 ± 2.7 | 3.1 ± 2.3 | 3.7 ± 2.8 | 3.1 ± 2.3 |
| Median | 3 | 2 | 3 | 2 |
| Repeated spontaneous abortions | 7.0% | 6.0% | 5.5% | 4.9% |
| Infertility treatments | 3.8% | 2.7% | 2.3% | 1.8% |
| Neonatal characteristics | ||||
| Birthweight, g | 3199.6 ± 536.5 | 3164.6 ± 562.2 | 3148.5 ± 589.0 | 3188.3 ± 546.5 |
| Complications | ||||
| Composite of preeclampsia and gestational diabetes, % | 8.9 | 13.4 | 14.0 | 8.4 |
| Preeclampsia, % | 3.7 | 6.8 | 8.3 | 4.4 |
| Gestational diabetes, % | 5.5 | 7.1 | 6.4 | 4.2 |
| Mal presentation, % | 1.9 | 3.1 | 4.1 | 1.9 |
| Premature rapture of membranes, % | 8.9 | 8.3 | 8.4 | 9.3 |
| Preterm delivery, % | 6.3 | 8.3 | 10.8 | 7.3 |
| Small for gestational age, % | 5.2 | 4.3 | 6.5 | 5.7 |
| Large for gestational age, % | 10.6 | 10.1 | 11.1 | 10.8 |
Pregnancy complications
During the index pregnancy GDM was diagnosed in 638 women (6.4%). Women with gestational diabetes were older (32.4 vs 29.5 years; P <.001) and had higher gravidity (4.7 vs 4.0 pregnancies at average; P <.001). Preeclampsia was diagnosed in 625 pregnancies (6.3%). Women with preeclampsia had lower gravidity as compared to the rest of the cohort (3.7 vs 4.0 pregnancies at average; P = .01). Composite endpoint of preeclampsia/GDM occurred in 1209 women (12.2%; Table 2). The group of untested women had lower rates of composite endpoint of preeclampsia and GDM (8.4% vs 12.2%; P <.001).
TABLE 2.
Maternal characteristics, peripartum complications, and neonatal outcomes in women with and without composite endpoint of preeclampsia and gestational diabetes
| Patient characteristics | Preeclampsia or gestational diabetes mellitus n = 1209 | No preeclampsia or gestational diabetes mellitus n = 8700 | P value |
|---|---|---|---|
| Maternal characteristics | |||
| Age (y), mean ± SD | 30.9 ± 6.5 | 29.5 ± 5.8 | < .001 |
| Parity, mean ± SD | 3.5 ± 3.0 | 3.5 ± 2.6 | .002 |
| Median | 2.0 | 3.0 | |
| Gravidity, mean ± SD | 4.2 ± 3.4 | 4.0 ± 2.9 | .70 |
| Median | 3.0 | 3.0 | |
| Repeated spontaneous abortions, % | 8.6 | 5.8 | < .001 |
| Infertility treatments, % | 5.6 | 2.5 | < .001 |
| Fasting glucose level (mg/dL), mean ± SD | 82.6 ± 20.6 | 76.8 ± 15.4 | .01 |
| Neonatal characteristics | |||
| Mal presentation, % | 4.4 | 2.8 | .003 |
| Premature rapture of membranes, % | 0.9 | 1.1 | .59 |
| Premature delivery, % | 14.8 | 7.5 | < .001 |
| Birthweight in term newborns, g | 3282.0 ± 512.0 | 3257.0 ± 443.0 | .09 |
| Large for gestational age, % | 14.3 | 10.0 | < .001 |
| Small for gestational age, % | 7.0 | 5.0 | .003 |
Lipid levels
Mean pregestational levels of the lipids were: TC, 164.4 ± 32.4 mg/dL; TGs, 92.6 ± 51.3 mg/dL; LDL, 98.4 ± 26.8 mg/dL; and HDL, 49.4 ± 12.8 mg/dL. Following conception, there was a decrease in the levels of TGs, TC, and LDL to a nadir at the second gestational month (patients with GDM or preeclampsia excluded): 77.4 ± 35.6 mg/dL, 151.2 ± 27.1 mg/dL, and 85.6 ± 22.5 mg/dL, respectively (Figures 2 and 3). The levels increased with a peak at the delivery month: TGs, 238.4 ± 91.5 mg/dL; TC, 238.6 ± 53.6 mg/dL; and LDL, 133.9 ± 37.9 mg/dL. Levels of HDL peaked at month 7 to 66.5 ± 15.9 mg/dL and remained stable until delivery. Ratio of TC to HDL was 3.5 ± 1.0 at conception, with nadir of 3.0 ± 0.7 during 3 months of gestation and peak at delivery of 4.0 ± 1.3.
FIGURE 2. Levels of TC, TGs, HDL, and LDL 1 year before, during, and 1 year after gestation.
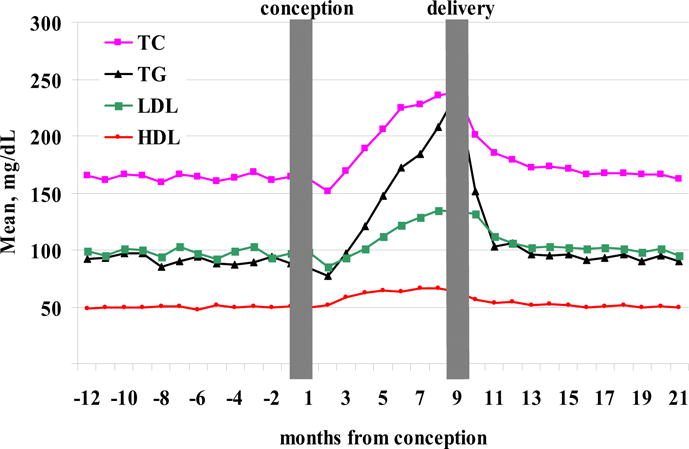
Time 0 represents calculated conception date. Women with preeclampsia or gestational diabetes mellitus are excluded.
FIGURE 3. Levels of TC, TGs, LDL, and HDL during gestation and immediate postpartum period (2 months following the delivery).
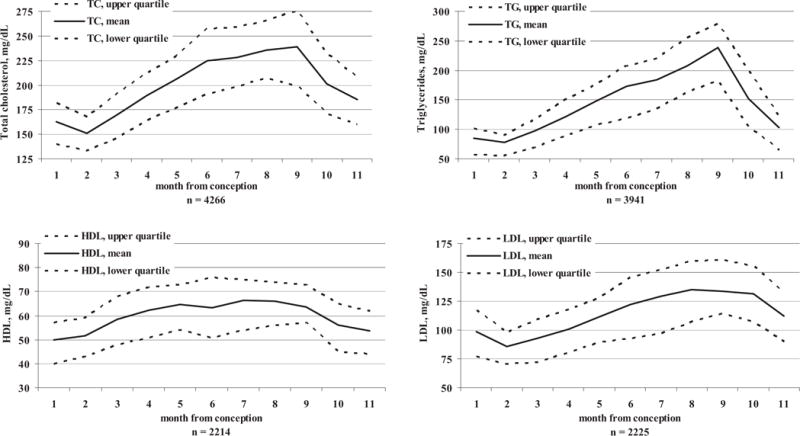
Women with preeclampsia or gestational diabetes mellitus are excluded.
TGs (assessed on 3793 women)
TGs were assessed in 58.4% of the subjects during first trimester, 22.7% of the subjects during second trimester, and 18.9% of the subjects during third trimester. The rate of the composite end-point (preeclampsia and gestational diabetes) increased with levels of TG—from 7.2% in group with low TGs (<25th percentile) to 19.8% in the group with high TGs (>75th percentile). High levels of TG were associated with high risk of preeclampsia (relative risk [RR], 1.87; 95% CI, 1.45–2.40) as compared to the rest (Figure 4). Similarly, proportion of LGA increased with levels of TG—from 7.5% in group with low TGs, to 9.9% in intermediate levels and 11.7% in the high TGs group (P = .008).
FIGURE 4. Levels of TC, TGs, LDL, and HDL during gestation and immediate postpartum period (2 months following the delivery).
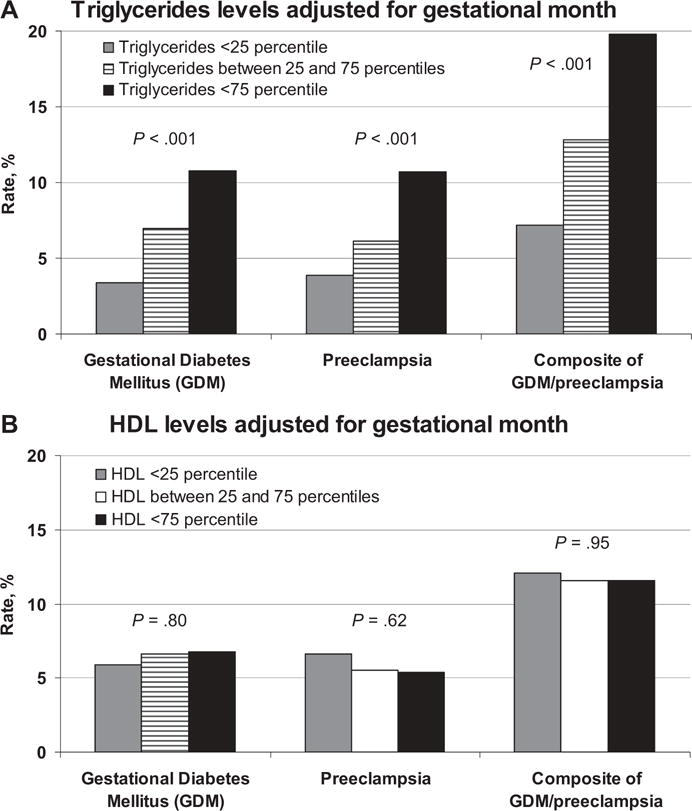
A, Levels of triglycerides (TGs) and high-density lipoprotein (HDL) during pregnancy, adjusted for a gestational month and rate of pregnancy complications. B, Levels of HDL during pregnancy, adjusted for a gestational month and rate of pregnancy complications.
There was an association between high levels of TG and low levels of HDL: 32.6% of subjects with high TGs had low HDL compared to only 24.7% of subjects with TG levels below the 75th percentile (P <.001). After excluding subjects with GDM, women with high TG levels had a higher rate of fasting glucose level ≥100 mg/dL (6.3%) as compared to the intermediate group (3.8%) and low quartile (3.2%) (P = .003).
HDL (assessed on 2190 women)
An HDL test during first trimester was obtained in 62.4% of subjects, in 23.7% of subjects during second trimester, and in 13.9% of subjects during the third trimester. Low HDL levels during pregnancy (adjusted for gestational age) were not associated with either preeclampsia or diabetes (Figure 4).
TC (assessed on 3961 women) and LDL (assessed in 2176 women)
Subjects with high TC had higher preeclampsia rate: RR of 1.39 (95% CI, 1.04–1.75). Term infants of mothers with low TC weighed on average 53 g less than those who were born to mothers with higher levels of TC (P = .002). Low TC was not associated with a preterm delivery neither when assessed during the entire gestation (8.7% vs 8.2%; P = .64), nor during the first 2 trimesters (7.9% vs 7.7%; P = .85). High LDL levels (>75th percentile) were associated with neither a composite endpoint (P = .32), nor preeclampsia (P = .31) or GDM (P = .44).
Multivariate analysis
The following variables were included into the model: maternal age, gravidity, number of abortions prior to the index pregnancy, infertility treatment, repeated spontaneous abortions, fasting glucose level >100 mg/dL, gestational levels of HDL, and TGs divided into 3 levels.
Older age, infertility treatment, repeated spontaneous abortions, higher levels of TGs but not lower levers of HDL were independently and significantly associated with an increased risk for adverse pregnancy outcomes (Table 3).
TABLE 3.
Multivariable logistic regression analysis predicting pregnancy complications (composite of preeclampsia and gestational diabetes) based on gestational levels of TGs and HDL
| Variable | Odds ratio | 95% CI | P value | |
|---|---|---|---|---|
| Lower | Upper | |||
| Age, per year | 1.04 | 1.01 | 1.06 | .003 |
| Repeated spontaneous abortions | 1.65 | 1.03 | 2.65 | .037 |
| History of infertility treatment | 1.90 | 1.00 | 3.62 | .05 |
| TGs, per groupa | 1.64 | 1.35 | 1.99 | < .001 |
| HDL, per groupa | 0.97 | 0.79 | 1.20 | .80 |
CI, confidence interval; HDL, high-density lipoprotein; TGs, triglycerides.
Results for each individual test (HDL and TGs) during pregnancy were divided into 3 groups: low quartile (levels lower than 25th percentile); intermediate (between 25th and 75th percentiles); and upper quartile (levels higher than 75th percentile) of the distribution for the respective gestational month.
Postpartum period (assessed on 2870 women)
Lipid levels declined to the plateau at 4 months after the delivery, and differ from preconception period by 5.1 mg/dL for TC (P <.001) and 3.1 mg/dL for LDL (P = .003).
COMMENT
Our study provides information from a large population-based database that could help clinicians determine the risk for adverse pregnancy outcome based on the maternal lipid level during gestational period. Our main findings can be summarized in the following points: (a) lipids level variations during pregnancy are characterized by an initial decrease with nadir during first trimester followed by the gradual increase and peaking before the delivery; (b) high levels of TGs during pregnancy are associated with an increased risk for preeclampsia and gestational diabetes mellitus.
Increases in total LDL, cholesterol, TGs, and HDL are similar to those reported by others.6–9 Hyperlipidemia is common in the second half of pregnancy as a physiologically required mechanism to maintain stable fuel supplementation to the fetus. Yet, it may be a pathologic finding indicating the development suggestive of a metabolic syndrome. The mechanism by which pregnancy alters lipid metabolism is not fully understood. Estrogens can increase levels of TGs by stimulating hepatic production of very low density lipoproteins and by inhibition of hepatic and adipose tissue lipoprotein lipase.10,11 Progesterone, on the other hand, has been shown to oppose the action of estrogen on lipoprotein metabolism.12 Furthermore, it has been suggested that the estrogen progesterone ratio is important in the balance of the metabolism of lipoprotein during pregnancy. During the first trimester the ratio is low indicating a predominantly progesterone-mediated effect on lipid metabolism. Indeed, during early pregnancy we observed a decrease of total serum cholesterol, TGs, and LDL (Figure 1) following by a later increase and peaking at the delivery.
In addition to association between composite endpoint and increasing levels of TGs, we found a positive trend for an increased risk of preeclampsia. Our results are consistent with the recent study of Ray et al in which a total of 19 case control and 3 cohort studies were reviewed.8 Elevated serum levels of TGs were associated with the risk of developing pregnancy associated hypertension.13,14 The association between dyslipidemia and the risk of preeclampsia is biologically plausible and compatible with what is known about pathophysiology of preeclampsia. At least 3 hypothesized mechanisms for the dyslipidemia and preeclampsia association have been described. First, elevated plasma lipid may induce endothelial dysfunction secondary to oxidative stress.6 This thesis is supported by the fact that TG accumulation in endothelial cells is associated with decreased release of prostacyclin.6 The second possible mechanism is the pathologic process of preeclampsia via dysregulation of lipoprotein lipase resulting in a dyslipidemic lipid profile. Endresen et al and Lorentzen et al showed that serum from women with preeclampsia had both a higher ratio of free fatty acids to albumin and increased lipolytic activity, resulting in enhanced endothelial uptake of free fatty acids, which are further esterified to TGs.15,16 A third possible mechanism may be via the metabolic syndrome. Kaaja et al noted that metabolic characteristics of “insulin resistance syndrome” namely, hyperinsulinemia, are also present in preeclampsia.17 Our data have shown that high TGs are associated with higher birthweight, as might be expected in insulin resistance state. No such association with low HDL levels was found.
Similar to the study of Edison et al, we have found that low TC levels are associated with low birthweight in term infants.18 These results can be attributed to restricted substrate for hormonal and nutritional fetal support. However, in our population low TC levels during first 2 trimesters were not associated with a preterm delivery.
Analysis of patients with gestational diabetes mellitus showed higher TGs during the gestation. Although debate regarding the state of insulin resistance in GDM is ongoing, the association between GDM and high TGs supports the insulin resistance theory.19
The strengths of the present study include the fact that the lipid tests results were assessed in a large population-based cohort of women including data on all deliveries in 1 geographical area, allowing us to achieve almost 100% follow-up. The large study population with lipidograms assessed at different stages of pregnancy allowed us to describe a distribution of the lipid levels during gestation. An important limitation is the retrospective nature of the analysis; however, prospective study of this magnitude with week by week assessment of the lipids levels during the gestation might not be feasible. Although women with cardiovascular comorbidity and risk factors were excluded, the referral bias might be introduced (ie, women with lipids tests were older than untested counterparts) and results may not be fully generalizable to all pregnant women. We did not have access to certain data (such as weight and body mass index), which could have added to our understanding of insulin resistance in pregnant women. Therefore, longitudinal lipid assessment (before, during, and after pregnancy) along with rigorous measurements of body fat distribution and other potential mediators of obesity-related complications will be of interest in future studies.
Maternal levels of lipids during the gestation have a predictable variation and can be categorized as physiological or pathological changes. High TGs levels are associated with pregnancy complications such as preeclampsia and gestational diabetes. The results of our study warrant further prospective investigation to establish a definition for gestational metabolic syndrome and its association with the pregnancy outcome and long term maternal and fetal morbidity.
References
- 1.Kaaja RJ, Greer IA. Manifestations of chronic disease during pregnancy. JAMA. 2005;294:2751–7. doi: 10.1001/jama.294.21.2751. [DOI] [PubMed] [Google Scholar]
- 2.Sattar N, Greer IA. Pregnancy complications and maternal cardiovascular risk: opportunities for intervention and screening? BMJ. 2002;325:157–60. doi: 10.1136/bmj.325.7356.157. [DOI] [PMC free article] [PubMed] [Google Scholar]
- 3.Buchanan TA, Xiang AH. Gestational diabetes mellitus. J Clin Invest. 2005;115:485–91. doi: 10.1172/JCI24531. [DOI] [PMC free article] [PubMed] [Google Scholar]
- 4.Hollander MH, Paarlberg KM, Huisjes AJ. Gestational diabetes: a review of the current literature and guidelines. Obstet Gynecol Surv. 2007;62:125–36. doi: 10.1097/01.ogx.0000253303.92229.59. [DOI] [PubMed] [Google Scholar]
- 5.Frishman WH, Veresh M, Schlocker SJ, Tejani N. Pathophysiology and medical management of systemic hypertension in preeclampsia. Curr Hypertens Rep. 2006;8:502–11. doi: 10.1007/s11906-006-0030-y. [DOI] [PubMed] [Google Scholar]
- 6.Kaaja R, Tikkanen MJ, Viinikka L, Ylikorkala O. Serum lipoproteins, insulin, and urinary prostanoid metabolites in normal and hypertensive pregnant women. Obstet Gynecol. 1995;85:353–6. doi: 10.1016/0029-7844(94)00380-V. [DOI] [PubMed] [Google Scholar]
- 7.Ogura K, Miyatake T, Fukui O, Nakamura T, Kameda T, Yoshino G. Low-density lipoprotein particle diameter in normal pregnancy and preeclampsia. J Atheroscler Thromb. 2002;9:42–7. doi: 10.5551/jat.9.42. [DOI] [PubMed] [Google Scholar]
- 8.Ray JG, Diamond P, Singh G, Bell CM. Brief overview of maternal TGs as a risk factor for pre-eclampsia. BJOG. 2006;113:379–86. doi: 10.1111/j.1471-0528.2006.00889.x. [DOI] [PubMed] [Google Scholar]
- 9.Sattar N, Bendomir A, Berry C, Shepherd J, Greer IA, Packard CJ. Lipoprotein subfraction concentrations in preeclampsia: pathogenic parallels to atherosclerosis. Obstet Gynecol. 1997;89:403–8. doi: 10.1016/S0029-7844(96)00514-5. [DOI] [PubMed] [Google Scholar]
- 10.Mazurkiewicz JC, Watts GF, Warburton FG, Slavin BM, Lowy C, Koukkou E. Serum lipids, lipoproteins and apolipoproteins in pregnant non-diabetic patients. J Clin Pathol. 1994;47:728–31. doi: 10.1136/jcp.47.8.728. [DOI] [PMC free article] [PubMed] [Google Scholar]
- 11.Sattar N, Greer IA, Louden J, et al. Lipoprotein subfraction changes in normal pregnancy: threshold effect of plasma TG on appearance of small, dense low density lipoprotein. J Clin Endocrinol Metab. 1997;82:2483–91. doi: 10.1210/jcem.82.8.4126. [DOI] [PubMed] [Google Scholar]
- 12.Desoye G, Schweditsch MO, Pfeiffer KP, Zechner R, Kostner GM. Correlation of hormones with lipid and lipoprotein levels during normal pregnancy and postpartum. J Clin Endocrinol Metab. 1987;64:704–12. doi: 10.1210/jcem-64-4-704. [DOI] [PubMed] [Google Scholar]
- 13.Llurba E, Casals E, Dominguez C, et al. Atherogenic lipoprotein subfraction profile in preeclamptic women with and without high TGs: different pathophysiologic subsets in preeclampsia. Metabolism. 2005;54:1504–9. doi: 10.1016/j.metabol.2005.05.017. [DOI] [PubMed] [Google Scholar]
- 14.Ziaei S, Bonab KM, Kazemnejad A. Serum lipid levels at 28–32 weeks gestation and hypertensive disorders. Hypertens Pregnancy. 2006;25:3–10. doi: 10.1080/10641950500543756. [DOI] [PubMed] [Google Scholar]
- 15.Endresen MJ, Lorentzen B, Henriksen T. Increased lipolytic activity and high ratio of free fatty acids to albumin in sera from women with preeclampsia leads to TG accumulation in cultured endothelial cells. Am J Obstet Gynecol. 1992;167:440–7. doi: 10.1016/s0002-9378(11)91426-4. [DOI] [PubMed] [Google Scholar]
- 16.Lorentzen B, Drevon CA, Endresen MJ, Henriksen T. Fatty acid pattern of esterified and free fatty acids in sera of women with normal and pre-eclamptic pregnancy. BJOG. 1995;102:530–7. doi: 10.1111/j.1471-0528.1995.tb11355.x. [DOI] [PubMed] [Google Scholar]
- 17.Kaaja R, Laivuori H, Laakso M, Tikkanen MJ, Ylikorkala O. Evidence of a state of increased insulin resistance in preeclampsia. Metabolism. 1999;48:892–6. doi: 10.1016/s0026-0495(99)90225-1. [DOI] [PubMed] [Google Scholar]
- 18.Edison RJ, Berg K, Remaley A, et al. Adverse birth outcome among mothers with low serum cholesterol. Pediatrics. 2007;120:723–33. doi: 10.1542/peds.2006-1939. [DOI] [PubMed] [Google Scholar]
- 19.Metzger BE, Lowe LP, Dyer AR, et al. Hyperglycemia and adverse pregnancy outcomes. N Engl J Med. 2008;358:1991–2002. doi: 10.1056/NEJMoa0707943. [DOI] [PubMed] [Google Scholar]