

Abstract
Characterization of enzyme active site structure and interactions at high resolution is important for the understanding of the enzyme catalysis. Vibrational frequency and NMR chemical shift measurements of enzyme-bound ligands are often used for such purpose when X-ray structures are not available or when higher resolution active site structures are desired. This review is focused on how ab initio calculations may be integrated with vibrational and NMR chemical shift measurements to quantitatively determine high-resolution ligand structures (up to 0.001 Å for bond length and 0.01 Å for hydrogen bonding distance) and how interaction energies between bound ligand and its surroundings at the active site may be determined. Quantitative characterization of substrate ionic states, bond polarizations, tautomeric forms, conformational changes and its interactions with surroundings in enzyme complexes that mimic ground state or transition state can provide snapshots for visualizing the substrate structural evolution along enzyme-catalyzed reaction pathway. Our results have shown that the integration of spectroscopic studies with theoretical computation greatly enhances our ability to interpret experimental data and significantly increases the reliability of the theoretical analysis.
1. INTRODUCTION
Characterization of the enzyme active site contacts at high resolution is important for the understanding of the enzyme catalysis. Upon binding of a substrate, the transition state paradigm has it that enzymes achieve their high catalytic power by stabilizing the transition state structure and destabilizing the ground state structure to reduce the reaction barrier. The interactions between an enzyme and its substrate in the ground state and in the transition state are also responsible for the specificity of the enzyme. The active site noncovalent interactions, such as hydrogen bonding/ionic interactions, often are the major factors that bring about distortions of the substrate upon its binding to the enzyme to change the substrate structurally closer to the transition state so that the bond-breaking/bond-making process can be achieved. In addition, active site contacts often facilitate the proton transfer from one functional group to the other during the reaction. Information about substrate bond distortions and active site proton movements forms the basis for deeper understanding of the enzyme catalysis and is potentially useful for rational drug design.
One way to learn how the distortions on the functional groups of the substrate progress in the enzyme catalysis is to perform steady state studies on stable enzyme substrate complexes or enzyme inhibitor complexes that mimic Michaelis complex or transition state along the reaction coordinate. Studies based on the comparisons of NMR chemical shifts or vibrational (Raman and FTIR) frequencies of enzyme-bound ligands relative to their solution values are often used to quantitatively determine enzyme active site contacts. The spatial resolutions of such tools are higher than X-ray crystallography and can identify subtle ligand conformational changes as well as small but crucial bond order changes of NH/OH/C=O/P••O bonds that an enzyme induces on its substrate, which may be easily overlooked in the X-ray structures. These tools are also ideally suited for the determination of the ionic states and tautomeric forms of substrates/inhibitors so that the proton locations in the enzyme complexes can be traced.
Typically, qualitative information on the ligand structure/interaction can be obtained based on comparisons between the chemical shifts or the vibrational frequencies of the ligand molecule obtained in solution and in enzyme–ligand complex. To overcome the spectral crowding problem in the presence of the enzyme, isotope-edited difference vibrational spectroscopy (reviewed previously in Callender & Deng, 1994; Carey, 2006; Deng & Callender, 1999, 2001) or isotope-edited NMR techniques (cf. Mildvan, Harris, & Abeygunawardana, 1999) can be used. More quantitative information, such as ligand conformational changes, ligand bond length changes, and the hydrogen bonding energy changes that occur to NH/OH/C=O/P••O groups upon ligand binding to enzymes, may be determined by empirical correlations and by computer simulations based on ab initio methods. In Section 2, we will briefly review some of the empirical correlations developed for vibrational frequencies and for NMR chemical shifts. In Sections 3 and 4, how molecular simulations based on ab initio methods have been used to relate vibrational and NMR spectral data to ligand structure/enzyme ligand interactions quantitatively will be reviewed.
2. RELATE SPECTRA TO STRUCTURES AND THERMODYNAMICS BY EMPIRICAL CORRELATIONS
2.1. Bond length/bond order versus frequency correlations
Early studies of simple di- and triatomic molecules suggest that the internuclear distances of polyatomic molecules can be predicted with considerable accuracy from vibrational data (Badger & Bauer, 1937). One such example is the linear correlation that relates the C=O bond length, L (in Å), with its stretch frequency, v (in cm−1), in various compounds (Horvath, Illenyi, Pusztay, & Simon, 1987; Tonge & Carey, 1992): LC=O = 2.00988–0.0004653vC=O. Bond distortions as small as 0.01–0.001 Å can be discerned by vibrational spectroscopy. It is at this level of atomic resolution that enzyme-induced bond distortions usually manifest themselves.
In addition, structural information about bonding in more complex molecular moieties, such as metal and nonmetal oxides, often can be obtained from vibrational spectroscopy by using two types of empirical relationships. One is the bond length/bond strength correlation pioneered by Brown and coworkers (Brown, 1992; Brown & Wu, 1976); the other is the bond strength–vibrational frequency correlation formulated by Hardcastle and Wachs (1991) and developed further by us (Deng, Wang, Ray, & Callender, 1998). In the Brown and Wu relationship, a network paradigm is used to define bond order, s, in terms of the average number of electron pairs per bond so that Σs for any atom in a crystalline compound is equal to the formal valence of that atom. When defined in this way, bond strength can be referred to as valence bond strength and is expressed in terms of valence units, vu (Ray, Burgner, Deng, & Callender, 1993). For the non-bridging P••O bonds of phosphates and vanadates, there exists very accurate empirically derived relationships between bond length/bond order and bond order/vibrational frequency. The equations for phosphates are (Deng, Wang, Ray, & Callender, 1998):
where s is the bond order of the PO bond (in vu), rPO is the length of the PO bond (in Å), and υ is the frequency of the phosphate stretch. The error in these relationships is estimated to be about ±0.04 vu and ±0.004 Å for bond orders and bond lengths, respectively, and better when estimating changes in the parameters for a given molecule as it goes from one environment to another (Cheng et al., 2002; Deng, Wang, Ray, & Callender, 1998; Wang, Xiao, Deng, Webb, & Callender, 1998). This methodology has also been applied to other polyatomic moieties such as vanadate (Deng, Wang, Callender, Grammer, & Yount, 1998; Deng, Callender, Huang, & Zhang, 2002).
2.2. Interaction energy versus frequency (Badger–Bauer) correlations
Badger and Bauer (1937) suggested quite some time ago that the enthalpy of formation of a hydrogen bond, ΔH, is linearly related to the vibrational frequency shift, Δv, of the O—H stretch frequency of an alcohol. A stronger hydrogen bond weakens (polarizes) the O—H bond and the stretch force constant; this gives rise to a significant decrease in the observed stretching frequency. Such thermodynamic correlations have been investigated by many workers, and Badger–Bauer relationships have been found for a number of O—H, C=O, N—H, and other groups in various molecules (see Callender & Deng, 1994; Carey, 2006). The exact relationship depends on the nature of the group and nearby chemical constituents. It also needs to be stressed that the interaction energy that is measured from the polarization of a polar group must be given as an effective interaction energy. It is more often than not for proteins that there is more than one proton donor to a C=O group, for example, and even long range electrostatic interactions that bring about the bond’s polarization.
2.3. Hydrogen bond length versus proton chemical shift correlations
In the studies of hydrogen bonding in proteins, it has been found that for relatively weak N—H O=C type of hydrogen bonds, the chemical shift change, Δδ (in ppm), of the NH proton resonance induced by the hydrogen bonding can be correlated with the distance, d (in Å), between H and O atoms (Wagner, Pardi, & Wuethrich, 1983): Δδ 19.2d−3 −2.3. Based on small molecule X-ray structure studies and solid state proton NMR studies on the same crystals, a correlation has been found for proton chemical shift δ (in ppm) and distance D (in Å) between heavy atoms for O—H O type hydrogen bonds. This correlation covers a much wider chemical shift range and has been used to study strong hydrogen bonds in proteins (Mildvan et al., 1999; Wei & McDermott, 1999): D¼5.04–1.16 ln(δ) + 0.0447δ.
3. ACTIVE SITE STRUCTURES BY VIBRATIONAL SPECTROSCOPY AND Ab INITIO ANALYSIS
As mentioned above, our structural studies on enzyme active site interactions typically start from the measurements of ligand spectra in enzyme–ligand complexes by vibrational spectroscopy. To characterize enzyme active site structures based on the vibrational data, normal mode analysis by ab initio calculations can be used. In such calculations, the geometries of the model systems, which typically include the ligand with and without several other molecular groups that interact with the ligand, are optimized by using ab initio methods implemented in commercial programs such as Gaussian program series. The frequency calculations are then performed on these optimized geometries and the results will be compared with experimental observations. The model systems may be adjusted structurally with certain constraints to find the best match between experiments and computations.
Ab initio methods for vibrational frequency calculations have been implemented in commercial programs in early 1990s and have also been applied for the studies of vibrational circular dichroism (cf. He, Wang, Dukor, & Nafie, 2011; Keiderling, Silva, Yoder, & Dukor, 1999; Nafie & Freedman, 1998). It is well known that structural calculations based on ab initio methods consistently overestimate the stretching force constants by about 20% at Hartree–Fock level (hence frequencies by about 10%) and even more for double bonds containing oxygen or nitrogen (Hehre, Radom, Schleyer, & Pople, 1986; Pulay, Fogarasi, Pongor, Boggs, & Vargha, 1983). More accurate frequencies may be obtained by including electron correlations, such as density function theory (DFT) in the calculations. To improve the agreement between experimental and computational results, an empirical scaling procedure may be applied to the calculated force constants. An example of the scaling procedure can be found in Section 3.2 (Deng, Wang, Callender, Grammer, & Yount, 1998). Since the focus of our studies is on the structural changes of the ligand upon binding to enzymes, the frequency changes of the molecular group of the ligand/enzyme are the main targets of our ab initio normal mode analysis. Typically, the calculated frequency changes are more accurate than the absolute frequencies because intrinsic errors in the ab initio computational methods are largely canceled when the frequency differences from two structurally similar molecules are considered.
3.1. Active site interactions in lactate dehydrogenase
Lactate dehydrogenase (LDH), normally existing as a 140 kDa tetramer, catalyzes the conversion between pyruvate (CH3COCOO−) and lactate (CH3CHOHCOO−), using NADH/NAD+ as cofactor. The hydride transfer from NADH to pyruvate is stereospecific, only from the A side (pro-R) hydrogen of the reduced nicotinamide to C2 of the pyruvate. This enzyme has been studied extensively by X-ray crystallography, and a number of structures of LDH from various sources complexed with cofactor NADH and a pyruvate analog, oxamate (NH2COCOO−), have been published (cf. Read, Winter, Eszes, Sessions, & Brady, 2001; Wigley et al., 1992). The active site contacts revealed by X-ray crystallography are shown in Fig. 5.1. The C2=O bond of oxamate forms hydrogen bonds with His195 and Arg109, both of them are likely positively charged (Burgner & Ray, 1984a, 1984b). The C1 carboxyl group of oxamate forms a guanidinium–carboxylate salt bridge which involves the active site Arg171 (Fig. 5.1). Here we show that vibrational spectroscopy coupled with normal mode analysis based on ab initio methods can reveal high-resolution active site structural features that could not be resolved in X-ray crystallographic studies.
Figure 5.1.
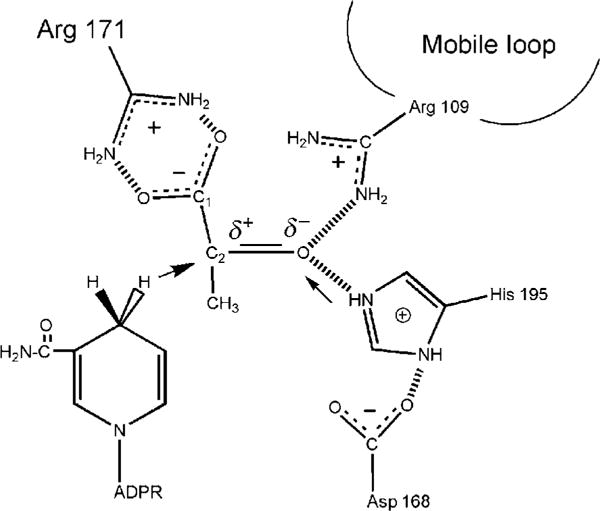
The active site contacts of pyruvate and NADH bound to lactate dehydrogenase (LDH) with key residues as determined by X-ray crystallography. The reaction catalyzed by LDH involves the direct transfer of a hydride ion from C4 of the reduced nicotinamide group of NADH to the C2 carbon of pyruvate accompanied by the protonation of pyruvate’s keto oxygen, the proton being supplied by His195 (the arrows in the diagram indicate the H− and H+ transfers). It is known that either electrostatic stabilization of the transition state in the pyruvate–lactate interconversion, which contains a highly polarized carbonyl moiety, +C─O−, or destabilization of the >C=O ground state (or a combination) is responsible for about half of the rate enhancement brought about by LDH. The other half of the rate enhancement comes about from bringing cofactor and substrate close together in a proper orientation and “activating” cofactor toward catalysis.
Determination of vibrational structure of molecular groups in protein is a two-step process: (1) determine vibrational modes of interests that are buried by all other protein bands. For this we developed isotope-edited difference Raman and FTIR spectroscopy. (2) Extract structural information of the molecular groups based on the observed vibrational modes, especially their changes upon binding to protein by empirical correlations or by ab initio normal mode calculations.
A typical protein we study contains a few hundred amino acid residues and has an average molecular weight of about 20–80 kDa/subunit. To discern a particular band from the protein background with a signal to noise ratio of ten to one requires a protein signal to noise in excess of 300/1. To capture specific structural features of the LDH-bound NADH, we can use Raman difference spectroscopy, in which the vibrational spectrum of the bound ligand is obtained by subtraction of the apoprotein spectrum from that of the complex that has been used for various enzyme systems (reviewed in Callender & Deng, 1994; Deng & Callender, 1999). Isotope editing extends the application of Raman difference spectroscopy to systems in which measurement of the apoprotein spectrum is not a viable option because the bound ligand induces too many protein conformational changes that show up in the difference spectrum or in cases where the apoprotein is unstable. An isotope-edited difference spectrum is formed between two protein–ligand complexes, one of which is specifically labeled with a stable isotope. Vibrational modes which are associated with the isotopic tag show as spectral shifts, and appear as positive–negative band pairs, in the difference spectrum, while all other bands cancel.
3.1.1 NADH conformational changes upon binding to LDH
3.1.1.1 Raman spectra of NADH in LDH binary and ternary complexes
Using NADH specifically labeled at A side (pro-R) or B side (pro-S) of the reduced nicotinamide with deuterium, the C–D stretch frequencies of the LDH-bound NADH have been determined for LDH/NADH and LDH/NADH/oxamate complexes (Fig. 5.2).
Figure 5.2.
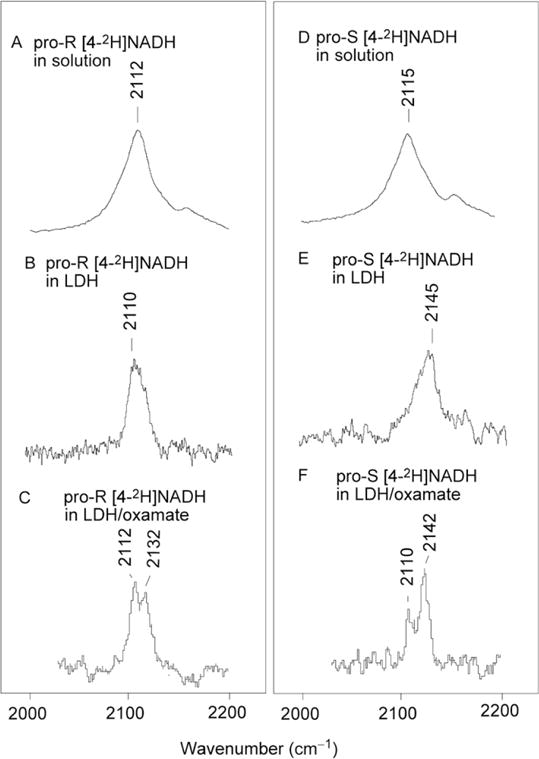
Raman difference spectra of (A) 100 mM pro-R [4 2H]NADH at 4 °C, G1/2=45 cm−1; (B) pro-R [4-2H]NADH in LDH (LDH·NADH=1.5/5 mM) at 4 °C, Γ1/2=16 cm−1; (C) pro-R [4-2H]NADH complexed with LDH·oxamate (LDH/NADH·oximate=1.5/5/5 mM) at 4 °C, Γ1/2 = 6 cm−1 for either the 2112 or 2132 cm−1 band; (D) 100 mM pro-S [4-2H]NADH at 4 °C, Γ1/2=45 cm−1; (E) pro-S [4-2H]NADH in LDH (LDH·NADH=1.5/5 mM) at 4 °C, Γ1/2=22 cm−1; (F) pro-S [4-2H]NADH complexed with LDH·oxamate (LDH/NADH·oximate=1.5/5/5 mM) at 4 °C Γ1/2 = 6 cm−1 for either the 2110 or 2124 cm−1 band. All spectra were obtained by subtracting the corresponding NADH spectrum taken under the same conditions. Adapted with permission from Chen et al. (2002). Copyright (2002) American Chemical Society.
Upon NADH binding to LDH, two major changes in the C4–D stretch frequencies of the reduced nicotinamide ring are observed: the average of the two C4–D frequencies is increased by 14 cm−1 and the frequency difference between the two C4–D stretch modes is increased by 32 cm−1. Furthermore, upon oxamate binding, two well resolved C4–D bands are observed using either pro-R or pro-S side deuterium labeling. The intensity ratios of these two bands are approximately 2:1 in both cases. In order to understand these spectral changes in terms of nicotinamide structural changes quantitatively, we have performed normal mode analysis based on quantum mechanical ab initio and semiempirical calculations (Deng, Burgner, & Callender, 1992; Deng, Zheng, Sloan, Burgner, & Callender, 1992).
3.1.1.2 Carboxylamide orientation change
According to our ab initio normal mode analysis of the NADH Raman spectra in solution and bound to LDH, the orientation of the C=O bond of the reduced nicotinamide carboxylamide group is changed from cisoid (relative to C2=C3 bond of the nicotinamide) in solution (Fischer, Fleckenstein, & Hones, 1988) to transoid in LDH (Deng, Burgner, & Callender, 1992). The orientation of the amide group affects the C4–D stretch frequency of the reduced nicotinamide ring. A rotation of the C=O bond from cisoid to transoid will raise both C4–D stretches by about 10–20 cm−1 (Deng, Zheng, Sloan, Burgner, & Callender, 1992). Hence, we expect that the average frequency of the two C4–D stretches will increase as NADH binds to LDH. The dependence of the C4–D stretch on the orientation of the amide does not affect significantly the difference in frequency between pro-S and pro-R C4–D stretch modes.
3.1.1.3 Ring puckering
An important structural factor contributing to the difference between the two C4–D stretch frequencies is the formation of a nonplanar ring. The two bonds have equal force constants for a planar symmetrical reduced nicotinamide ring and, hence, equal stretch frequencies. This degeneracy is split, however, as the ring is deformed. For example, bringing the C4 carbon out of the ring plane by 10–15°, thereby deforming the reduced nicotinamide ring into a “boat,” was found to decrease the stretch frequency of the axial bond by 5–14 cm−1 while increasing the equatorial bond by 11–18 cm−1, creating a difference between the two stretch frequencies of 16–32 cm−1 (Deng, Zheng, Sloan, Burgner, & Callender, 1992). The results of these calculations are consistent with vibrational studies on other bent ring systems (Rafilipomanana, Cavagnat, & Lassegues, 1985).
3.1.1.4 Nicotinamide ring conformations in LDH/NADH/oxamate ternary complex
Based on the analysis given above, the reduced nicotinamide ring in LDH/NADH/oxamate ternary complex clearly adopts two conformations as evidenced by the two well resolved bands in each of the two C4–D labeled NADH spectra (Chen, van Beek, Deng, Burgner, & Callender, 2002). The major conformer is similar to the conformer found in the binary complex where the pro-R C4 deuteron is brought to a pseudoaxial and the pro-S deuteron in pseudoequatorial geometry. In the minor conformer (about half of the major population), the pro-R C4 deuteron is pseudoequatorial and the pro-S deuteron is pseudoaxial. Smaller frequency difference between pro-R and pro-S C4–D frequencies in the minor conformer (22 cm−1) compared to that in the major conformer (32 cm−1) suggests a smaller ring puckering. In all cases, the C4–D stretch bands have narrowed considerably from the binary complexes, indicating significantly constraint ring puckering motions in the ternary complex. In addition, carboxylamide C=O bond is in transoid orientation relative to the C2=C3 bond of the reduced nicotinamide.
3.1.2 Oxamate active site contacts in LDH/NADH/oxamate ternary complex
3.1.2.1 Isotope-edited oxamate IR spectra in solution and in LDH/NADH oxamate complex
In isotope-edited IR spectroscopy, a difference measurement is made between unlabeled and specifically labeled compounds. Thus, only vibrational modes affected by the isotopic labeling will be observed in such spectra. Figure 5.3 shows the isotope-edited IR spectra between oxamate and 13C2 oxamate (a) and between oxamate and 13C1 oxamate (b) in solution (left panel) and in the LDH/NADH oxamate complexes (right panel). Positive peaks are due to unlabeled oxamate and negative peaks are due to 13C labeled oxamate. As shown in Fig. 5.3, the 13C labeling on C2 caused a 44 cm−1 shift of the 1664 cm−1 band to 1620 cm−1 and it can be assigned to the oxamate C2=O stretch mode. The 13C labeling on C1 caused a 46 cm−1 shift of the 1634 cm−1 band to 1588 cm−1 and it can be assigned to the asymmetric stretch mode of the C1 carboxylate group. The band width at half maximum in these solution spectra is typically ~30 cm−1. Since the strong protein amide I band between 1640 and 1690 cm−1 overlaps with the oxamate C2=O stretch, which is also an amide band, some interference on the C2=O stretch mode of the oxamate in the LDH/NADH oxamate complex may occur. In addition, our normal mode analysis on the oxamate bound in the LDH ternary complex suggests that the oxamate carboxyl and the oxamate amide motions are more likely to become coupled in the unlabeled oxamate than in the 13C labeled oxamate, especially for 13C1 labeled oxamate (Deng et al., 2011). Thus, frequencies from 13C labeled oxamate are used as standards in our subsequent discussions.
Figure 5.3.
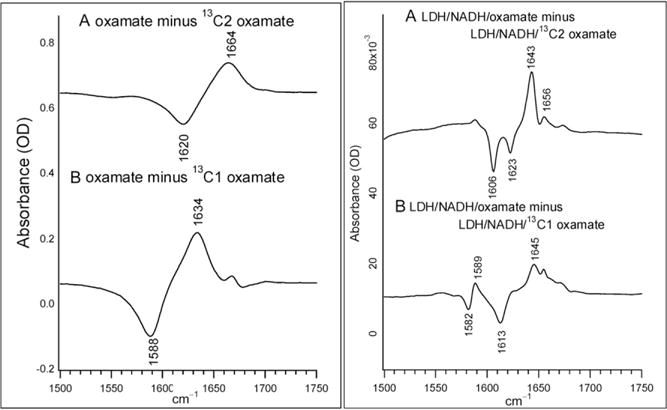
Difference FTIR spectra of (A) oxamate minus13C2 labeled oxamate; (B) oxamate minus 13C1 labeled oxamate. The sample concentrations were 100 mM prepared in D2O at neutral pH. The temperature was kept at 25 C. Sample cell was composed of CaF2 windows with 30 μm thick spacer. (A) The difference FTIR spectrum between LDH/NADH/oxamate and LDH/NADH/13C2 oxamate. (B) The difference FTIR spectrum between LDH/NADH/oxamate and LDH/NADH/13C1 oxamate. All samples were prepared in 50 mM phosphate, 150 mM NaCl, pH 7.2 in D2O at 25 C. Sample concentrations were 4 mM (LDH):4 mM (NADH):4 mM (oxamate). Sample cell was composed of CaF2 windows with 12 μm thick spacer. Adapted with permission from Deng et al. (2011). Copyright (2011) American Chemical Society.
3.1.2.2 Oxamate C2=O polarization in LDH
C=O stretch mode is quite strong in Raman or IR spectra and in some cases quantitative correlation between hydrogen bonding energy and C=O stretch frequency can be determined (Tonge & Carey, 1992; White & Wharton, 1990). Thus, it is ideally suited for the studies of the substrate C=O bond activation in the enzyme complexes. Ab initio calculations have also been used to aid the development of hydrogen bonding energy versus NH/OH chemical shift or C=O stretch frequency correlations. For example, one of the studies found a correlation between interaction energy between the C=O bond of a simple molecule and its hydrogen bonding/ionic interaction partners and the shift of the C=O stretching frequency (Latajka & Scheiner, 1990).
For 13C2 labeled oxamate, two IR bands are observed in the complex (Fig. 5.3A, right panel): a major band at 1606 cm−1 and a minor band at 1623 cm−1. Their unlabeled counterparts can also be clearly identified at 1643 and 1656 cm−1, respectively. This indicates that oxamate exists in two different forms in the complex with approximately 2:1 population ratio. In the major form, the oxamate C2=O bond experiences a stronger hydrogen bonding than in solution, as revealed by the 14 cm−1 red shift of its C2=O stretch frequency, from 1620 cm−1 in solution (Fig. 5.3A, left panel) to 1606 cm−1 in the complex (Fig. 5.3A, right panel). In the minor form, the hydrogen bond to the oxamate C2=O bond is similar or may be slightly weaker than that in solution, as indicated by the 3 cm−1 blue shift of the C2=O stretch frequency, from 1620 cm−1 in solution to 1623 cm−1 in the complex. One noticeable difference compared to the solution spectra is the band width at half maximum decreases from 30 to 6–7 cm−1, indicating well-defined structure/environment for these two forms of bound oxamate.
3.1.2.3 Formation of salt bridge between oxamate C1OO− and active site Arg171
For 13C1 labeled oxamate, a major band at 1613 cm−1 is observed in the isotope-edited spectra of the LDH/NADH oxamate complex (Fig. 5.3B, left panel). This band can be assigned to the 13C1OO− asymmetric stretch mode based on its 32 cm−1 shift upon 13C labeling from the 1645 cm−1 band observed in its unlabeled counterpart. Its frequency shifts up by 25 cm−1 relative to the solution value, suggesting a large environmental change near C1OO− moiety in the complex. Like the results from the difference spectrum with 13C2 labeled oxamate, two or more IR bands >1640 cm−1 in the unlabeled oxamate complex were observed (Fig. 5.3B, right panel). However, in clear contrast with the results from 13C2 labeled oxamate (Fig. 5.3A, right panel), there is only one IR band above 1600 cm−1 in the 13C1 labeled oxamate complex. This indicates the oxamate carboxyl group experiences similar environments in the complex. One explanation is that, in the LDH/NADH oxamate complex, the carboxyl asymmetric stretch is coupled with motions of other portions of oxamate and this coupling is removed upon 13C1 labeling. This suggestion is supported by our ab initio vibrational analysis performed on a carboxyl–guanidinium model system (Deng et al., 2011). Interestingly, another minor derivative feature at 1589/1582 cm−1 is also observed in Fig. 5.3B, right panel. Since its 13C isotope shift is only 7 cm−1, it cannot be due to an isolated (localized) C1 carboxyl stretch mode. Ab initio studies revealed that this is a distributed vibrational mode unique for the carboxylate–guanidinium salt bridge, involving the motions from both oxamate carboxyl and the guanidinium moiety of the Arg171 side chain (Deng et al., 2011). Thus, this mode can be used as the reporter for the breaking/formation of the salt bridges upon oxamate binding to the LDH complex.
3.1.3 Active site structures in LDH Michaelis complex
In summary, our vibrational studies coupled with molecular simulations based on ab initio normal mode calculations have shown how these tools can be used to characterize high-resolution structure features of the enzyme active site that cannot be recognized based on X-ray structures alone. For LDH/NADH/oxamate ternary complex, two active site structures with ~2:1 population ratio are present. In both structures, the salt bridge between oxamate C1OO− and Arg171 guanidinium group serves as the anchor for oxamate in the complex. The orientation of the NADH carboxylamide C=O bond is transoid with respect to C2=C3 bond of the nicotinamide. In the major structure (Fig. 5.4), the hydrogen bonding to the oxamate C2=O group from enzyme is strong enough to significantly polarize this bond. In addition, the nicotinamide ring is puckered toward the bound oxamate and to render its pro-R C4 proton in the axial position. All these structural features were predicted to occur in the transition state of hydride transfer reactions by theoretical studies (Almarsson & Bruice, 1993; Basner & Schwartz, 2005; Wu & Houk, 1993). Thus, this active site structure simulates Michaelis complex, a structure along the reaction path of LDH-catalyzed reaction.
Figure 5.4.
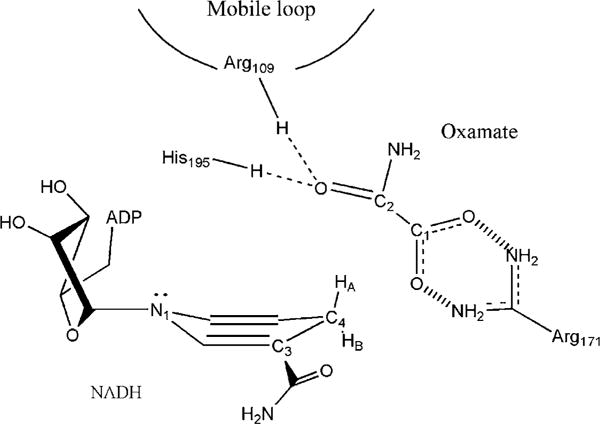
The major form of active site structures and contacts in LDH/NADH/oxamate complex revealed by vibrational spectroscopy and ab initio calculations.
In the other active site structure of the complex, the nicotinamide ring puckers toward the pro-S side to move pro-R hydrogen away from the bound oxamate. The oxamate C2=O in this structure is in a more hydrophobic environment, unlikely to form hydrogen bonding to LDH active site residue, protonated His195. Our recent kinetic studies based on IR temperature-jump relaxation spectroscopy suggest that this minor structure cannot convert to the major structure kinetically without going through another conformational state, thus unlikely resembles a state along the reaction path (Deng et al., 2008).
3.2. Phosphate and vanadate distortions in the enzyme active site
Many enzymes catalyze phosphoryl/phosphate transfer reactions and in some cases, vanadate can occupy the active site of these enzymes to form transition state analogs. Various studies have been focused on the determination of the structures of enzyme-bound phosphate and vanadate in order to understand the reaction mechanism (For recent reviews, see Crans, Smee, Gaidamauskas, & Yang, 2004; Lassila, Zalatan, & Herschlag, 2011). As discussed in Section 2, empirical correlations for phosphate/vanadate bond length and vibrational frequencies have been developed for this purpose. In this section, we describe how computational studies based on ab initio calculations may be used to help the determination of the highly distorted structures of the enzyme-bound phosphate/vanadate.
3.2.1 Vanadate structure in myosin transition state analog
The thick and thin filaments of muscle are made up primarily of myosin and actin. In muscle contraction, these proteins slide past each other through an interaction between the globular heads of the two proteins. The binding of ATP reduces the affinity of myosin for actin, and the subsequent hydrolysis of ATP results in a metastable ternary complex myosin ADP Pi. The release of ADP and Pi is catalyzed by the rebinding of actin. Overall, the energy needed to drive the sequence of steps leading to the myosin/actin sliding motion is driven by the hydrolysis of ATP.
The myosin S1 MgADP Vi complex is presumed to be a transition state analog for the phosphoryl transfer reaction catalyzed by myosin. The Raman spectra of the nonbridging V••O bonds in the myosin S1 MgADP Vi complex and in a vanadate solution model compound have been obtained using Raman difference spectroscopic techniques (Fig. 5.5, left and middle panels). We have used normal mode analysis based on ab initio calculations to help determining the vanadate structure and its interaction with active site environments in the complex (Deng, Wang, Callender, Grammer, & Yount, 1998). In this study, both frequencies and Raman intensities of the vanadate vibrational modes are considered in the calculations.
Figure 5.5.
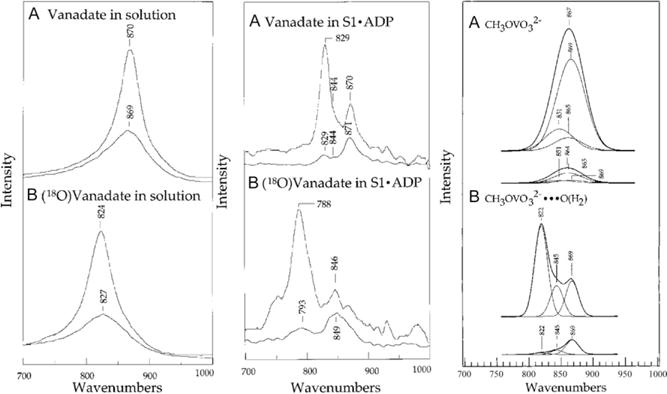
Observed and calculated vanadate spectra in solution and in myosin transition state analog. Left panel: (A) Raman spectrum of HVO42− in solution. The top curve is the parallel polarized spectrum with the Raman excitation laser beam parallel to the spectrometer’s entrance slit plane while the bottom graph is the perpendicular spectrum (excitation laser beam perpendicular to the spectrometer’s entrance slit plane). (B) same as (A) except prepared in 18O water. Middle panel: (A) Raman difference spectrum between myosin S1·MgADP·Vi complex and myosin S1·MgADP·AlF4− complex, using parallel and perpendicularly polarized Raman excitation beam (B) same as (A) except prepared in 18O water. Right panel: (A) Calculated Raman spectrum of dianionic methylvanadate based on ab initio normal mode analysis followed by force constant scaling as described in the text. The top curve is the simulated parallel polarized spectrum and the bottom curve is the perpendicular polarized spectrum. (B) Calculated Raman spectrum of dianionic methylvanadate complexed with a water molecule at a water oxygen–vanadium distance of 2.5 Å to simulate the vanadate environment in myosin. The top curve is the simulated parallel polarized spectrum and the bottom curve is the perpendicular polarized spectrum. Adapted with permission from Deng, Wang, Callender, Grammer, & Yount (1998). Copyright (1998) American Chemical Society.
To overcome the well-known problems in the ab initio vibrational analysis, namely the underestimation of the V••O bond length and over estimation of the V••O vibrational frequencies, scaling factors for the calculated force constants of the isolated vanadate were determined such that the calculated vanadate Raman spectra can match the observed vanadate spectra in solution. Once a set of satisfactory scaling factors is obtained, calculations on a series of models of the vanadate moiety simulating myosin S1 MgADP Vi complex are then performed. The calculated force fields from these model vanadate complexes are scaled, using the scaling factors determined from the calculations on the isolated model complex, to produce the vibrational modes, Raman intensities, and polarization dependencies. Raman spectra of these vanadate model complexes are then compared with that found of the bound vanadate in S1 MgADP Vi complex. It had been found that the calculated Raman spectra (Fig. 5.5 right panel) of a vanadate model complex with a water molecule placed at 2.5 Å from the vanadium atom and opposite of the bridging V—O bond of methylvanadate dianion can best match the experimental observation, as shown in Fig. 5.5.
According to the results of calculations, the average V••O bond length is about 0.009 Å longer in the 2.5 Å model complex than that in isolated vanadate while the average angle between two adjacent nonbridging V••O bonds is increased by about 4.4°, from 111.2° in isolated vanadate dianion to 115.6− in the 2.5 Å model complex. Our studies also suggested that the attacking nucleophile at the myosin-binding site, observed only as an oxygen in the X-ray results, is a neutral water molecule rather than an OH− ion (Deng, Wang, Callender, Grammer, & Yount, 1998).
3.2.2 Phosphate activation in purine nucleoside phosphorylase
Purine nucleoside phosphorylase (PNP) catalyzes the reversible phosphorolysis of the N-ribosidic bond of 6-oxypurine nucleosides and deoxynucleosides. The transition state inhibitor immucillin-H (ImmH) was developed to resemble the transition state of bovine PNP and binds to this enzyme with a of 23 pM, ~106-fold tighter (~8 kcal/mol) than substrate inosine (Kicska et al., 2002; Lewandowicz & Schramm, 2004; Miles, Tyler, Furneaux, Bagdassarian, & Schramm, 1998). X-ray structural studies have revealed extensive hydrogen bonds to the phosphate moiety in PNP ImmH PO4 (Fedorov et al., 2001). However, the electronic state of enzyme-bound phosphate nucleophiles cannot be determined from the structure. We have used isotope-edited vibrational spectroscopy on this transition state analog complex of human PNP, PNP ImmH PO4, to investigate how PNP activates the phosphate nucleophile near the transition state (Deng, Lewandowicz, Schramm, & Callender, 2004) and the spectroscopic results are shown in Fig. 5.6.
Figure 5.6.
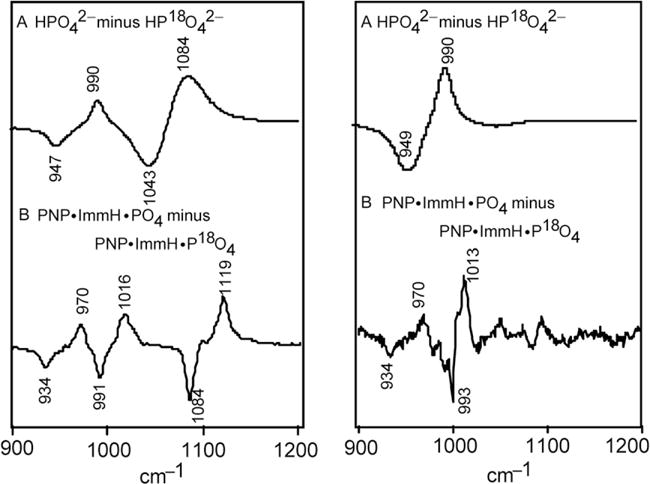
The difference FTIR (left panel) and difference Raman (right panel) spectra between P16O4 and P18O4 (A) in aqueous solution at pH 9.5 (dianionic) and (B) in the PNP·ImmH·PO4 complex (4 mM:4 mM:4 mM, pH 7.2). The positive bands are from P16O4 and the negative bands are from P18O4. The resolutions for IR and Raman spectra were 2 and 8 cm−1, respectively. Adapted with permission from Deng, Lewandowicz, Schramm, & Callender (2004). Copyright (2004) American Chemical Society.
To understand how the enzyme active site interactions cause the drastic changes of the phosphate vibrational spectra upon binding to the complex, normal mode analysis using ab initio calculations on phosphate with or without external hydrogen bonding/electrostatic interactions was carried out. The results of calculations indicate that electrostatic interaction and hydrogen bonding to one of the P••O oxygens from dianionic phosphate may cause the observed spectral changes. The bond length of the polarized P••O bond is 0.02–0.03 Å longer than the other two P••O bonds. This 0.02–0.03 Å increase in the P••O bond is 20–25% of the bond length change from a P••O bond to a bridging P—O—C bond and is expected at the transition state before phosphate forms a covalent bond to C1′ of ribose in the reaction catalyzed by PNP. This unusual bond distortion of bound phosphate in the PNP ImmH PO4 complex supports the that this complex captures a unique proposal point on the reaction coordinate with features of the PNP transition state.
3.3. Ligand–protein interactions in other enzyme systems
Ab initio calculations are often used to discriminate the tautomeric forms and/or conformations of small molecules based on their calculated relative energies. Our studies show that the structural determinations would be more reliable when such calculations are coupled to the analysis of the spectroscopic data of the molecules, as demonstrated in a case study on dihydrofolate reductase (DHFR) as shown below (Deng & Callender, 1998). In addition to structural determination, ab initio calculations may be used to determine quantitative correlation for the vibrational frequency shifts of a simple molecular group (e.g., C=O) and the interaction energy between a molecular group and its hydrogen bonding partner (Latajka & Scheiner, 1990). Our studies show that the frequency shifts–interaction energy correlation may be determined by an approach using integrated ab initio calculations and experimental methods for an amide, in which strong electronic and vibrational couplings between C=O and N—H groups exist (Deng, Schindler, Berst, Plapp, & Callender, 1998).
Besides these two case studies reviewed below, ab initio calculations have also been used in a number of other enzyme systems such as the tautomeric state of inhibitor in nucleoside hydrolase (Deng et al., 1996) and adenosine deaminase (Deng, Kurz, Rudolph, & Callender, 1998); the active site contacts with phosphate in c-Harvey ras protein (Wang et al., 1998); and the ionic state of pyrophosphate and its distortions in the active site of hypoxanthine–guanine phosphoribosyltransferase (Deng, Callender, Schramm, & Grubmeyer, 2010). These applications have shown that vibrational analyses based on quantum mechanical ab initio normal mode calculations have the potential to bring vibrational spectroscopy to the level of a general analytical tool.
3.3.1 Substrate ionic state in DHFR
DHFR catalyzes the reduction of 7,8-dihydrofolate (H2 folate) to 5,6,7,8-tetrahydrofolate by facilitating the addition of a proton to N5 of H2 folate and the transfer of a hydride ion from NADPH to C6. A study using difference Raman spectroscopy of the DHFR/NADP+/H2 folate complex (Chen, Kraut, Blakley, & Callender, 1994), believed to be an accurate mimic of the productive DHFR/NADPH/H2 folate complex, identified two N5=C6 stretch “marker” bands indicating unprotonated (1650 cm−1) or protonated (1675 cm−1) N5. A titration study, using the 1650 and protonated 1675 cm−1 marker bands as indicators for unprotonated and protonated species, respectively, showed that the pKa of N5 is raised from 2.6 in solution to 6.5 in this complex (Chen et al., 1994). This interpretation of the Raman data suggests that the protonation of N5 precedes the hydride transfer in DHFR catalysis (Fig. 5.7).
Figure 5.7.
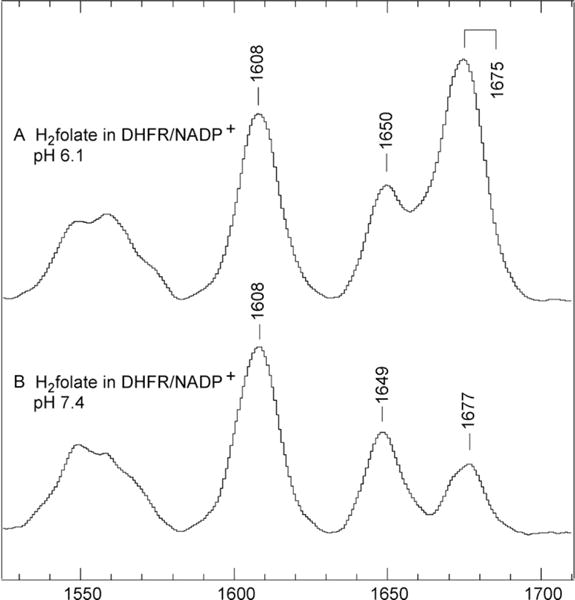
pH dependence of the intensities of the pKa = 6.5. Difference Raman spectra between DHFR/NADP+·H2 folate and DHFR/NADP+ at pH 6.1 and pH 7.4. The C=NH stretch band is at 1675 cm−1 and the C=N stretch band is at 1650 cm−1. Adapted with permission from Chen et al. (1994). Copyright (1994) American Chemical Society.
However, an alternative interpretation of the Raman results was published based on ab initio chemical calculations (Cannon, Garrison, & Benkovic, 1997). The conclusion of the computational study was that the N5 of H2 pterin is likely to be unprotonated inside DHFR because the N5 protonated form of H2 folate is far less favorable energetically compared to other tautomeric forms, especially the 4-hydroxy,N5 unprotonated form. Based on their calculations, the two N5=C6 stretch peaks observed in the Raman spectrum of H2 folate in the DHFR/NADP+/H2 folate complex were assigned to arise from the 4-hydroxy and 4-oxy, N5 unprotonated H2 pterin rings, rather than from the 4-oxy,N5 unprotonated and protonated H2 pterins. This assignment suggests that the H2 pterin ring of H2 folate is 4-hydroxy,N5 unprotonated in the Michaelis complex, and the reaction mechanism involves a concerted hydride transfer from C4 of NADPH to C6 of H2 pterin and proton transfer to N5 (Cannon et al., 1997), rather than a stepwise reaction mechanism in which the hydride transfer occurs after the proton transfer as suggested in the original Raman studies (Chen et al., 1994).
Since the Raman results are used as the experimental support for both proposed reaction mechanisms, which are mutually exclusive, correct interpretation of the Raman data is important for elucidating mechanism. Thus, extensive ab initio vibrational frequencies calculations were carried out on various model systems of H2 pterin in order to find out which of the interpretations of the Raman data is correct (Deng & Callender, 1998). In these calculations, we have found that it is important to not only consider the conformation/tautomerization of H2 pterin, but also consider its interactions with environments, such as external carboxyl group and/or water molecule/methyl group. The calculations take into account the observed deuteration shifts of the N5=C6 stretch and probe what interactions at the DHFR-binding site might be important for affecting the vibrational spectra of the bound substrate. The results of the computational work show that the 1675 cm−1 band is indeed from the protonated C5=N6 stretch mode. In addition, the ab initio normal mode analysis indicates that there is no water molecule within the hydrogen bonding distance of the N6—H bond of H2 pterin in the complex. Instead, a methyl group from Met20 is likely in its vicinity (Deng & Callender, 1998).
3.3.2 Determination of interaction energies in LADH
N-Cyclohexylformamide (CXF) binds to the horse liver alcohol dehydrogenase (LADH)/NADH binary complex in a way which mimics the Michaelis aldehyde complex for the aldehyde to alcohol chemistry catalyzed by this enzyme. The Raman spectra of bound CXF and its 13C and 15N substituted derivatives have been obtained using Raman difference techniques, and the results are compared with CXF spectra in aqueous solution and in methylene chloride. Our results indicate that the amide N—H bond is trans to the C=O bond of CXF in both solution and in the enzyme ternary complex. The C=O stretch and N—H bending modes of the amide of CXF shift −16 and −9 cm−1, respectively, in the enzyme ternary complex relative to that in aqueous solution and −48 and +36 cm−1, respectively, relative to that in methylene chloride (Deng, Schindler, Berst, Plapp, & Callender, 1998).
Ab initio normal mode calculations on various model systems of CXF (Fig. 5.8) show that the observed frequency changes of the C=O stretch mode have contributions from the frequency changes induced by the environmental changes near both the local C=O bond and the remote N—H bond. The same is true for the observed N—H bending frequency change. Our calculations also show that the environmentally induced frequency changes are additive so that it is possible to determine the C=O stretch (or N—H bending) frequency change that is due to the local interaction change near C=O (or N—H) bond from the observed frequency changes. Based on these results and the empirical relationship between the C=O stretch frequency shift and the interaction enthalpy change on the C=O bond developed here, it is found that the C=O group of CXF in LADH/NADH/CXF binds with a favorable interaction enthalpy of approximately 5.5 kcal/mol relative to water. Similar analysis suggests that the N—H moiety of CXF is destabilized in the ternary complex by about 1.5 kcal/mol relative to water but is stabilized by about 1.5 kcal/mol relative to a hydrophobic environment. On the basis of these observations, we conclude that the amide moiety of CXF contributes a net of about 4.0 kcal/mol of enthalpic energy stabilizing inhibitor binding to the protein (Deng, Schindler, Berst, Plapp, & Callender, 1998).
Figure 5.8.

Model complex for quantitative determination of interaction energies on N-cyclohexylformamide (CXF) NH and C=O groups in LADH/NADH·CXF complex.
Using ab initio calculations and experimental measurements, the linear relationship between ΔH and Δv of the C=O stretch for CXF has also been determined (Deng, Schindler, Berst, Plapp, & Callender, 1998). Since the effect on the C=O stretch from hydrogen bonding on C=O and NH groups of amide cannot be separately determined experimentally, the calculations are necessary to determine the effect on C=O frequency from the hydrogen bonding on NH group, so that this contribution can be excluded from the correlation between hydrogen bonding energy on C=O bond and its stretch frequency. The correlation is found to be ΔΔHCXF (kcal/mole) = 0.26Δv (cm−1) for the CXF C=O stretch mode (Deng, Schindler, Berst, Plapp, & Callender, 1998).
4. ACTIVE SITE INTERACTIONS BY NMR AND AB INITIO CALCULATIONS
Since it has been shown that it is possible to extract protein structural information from NMR chemical shift data by ab initio calculations (de Dios, Pearson, & Oldfield, 1993), 13C and 15N chemical shift calculations have been used extensively for interpretation of NMR data to solve a variety of problems (for recent reviews, see Facelli, 2004; Lodewyk, Siebert, & Tantillo, 2012; Mulder & Filatov, 2010). The effects of molecular structure and environment on the chemical shift values of CH (Martin, AllenIII, & Moore, 2000; Rablen, Pearlman, & Finkbiner, 1999; Wang, Hinton, & Pulay, 2002) and OH (Lampert, Mikenda, Karpfen, & Kählig, 1997) protons in small molecules have also been studied using ab initio proton chemical shift calculations. It has been found that 15NH chemical shifts are sensitive to the molecular conformation as well as to hydrogen bonding and electrostatics (de Dios et al., 1993; Facelli & deDios, 1999). In order to reproduce the experimentally observed 15N chemical shifts, it is essential to include the hydrogen bonding partners in the calculation models (Facelli & deDios, 1999; Hu, Facelli, Alderman, Pugmire, & Grant, 1998; Laxer, Major, Gottlieb, & Fischer, 2001). Previous ab initio 1H chemical shift calculations also suggest that the effect of hydrogen bonding on 1HN/1HO chemical shift is particularly significant (de Dios et al., 1993; Westler, Weinhold, & Markley, 2002).
To characterize enzyme active contacts based on ab initio analysis of NMR chemical shifts of bound ligands, we used an approach that is similar to our ab initio analysis of vibrational data: first, 15N and 1H chemical shift changes of a ligand are determined by isotope-edited NMR methods when the ligand is transferred from solution to enzyme. Ab initio chemical shift calculations on various model systems that contain the ligand and its surrounding environment will then be performed to interpret the experimental observations as shown below.
Hypoxanthine (Hx) with specific 15N labels has been used to probe active site interactions with PNP by NMR spectroscopy (Deng et al., 2004). Hx binds to PNP as the N—7H tautomer, and the N—7H 1H and 15N chemical shifts are located at 13.9 and 156.5 ppm, respectively, similar to the solution values. In contrast, the 1H and 15N chemical shifts of N—1H in the PNP Hx complex are shifted downfield by 3.5 and 7.5 ppm, respectively, to 15.9 and 178.8 ppm, respectively, upon binding. Thus, external perturbation to Hx at N—1H is stronger than at N—7H in the complex.
Ab initio chemical shift calculations on model systems that simulate Hx in solution and bound to PNP are used to interpret the NMR data (see Fig. 5.9 for model systems). Ab initio 1H and 15N chemical shielding tensor calculations were made on model systems using the GIAO method as implemented in the Gaussian computational package. The calculations were carried out at the DFT B3LYP level of theory with the 6–311(d,p) basis set. Geometries were first optimized at the same level of theory but with either 6–311(d,p) or 6–31(d,p) basis sets. In general, the calculated isotropic chemical shielding values can be converted to chemical shift values observed in solution NMR experiments by a linear scaling procedure for a better fit (de Dios et al., 1993; Rablen et al., 1999; Wang et al., 2002 Wang, 2002 #1919). Since our goal is to model the chemical shift changes of a molecule under different environments, we did not use this scaling scheme. We subtracted the calculated isotropic shielding values from a constant to convert them to chemical shift values so that they can be compared with the experimentally determined chemical shifts. The constant was 32 for 1H, and 225 for 15N.
Figure 5.9.
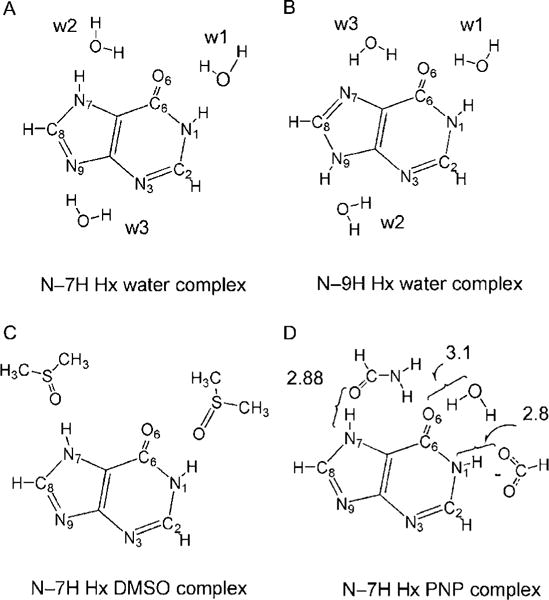
Molecular models for hydrogen bonding in hypoxanthine (Hx) systems include up to three water molecules complexed with each tautomer of Hx (models A and B). Models C and D were used to simulate more realistically the two environments of N–7H Hx in our NMR measurements: in DMSO solution and in purine nucleoside phosphorylase (PNP) active site. Adapted with permission from Deng, Cahill, et al. (2004). Copyright (2004) American Chemical Society.
The calculated proton chemical shifts of Hx in these model systems are shown in Fig. 5.10. Our calculations indicate that the experimental N—7H chemical shift changes upon Hx binding to PNP are caused by competing effects of two active site contacts. Hydrogen bonding of Glu201 to N—1H causes upfield shifts of the N—7H group, while the local hydrogen bond (C=O to N—7H from Asn243) causes downfield shifts. The observed N—7H chemical shift can be reproduced by a hydrogen bond distance ~0.13 Å shorter (but within experimental error of the X-ray structure with 2.0 Å resolution) of the experimental value found in the X-ray crystal structure of the bovine PNP Hx complex. The combined use of NMR and ab initio chemical shift computational analysis provides a novel approach to understand enzyme–ligand interactions in PNP, a target for anticancer agents. This approach has the potential to become a high-resolution tool for structural determination.
Figure 5.10.
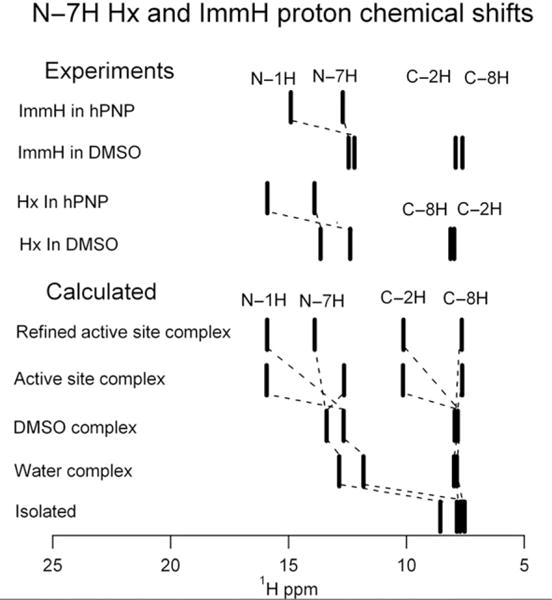
Comparison between observed and calculated 1H chemical shifts of Hx under indicated conditions. The lines for “ImmH in DMSO” and “ImmH in hPNP” are proton NMR chemical shifts from immucillin-H (ImmH) in 55% DMSO/45% acetonitrile and from the complex with the transition state analog ImmH (hPNP·ImmH·PO4), respectively. The “isolated” complex was calculated in vacuum, the “water complex” is as shown in Fig. 5.9B, the “DMSO” complex is as shown in Fig. 5.9C, the “Active site complex” is as in Fig. 5.9D, taken from PDB file 1A9R, and the “Refined active site complex” has the H bond to N-7 shortened by 0.13 Å from that shown in Fig. 5.9D. Adapted with permission from Deng, Cahill, et al. (2004). Copyright (2004) American Chemical Society.
5. CONCLUSION
Characterization of enzyme active site structure and interactions at high resolution is important for the understanding of the enzyme catalysis. Vibrational frequency and NMR chemical shift measurements of enzyme-bound ligands are often used for such purpose when X-ray structures are not available or when higher resolution active site structures are desired. This review is focused on how ab initio calculations may be integrated with vibrational and NMR chemical shift measurements to quantitatively determine high-resolution ligand structures (up to 0.001 Å for bond length and 0.01 Å for hydrogen bonding distance) and how interaction energies between bound ligand and its surroundings at the active site may be determined. Quantitative characterization of substrate ionic states, bond polarizations, tautomeric forms, conformational changes and its interactions with surroundings in enzyme complexes that mimic ground state or transition state can provide snapshots for visualizing the substrate structural evolution along enzyme-catalyzed reaction pathway. Our results have shown that the integration of spectroscopic studies with theoretical computation greatly enhances our ability to interpret experimental data and significantly increases the reliability of the theoretical analysis.
Acknowledgments
This work is supported by NIH research grants GM068036 and EB001958. The author also wishes to thank Prof. R. Callender for his academic support.
References
- Almarsson O, Bruice TC. Evaluation of the factors influencing reactivity and stereospecificity in NAD(P)H dependent dehydrogenase enzymes. Journal of the American Chemical Society. 1993;115:2125–2138. [Google Scholar]
- Badger RM, Bauer SH. Spectroscopic studies of the hydrogen bond. II. The shift of the O–H vibrational frequency in the formation of the hydrogen bond. Journal of Chemical Physics. 1937;5:839–855. [Google Scholar]
- Basner JE, Schwartz SD. How enzyme dynamics helps catalyze a chemical reaction in atomic detail: A transition path sampling study. Journal of the American Chemical Society. 2005;127:13822–13831. doi: 10.1021/ja043320h. [DOI] [PubMed] [Google Scholar]
- Brown ID. Chemical and steric constraints in inorganic salts. Acta Crystallographica. 1992;B48:553–572. [Google Scholar]
- Brown ID, Wu KK. Empirical parameters for calculating cation-oxygen valences. Acta Crystallographica. 1976;B32:1957–1959. [Google Scholar]
- Burgner JW, Ray WJ. On the origin of lactate dehydrogenase induced rate effect. Biochemistry. 1984a;23:3636–3648. doi: 10.1021/bi00311a010. [DOI] [PubMed] [Google Scholar]
- Burgner JW, Ray WJ. The lactate dehydrogenase catalyzed pyruvate adduct reaction: Simultaneous general acid–base catalysis involving an enzyme and an external catalysis. Biochemistry. 1984b;23:3626–3635. doi: 10.1021/bi00311a009. [DOI] [PubMed] [Google Scholar]
- Callender R, Deng H. Non-resonance Raman difference spectroscopy: A general probe of protein structure, ligand binding, enzymatic catalysis, and the structures of other biomacromolecules. Annual Review of Biophysics and Biomolecular Structure. 1994;23:215–245. doi: 10.1146/annurev.bb.23.060194.001243. [DOI] [PubMed] [Google Scholar]
- Cannon WR, Garrison BJ, Benkovic SJ. Electrostatic characterization of enzyme complexes: Evaluation of the mechanisms of catalysis of dihydrofolate reductase. Journal of the American Chemical Society. 1997;119:2386–2395. [Google Scholar]
- Carey PR. Spectroscopic characterization of distortion in enzyme complexes. Chemical Reviews. 2006;106:3043–3054. doi: 10.1021/cr0502854. [DOI] [PubMed] [Google Scholar]
- Chen YQ, Kraut J, Blakley RL, Callender R. Determination by Raman spectroscopy of the pKa of N5 of dihydrofolate bound to dihydrofolate reductase: Mechanistic implications. Biochemistry. 1994;33:7021–7026. doi: 10.1021/bi00189a001. [DOI] [PubMed] [Google Scholar]
- Chen YQ, van Beek J, Deng H, Burgner J, Callender R. Vibrational structure of NAD(P) cofactors bound to several NAD(P)-linked enzymes: An investigation of ground state activation. Journal of Physical Chemistry. 2002;106:10733–10740. [Google Scholar]
- Cheng H, Nikolic-Hughes I, Wang JH, Deng H, O’Brian PJ, Wu L, et al. Environmental effects on phosphoryl group bonding probed by vibrational spectroscopy: Implications for understanding phosphoryl transfer and enzymatic catalysis. Journal of the American Chemical Society. 2002;124:11295–11306. doi: 10.1021/ja026481z. [DOI] [PubMed] [Google Scholar]
- Crans DC, Smee JJ, Gaidamauskas E, Yang L. The chemistry and biochemistry of vanadium and the biological activities exerted by vanadium compounds. Chemical Reviews. 2004;104:849–902. doi: 10.1021/cr020607t. [DOI] [PubMed] [Google Scholar]
- de Dios AC, Pearson JG, Oldfield E. Secondary and tertiary structural effects on protein NMR chemical shifts: An ab initio approach. Science. 1993;260:1491–1496. doi: 10.1126/science.8502992. [DOI] [PubMed] [Google Scholar]
- Deng H, Brewer SH, Vu DV, Clinch K, Callender R, Brian Dyer R. On the pathway of forming enzymatically productive ligand–protein complexes in lactate dehydrogenase. Biophysical Journal. 2008;95:804–813. doi: 10.1529/biophysj.108.128884. [DOI] [PMC free article] [PubMed] [Google Scholar]
- Deng H, Burgner J, Callender R. Raman spectroscopic studies of the effects of substrate binding on coenzymes bound to lactate dehydrogenase. Journal of the American Chemical Society. 1992;114:7997–8003. [Google Scholar]
- Deng H, Cahill S, Lewandowicz A, Callender R, Schramm V, Jones R. Active site contacts in the purine nucleoside phosphorylase–hypoxanthine complex by NMR and ab initio calculations. Biochemistry. 2004;43:15966–15974. doi: 10.1021/bi048167i. [DOI] [PubMed] [Google Scholar]
- Deng H, Callender R. The structure of dihydrofolate when bound to dihydrofolate reductase. Journal of the American Chemical Society. 1998;120:7730–7737. [Google Scholar]
- Deng H, Callender R. Raman spectroscopic studies of the structures, energetics, and bond distortions of substrates bound to enzymes. Methods in Enzymology. 1999;308:176–201. doi: 10.1016/s0076-6879(99)08010-6. [DOI] [PubMed] [Google Scholar]
- Deng H, Callender R. Vibrational studies of enzymatic catalysis. In: Gremlich H-U, Yan B, editors. Infrared and Raman spectroscopy of biological materials. New York: Marcel Dekker, Inc; 2001. pp. 477–515. [Google Scholar]
- Deng H, Callender R, Huang Z, Zhang ZY. Is the PTPase–vanadate complex a true transition state analog? Biochemistry. 2002;41:5865–5872. doi: 10.1021/bi016097z. [DOI] [PubMed] [Google Scholar]
- Deng H, Callender R, Schramm VL, Grubmeyer C. Pyrophosphate activation in hypoxanthine–guanine phosphoribosyltransferase with transition state analogue. Biochemistry. 2010;49:2705–2714. doi: 10.1021/bi100012u. [DOI] [PMC free article] [PubMed] [Google Scholar]
- Deng H, Chan AW, Bagdassarian CK, Estupinan B, Ganem B, Callender RH, et al. Trypanosomal nucleoside hydrolase. Resonance Raman spectroscopy of a transition-state inhibitor complex. Biochemistry. 1996;35:6037–6047. doi: 10.1021/bi9526544. [DOI] [PubMed] [Google Scholar]
- Deng H, Wang J, Ray WJ, Callender R. Relationship between bond stretching frequencies and internal bonding for [16O4] and [18O4] phosphates in aqueous solution. The Journal of Physical Chemistry B. 1998;102:3617–3623. [Google Scholar]
- Deng H, Kurz LC, Rudolph FB, Callender R. Characterization of hydrogen bonding in the complex of adenosine deaminase with a transition state analogue: A Raman spectroscopic study. Biochemistry. 1998;37:4968–4976. doi: 10.1021/bi9727904. [DOI] [PubMed] [Google Scholar]
- Deng H, Lewandowicz A, Schramm VL, Callender R. Activating the phosphate nucleophile at the catalytic site of purine nucleoside phosphorylase: A vibrational spectroscopic study. Journal of the American Chemical Society. 2004;126:9516–9517. doi: 10.1021/ja049296p. [DOI] [PubMed] [Google Scholar]
- Deng H, Schindler JF, Berst KB, Plapp BV, Callender R. A Raman spectroscopic characterization of bonding in the complex of horse liver alcohol dehydrogenase with NADH and N-cyclohexylformamide. Biochemistry. 1998;37:14267–14278. doi: 10.1021/bi981477e. [DOI] [PubMed] [Google Scholar]
- Deng H, Vu DV, Clinch K, Desamero R, Dyer RB, Callender R. Conformational heterogeneity within the Michaelis complex of lactate dehydrogenase. The Journal of Physical Chemistry B. 2011;115:7670–7678. doi: 10.1021/jp2015929. [DOI] [PMC free article] [PubMed] [Google Scholar]
- Deng H, Wang J, Callender RH, Grammer JC, Yount RG. Raman difference spectroscopic studies of the myosin S1 MgADP vanadate complex. Biochemistry. 1998;37:10972–10979. doi: 10.1021/bi980556n. [DOI] [PubMed] [Google Scholar]
- Deng H, Zheng J, Sloan D, Burgner J, Callender R. A vibrational analysis of the catalytically important C4–H bonds of NADH bound to lactate or malate dehydrogenase: Ground state effects. Biochemistry. 1992;31:5085–5092. doi: 10.1021/bi00136a022. [DOI] [PubMed] [Google Scholar]
- Facelli J. Calculations of chemical shieldings: Theory and applications. Concepts in Magnetic Resonance Part A. 2004;20A:42–69. [Google Scholar]
- Facelli JC, deDios AC. Modeling NMR chemical shifts: Gaining insights into structure and environment. Oxford: Oxford University Press; 1999. p. 373. [Google Scholar]
- Fedorov A, Shi W, Kicska G, Fedorov E, Tyler PC, Furneaux RH, et al. Transition state structure of purine nucleoside phosphorylase and principles of atomic motion in enzymatic catalysis. Biochemistry. 2001;40:853–860. doi: 10.1021/bi002499f. [DOI] [PubMed] [Google Scholar]
- Fischer P, Fleckenstein J, Hones J. Spectroscopic investigation of dihydronicotinamides-I: Conformation, absorption, and fluorescence. Photochemistry and Photobiology. 1988;47:193–199. doi: 10.1111/j.1751-1097.1988.tb02714.x. [DOI] [PubMed] [Google Scholar]
- Hardcastle FD, Wachs IE. Determination of vanadium–oxygen bond distances and bond orders by Raman spectroscopy. Journal of Physical Chemistry. 1991;95:5031–5041. [Google Scholar]
- He Y, Wang B, Dukor RK, Nafie LA. Determination of absolute configuration of chiral molecules using vibrational optical activity: A review. Applied Spectroscopy. 2011;65:699–723. doi: 10.1366/11-06321. [DOI] [PubMed] [Google Scholar]
- Hehre WJ, Radom L, Schleyer PVR, Pople JA. Ab-initio molecular orbital theory. New York: Wiley; 1986. [Google Scholar]
- Horvath G, Illenyi J, Pusztay L, Simon K. Relationship between the IR frequencies and bond lengths in carbonyl groups. Acta Chimica Hungarica. 1987;124:819–822. [Google Scholar]
- Hu JZ, Facelli JC, Alderman DW, Pugmire RJ, Grant DM. 15N chemical shift tensors in nucleic acid bases. Journal of the American Chemical Society. 1998;120:9863–9869. [Google Scholar]
- Keiderling TA, Silva RA, Yoder G, Dukor RK. Vibrational circular dichroism spectroscopy of selected oligopeptide conformations. Bioorganic & Medicinal Chemistry. 1999;7:133–141. doi: 10.1016/s0968-0896(98)00217-x. [DOI] [PubMed] [Google Scholar]
- Kicska GA, Tyler PC, Evans GB, Furneaux RH, Shi W, Fedorov A, et al. Atomic dissection of the hydrogen bond network for transition-state analogue binding to purine nucleoside phosphorylase. Biochemistry. 2002;41:14489–14498. doi: 10.1021/bi026636f. [DOI] [PubMed] [Google Scholar]
- Lampert H, Mikenda W, Karpfen A, Ka¨hlig H. NMR shieldings in benzoyl and 2-hydroxybenzoyl compounds. Experimental versus GIAO calculated data. The Journal of Physical Chemistry A. 1997;101:9610–9617. [Google Scholar]
- Lassila JK, Zalatan JG, Herschlag D. Biological phosphoryl-transfer reactions: Understanding mechanism and catalysis. Annual Review of Biochemistry. 2011;80:669–702. doi: 10.1146/annurev-biochem-060409-092741. [DOI] [PMC free article] [PubMed] [Google Scholar]
- Latajka Z, Scheiner S. Correlation between interaction energy and shift of the carbonyl stretching frequency. Chemical Physics Letters. 1990;174:179–184. [Google Scholar]
- Laxer A, Major DT, Gottlieb HE, Fischer B. (15N5)-Labeled adenine derivatives: Synthesis and studies of tautomerism by 15N NMR spectroscopy and theoretical calculations. Journal of Organic Chemistry. 2001;66:5463–5481. doi: 10.1021/jo010344n. [DOI] [PubMed] [Google Scholar]
- Lewandowicz A, Schramm VL. Transition state analysis for human and Plasmodium falciparum purine nucleoside phosphorylases. Biochemistry. 2004;43:1458–1468. doi: 10.1021/bi0359123. [DOI] [PubMed] [Google Scholar]
- Lodewyk MW, Siebert MR, Tantillo DJ. Computational prediction of 1H and 13C chemical shifts: A useful tool for natural product, mechanistic, and synthetic organic chemistry. Chemical Reviews. 2012;112:1839–1862. doi: 10.1021/cr200106v. [DOI] [PubMed] [Google Scholar]
- Martin NH, Allen NW, III, Moore JC. An algorithm for predicting the NMR shielding of protons over substituted benzene rings. Journal of Molecular Graphics and Modelling. 2000;18:242–246. doi: 10.1016/s1093-3263(00)00031-0. [DOI] [PubMed] [Google Scholar]
- Mildvan AS, Harris TK, Abeygunawardana C. Methods in enzymology. Vol. 308. New York: Academic Press; 1999. Nuclear magnetic resonance methods for the detection and study of low-barrier hydrogen bonds on enzymes; pp. 219–245. [DOI] [PubMed] [Google Scholar]
- Miles RW, Tyler PC, Furneaux RH, Bagdassarian CK, Schramm VL. One-third-the-sites transition-state inhibitors for purine nucleoside phosphorylase. Biochemistry. 1998;37:8615–8621. doi: 10.1021/bi980658d. [DOI] [PubMed] [Google Scholar]
- Mulder FA, Filatov M. NMR chemical shift data and ab initio shielding calculations: Emerging tools for protein structure determination. Chemical Society Reviews. 2010;39:578–590. doi: 10.1039/b811366c. [DOI] [PubMed] [Google Scholar]
- Nafie LA, Freedman TB. Vibrational circular dichroism: An incisive tool for stereochemical applications. Enantiomer. 1998;3:283–297. [PubMed] [Google Scholar]
- Pulay P, Fogarasi G, Pongor G, Boggs JE, Vargha A. Combination of theoretical ab initio and experimental information to obtain reliable harmonic force constants. Scaled quantum mechanical (SQM) force fields for glyoxal, acrolain, butadiene, formaldehyde, and ethylene. Journal of the American Chemical Society. 1983;105:7037. [Google Scholar]
- Rablen PR, Pearlman SA, Finkbiner J. A comparison of density functional methods for the estimation of proton chemical shifts with chemical accuracy. Journal of Physical Chemistry A. 1999;103:7357–7363. [Google Scholar]
- Rafilipomanana C, Cavagnat D, Lassegues JC. Infrared and Raman study of the monodeuterated four and five membered rings. Part 2. v(C–D) stretching vibration of cyclopentene-2-d1 in the gas and the condensed phases. Journal of Molecular Structure. 1985;129:215–227. [Google Scholar]
- Ray WJ, Jr, Burgner JW, Deng H, Callender R. Internal chemical bonding in solutions of simple phosphates and vanadates. Biochemistry. 1993;32:12977–12983. doi: 10.1021/bi00211a005. [DOI] [PubMed] [Google Scholar]
- Read JA, Winter VJ, Eszes CM, Sessions RB, Brady RL. Structural basis for altered activity of M- and H-isozyme forms of human lactate dehydrogenase. Proteins: Structure, Function, and Bioinformatics. 2001;43:175–185. doi: 10.1002/1097-0134(20010501)43:2<175::aid-prot1029>3.0.co;2-#. [DOI] [PubMed] [Google Scholar]
- Tonge PJ, Carey PR. Forces, bond lengths, and reactivity: fundamental insight into the mechanism of enzyme catalysis. Biochemistry. 1992;31:9122–9125. doi: 10.1021/bi00153a002. [DOI] [PubMed] [Google Scholar]
- Wagner G, Pardi A, Wuethrich K. Hydrogen bond length and proton NMR chemical shifts in proteins. Journal of the American Chemical Society. 1983;105:5948–5949. [Google Scholar]
- Wang B, Hinton JF, Pulay P. Accurate prediction of proton chemical shifts. II. Peptide analogues. Journal of Computational Chemistry. 2002;23:492–497. doi: 10.1002/jcc.10044. [DOI] [PubMed] [Google Scholar]
- Wang JH, Xiao DG, Deng H, Webb MR, Callender R. Raman difference studies of GDP and GTP binding to c-Harvey ras. Biochemistry. 1998;37:11106–11116. doi: 10.1021/bi980471m. [DOI] [PubMed] [Google Scholar]
- Wei Y, McDermott AE. Effects of hydrogen bonding on 1H chemical shifts. In: Facelli JC, deDios AC, editors. Modeling NMR chemical shifts: Gaining insights into structure and environment. Oxford: Oxford University Press; 1999. pp. 177–193. [Google Scholar]
- Westler WM, Weinhold F, Markley JL. Quantum chemical calculations on structural models of the catalytic site of chymotrypsin: Comparison of calculated results with experimental data from NMR spectroscopy. Journal of the American Chemical Society. 2002;124:14373–14381. doi: 10.1021/ja027735j. [DOI] [PubMed] [Google Scholar]
- White AJ, Wharton CW. Hydrogen-bonding in enzymatic catalysis. Biochemical Journal. 1990;270:627–637. doi: 10.1042/bj2700627. [DOI] [PMC free article] [PubMed] [Google Scholar]
- Wigley DB, Gamblin SJ, Turkenburg JP, Dodson EJ, Piontek K, Muirhead H, et al. Structure of a ternary complex of an allosteric lactate dehydrogenase from Bacillus stearthermophilus at 2.5 Å resolution. Journal of Molecular Biology. 1992;223:317–335. doi: 10.1016/0022-2836(92)90733-z. [DOI] [PubMed] [Google Scholar]
- Wu YD, Houk KN. Theoretical study of conformational features of NAD+ and NADH anologs: Protonated nicotinamide and 1,4-dihydronicotinamide. Journal of Organic Chemistry. 1993;58:2043–2045. [Google Scholar]