

Abstract
The tumor-promoting potential of CCL5 has been proposed but remains poorly understood. We demonstrate here that an autocrine CCL5-CCR5 axis is a major regulator of immunosuppressive myeloid cells (IMC) of both monocytic and granulocytic lineages. The absence of the autocrine CCL5 abrogated the generation of granulocytic myeloid-derived suppressor cells and tumor-associated macrophages. In parallel, enhanced maturation of intratumoral neutrophils and macrophages occurred in spite of tumor-derived CCL5. The refractory nature of ccl5-null myeloid precursors to tumor-derived CCL5 was attributable to their persistent lack of membrane-bound CCR5. The changes in the ccl5-null myeloid compartment subsequently resulted in increased tumor-infiltrating cytotoxic CD8+ T cells and decreased regulatory T cells in tumor-draining lymph nodes. An analysis of human triple-negative breast cancer specimens demonstrated an inverse correlation between “immune CCR5” levels and the maturation status of tumor-infiltrating neutrophils as well as 5-year-survival rates. Targeting the host CCL5 in bone marrow via nanoparticle-delivered expression silencing, in combination with the CCR5 inhibitor Maraviroc, resulted in strong reductions of IMC and robust anti-tumor immunities. Our study suggests that the myeloid CCL5-CCR5 axis is an excellent target for cancer immunotherapy.
Keywords: CCL5-CCR5, Immunosuppressive myeloid cells, Breast Cancer, Nanotechnology, Maraviroc
Introduction
Altered myelopoiesis in which immature immunosuppressive myeloid cells are generated and expanded has been long associated with tumor growth. To date, immunosuppressive myeloid cells (IMCs) have been documented to include myeloid-derived suppressor cells (MDSCs), tumor-associated neutrophils (TANs), tumor-associated dendritic cells (TADCs) and tumor-associated macrophages (TAMs) (1-4). MDSCs are further divided into two subsets based on expression levels of Ly6C and Ly6G: monocytic (M-MDSCs, Ly6Chigh/Ly6G−) and granulocytic (G-MDSCs, Ly6Clow/−/Ly6Ghigh) (5). TANs and G-MDSCs are ambiguously defined by same markers (CD11b+/Ly6G+). The pro-tumor TAN (namely N2, as opposed to anti-tumor N1) has been considered to be G-MDSCs. On the other hand, M-MDSCs (also referred as CCR2+/Ly6C+ inflammatory monocytes) are able to differentiate to TADCs and TAMs (6). Importantly, it was recently demonstrated that TAMs can originate directly from bone marrow (BM), rather than being alternatively activated from mature macrophages (2, 7).
Ample evidence indicates that the mechanisms utilized by these IMCs include, but are not limited to, production of reactive oxygen species (ROS), nitric oxide (NO), IL-10 and TGFβ, nitration of T cell specific chemokines and T cell receptors (TCRs), ineffective co-stimulations, induction of T regulatory cells (Tregs), and exhaustion of CD8+ T cells (4, 5, 7, 8).
The gene encoding CC chemokine ligand 5 (CCL5) is amplified in human breast cancers (9). Antagonism of CCL5-CCR5 signaling of cancer cells has been hypothesized to prevent metastasis (10). We previously observed the generation of aberrant MDSCs in 4T1 tumor-bearing ccl5−/− mice (11). However, important questions remain unanswered, such as whether the aberrant ccl5−/− MDSCs are functionally-deprived, the mechanism by which myeloid CCL5 regulates MDSCs, and how to specifically target myeloid CCL5. We revisited the subject and identified the autocrine CCL5-CCR5 axis as a profound player in myeloid compartment. It essentially determine the immunosuppressive phenotypes of all major IMCs, including granulocytic G-MDSCs / TANs and monocytic TAMs. An immunohistochemistry analysis of triple negative breast cancer (TNBC) specimens showed that this CCL5-CCR5 axis also regulated IMCs in patients. Due to the off-target activation of tumor-promoting myeloid cells by Fc-portion of an antibody (12), it is necessary to develop non-antibody tools to specifically inhibit the autocrine CCL5-CCR5 signaling in BM. We explored the efficacy of porous silicon-based, BM CCL5-targeting nanoparticles, and its synergistic effects with FDA-approved CCR5 inhibitor, Maraviroc. Our studies point to a great potential of an immunotherapy targeting myeloid CCL5-CCR5 axis.
Materials and Methods
Mice
WT BALB/c, WT C57BL/6 mice and ccl5−/− mice on C57BL/6 background were purchased from the Jackson Laboratories (ME, USA). ccl5−/− mice on BALB/c background were generated as previously described (11). All mice were maintained in a pathogen-free facility. All animal protocols are proved by the Research Animal Resource Center at Weill Cornell Medicine.
Cell Lines
4T1 cell line (CRL-2539) was obtained from ATCC in 2012. Cells were maintained RPMI-1640 supplemented with 10% fetal bovine serum, 2 mM glutamine and 100 U/mL penicillin and 100 μg/mL streptomycin (referred as complete media hereafter). The cell line was most recently authenticated in March of 2017 by Genetica DNA Laboratories. The authentication test involved generating STR DNA profiles of the 4T1 cell line for 15 independent human genetic sites and amelogenin (the sex identity locus), and confirmed the lack of human cell contamination.
Breast Tumor Models and Tumor Measurement
4T1 and PyMT breast tumor model were established as described previously (13, 14). In our studies, 5 × 10⁴ 4T1 cells and 1 × 10⁶ primary PyMT cells / matrigel (B.D.Bioscience) mixture were subcutaneously injected into the mammary pad of adult female BALB/c mice and C57BL/6 mice respectively. Tumors were measured every other day using an electronic caliper. Tumor volume was calculated using the equation (length × width2)/2. The mean value of tumor volumes of each group were used to plot tumor growth curves.
Cell Sorting
BM-MDSCs (CD11b+/Gr-1+) were sorted as described previously (11). To sort BM Ly6C+ M-MDSCs, the sorted CD11b+/Gr-1+ were briefly treated with multisort stop reagent, and further negatively selected against Ly6G via a LD column, followed by positive selection against Ly6C via a LS column. To sort tumor-infiltrating MDSCs, tumor were minced and digested with tissue dissociation buffer [0.25% collagenase IV (384 unit/mg, worthington), 0.2% Dipase II (Roche) and 0.01% DNase I (Sigma) in HBSS] with periodic vortexing for 1 hour in 37°C water bath. Digested tissues were mashed through 70 μm filters, layered on a 20% and 80% Percoll gradient (GE), and centrifuged at 2800 rpm for 20 min without brake. Cells at the interface were collected and negatively selected by anti-B220, -CD4 and -CD8 microbeads via a LD columns, followed by a positive selection by anti-CD11b microbeads via LS columns to obtain CD11b+/Gr-1+ intratumoral MDSCs. To further separate intratumoral Ly6C+ from Ly6G+, CD11b+/Gr-1+ cells were treated with multisort stop reagent, followed by anti-Ly6G microbeads via a LS column. The Ly6G-depleted population was further selected via Ly6C microbeads via 2nd LS column. All the sorted cells were ≥ 85% viable. The purities of BM-MDSCs and tumor-infiltrating MDSCs are ∼95% and ∼81% respectively (verified by flow cytometry). All microbeads and columns were from Miltenyi Biotechnology.
Flow Cytometric Analysis
The erythrocyte-depleted single cell suspension from BM, inguinal lymph nodes and tumor (as described in Cell Sorting) were incubated with anti-FcγR antibody, followed by incubation with fluorescently labeled antibodies. Ly6G-PE, Ly6C-PerCP/Cy5.5, CD11b-FITC, CD4-PE/Cy7, and MHCII- PE/Cy7 were purchased from Biolegend. Gr-1-PE, Foxp3-FITC, Granzyme B-PE, MHCII-PE, CD11b-PerCP/Cy5.5, LAMP2-eF660, and CD8-AF647 were purchased from eBioscience. PD-1-APC, CCR5-APC and CCR3-PE were purchased from Myltenyi Biotec. Purified anti-CCL5 (Peprotech), secondary APC-conjugated goat anti-rabbit (Columbia Bioscience), iNOS-FITC (BD Bioscience) and CCR2-APC (R&D), CCR1 (R&D) were also acquired from different commercial sources. Data acquisition was performed using FACScan (Becton Dickinson) and analyzed via FlowJo (Tree Star, Inc).
Evaluation of Secretion of NO and ROS
WT or ccl5−/− BM-MDSCs were cultured in complete media supplemented with GM-CSF (20ng/mL), IL-6 (20ng/mL) and 30% 4T1 supernatant (referred as MDSC media hereafter). Detection of NO (red) and ROS (green) was performed according to instruction manual of ROS/RNS Detection Kit (Enzo Life Science).
Enzyme-linked Immunosorbent Assay (ELISA)
1.5 × 10⁵ WT or ccl5−/− BM-MDSCs were seeded in 24 well plate with 0.5mL MDSC media. ELISA on TGFβ (R&D) and IL-10 (Biolegend) were performed as instructed by manufacturers. To stimulate IL-10 secretion, 0.5μg/mL LPS was added to the culture 24h before supernatant collection.
Evaluation of the Morphologies of Tumor-infiltrating Ly6G+ Cells
Tumor-infiltrating Ly6G+ cells sorted as described above were further sorted against Ly6G/Ly6C markers using BectonDickinso Vantage cell sorter. Sorted populations (P1-P3) loaded onto slides using the Cytospin (Thermo Scientific). Attached cells were fixed and dried, followed by hemotoxylin and erosin staining. Cell morphologies was evaluated under light microscopy (Olympus BX51, 60× oil).
RNA Isolation, RT-qPCR and RNA Sequencing
Total RNA was extracted from various sorted cell populations using RNeasy Plus Mini Kit (Qiagen). cDNA synthesis was performed using SuperScript VILO cDNA Sythesis Kit (Invitrogen Life Technology). RT-qPCR was performed on ABI PRISM 7900HT (Applied Biosystem). Second generation of RNA sequencing was performed by GenoIMCs Core Facilities at Weill Cornell Medicine. Primer information was listed in Supplement.
Phagocytosis Assay
Tumor-infiltrating Ly6Clow/−/Ly6Ghigh, Ly6Chigh/Ly6Ghigh and Ly6Cint/Ly6Gint cells sorted as described in “Evaluation of the Morphologies of Tumor-infiltrating Ly6G+ Cells” were cultured in MDSC media. After 2 hour initial culture, sorted Ly6G+ cells were co-cultured with sonicated fluorescence-labeled (494/518) Escherichia coli K-12 bioparticles (V6694, Life Technologies) for another 2-4 hours in dark. Phagocytosis abilities were evaluated according to manufacturer's instruction. BM-derived mature macrophages and 4T1 cells served as a positive control and a negative control respectively.
Immune Function Assay
Tumor-infiltrating MDSCs (Gr-1+/CD11b+) cells were sorted as described above. T cells isolated from splenocytes (B220 microbeads-mediated depletion, followed by CD4/CD8 microbeads-mediated selection) were stimulated with soluble CD3 (0.5μg/mL) and CD28 (0. 5μg/mL) antibodies in the presence of tumor-infiltrating MDSCs at different ratios in MDSC media for 6 hours. 10μM Edu was added to the culture, and cells were allowed to proliferate for another 18 hours. Proliferation was evaluated based on Edu incorporation according to manufacturer's instruction (C10337, Life technologies).
Immunoblotting
Same number of sorted MDSCs from different groups were lysed with SDS PAGE sample buffer (containing 0.2M DTT, 2% SDS, 5% glycerol, 0.06M Tris·Cl pH:6.8 and 0.002% bromophenol blue). Lysates were boiled briefly and separated with 8%-16% gradient SDS PAGE gel (Genescript) followed by standard transfer to nitrocellulose membranes and immunoblotting against various target proteins. Anti-Rb (C-15), anti-NOS2 (M-19), anti-p-JAK3 (Tyr980), anti-GAPDH (FL335) and anti-p-IκB-α (B-9) were purchased from Santa Cruz Biotechnology.
MDSC Adoptive Transfer
Adoptive transfer of MDSCs was performed between mice bearing 4T1 tumor at same stage. 5 × 10⁶ BM M-MDSCs (CD11b+/Ly6C+) sorted from ccl5−/− mice bearing 4T1 tumors were mixed with 25nM Qdot nanocrystal dye (Qtracker 525 Cell Labeling Kit, Life technologies) and incubated at a humidified atmosphere of 5% CO2 at 37°C for 2 h based on manufacturer's guidance book. Successful loading of green fluorescence were confirmed with flow cytometer. Green fluorescent ccl5−/− BM-MDSCs were injected intravenously into WT tumor-bearing recipient mice. Same adoptive transfer was performed from WT to WT as a control. Mice were sacrificed for endpoint analyses at 7-8th day post adoptive transfer.
Human Samples
All TNBC specimens were collected from Asian females with age ranging from 21 to 71 (detailed clinical profiles in Supplementary Table S1) at Xiangya Hospital, Central South University, China. All the clinical samples were surgically excised and immediately fixed with 10% neutral buffered formalin. All the patients signed an agreement of informed consent (IRB number: 201308381, Xiangya Hospital) for the use of their cancer samples and publication of the anonymized data.
Immunohistochemistry
Formalin-fixed paraffin-embedded TNBC sections from 128 patients were dewaxed and rehydrated in Xylene, 100% ethanol, 95% ethanol, 70% ethanol, 50% ethanol and PBS sequentially. Acidic antigen retrieval and serum blocking were performed before incubation with anti-human CCR5 primary antibody (R&D), followed by applications of biotinylated secondary antibody, Streptavidin-HRP, AEC-chromogen (R&D CTS003) and hematoxylin (CCR5: red to brown; hematoxylin: blue). After initial microscopic scanning on tumor sections, 62 out of 128 patients are eligible for calculating statistical significance (tumor sections which have more than 10 intratumoral neutrophils for evaluating the nuclear morphologies were considered eligible). Based on CCR5 levels of infiltrating immune cells, 62 patients were grouped into immune CCR5high (n=29) and immune CCR5low (n=33) groups. The corresponding H&E stained sections (4 sections/patient) were employed to evaluate the maturation status of neutrophils. Neutrophils with cloverleaf-shaped nuclei (3-4 nuclear lobes) were considered mature neutrophils. Immature neutrophils are mixed population with horseshoe-shaped or 2-lobed nuclei.
Mouse Treatments
MSV Nanoparticle Synthesis
Porous silicon-based multistage vector (MSV) nanoparticles were fabricated by electrochemical etching of silicon wafer, surface modified with 3-aminopropyltriethoxysilane (APTES), and conjugated with E-selectin thioaptamer (ESTA) as previously described (15). To prepare CCL5 siRNA polyplex, CCL5 siRNA oligos were mixed with PEG(5k)2–PEI(10k) (PEG–PEI) (nitrogen in cationic polymer: phosphorus in siRNA oligo ratio = 15:1) in 10 mM HEPES buffer containing 5% glucose, and incubated at 20°C for 15 min. To load CCL5 siRNA polyplex into ESTA-MSV, 200 μL polyplex suspension containing 20 μg siRNA was mixed with 1×10⁹ dry ESTA-MSV particles, and sonicated for 3 minutes on ice. The siRNA loading efficiency was 87.3 ± 0.9%. Tumor-bearing mice (PyMT and 4T1) were intravenously injected (i.v.) with 100 μL nanoparticles once a week.
Pharmacological inhibitor
Maraviroc was purchased from Sigma (PZ002). 4T1 tumor-bearing mice were treated with Maraviroc at 8mg/kg (i.p.) every day after tumor inoculation.
Statistical Analysis
Student's t-test was employed to calculate statistical significance for difference between groups. A P value of <0.05 was considered statistically significant (*P <0.05, ** P <0.01, *** P <0.001). Kaplan-Meier estimate was employed to analyze the 5-year-survival rates of TNBC patients.
Results
Enhanced maturation of intratumoral neutrophils in the absence of host CCL5
4T1 tumor microenvironment (TME) is a complex ecology that favors inflammation. CCL5 is one of the elevated chemokines in 4T1 TME (16). Therefore, 4T1-bearing ccl5−/− mice represent an excellent model to study CCL5-deficient myeloid cells in CCL5-sufficient milieu. Compared to WT mice, ccl5−/− mice have ∼50% rate of potent rejection (Supplementary Table S2) and much smaller total burden of engrafted 4T1 tumor (Fig. 1A). We inspected the hematoxylin and eosin (H&E) stained tumor sections from WT and ccl5−/− mice. Despite of comparable levels of tumor-derived CCL5 between WT and ccl5−/− hosts (Supplementary Fig. S1), marked morphology differences of intratumoral Ly6G+ cells were discerned. On tumor sections from WT, polymorphonuclear populations with horse-shoe-shaped nuclei were observed; in comparison, cells with hypersegmented / cloverleaf-shaped nuclei were observed on sections from ccl5−/− (Fig. 1B). The nuclear morphologies of ccl5−/− polymorphonuclear cells signify a more mature form of neutrophils (17), and have been associated with anti-cancer neutrophils, namely N1(1).
Figure 1.

Alterations of maturation status of myeloid granulocyte lineage in the absence of host CCL5. (A) ccl5−/− mice have significantly smaller total burden of 4T1 tumor. 4T1 tumor cells were transplanted into mammary pads of Balb/c WT or ccl5-/- mice. Representative tumor volumes, tumor weights (g) and tumor growth curves were shown as indicated. (B) H&E stained 4T1 tumor sections. Pictures are representative of six 4T1 tumors carried by WT or ccl5−/− mice. (C) Flow cytometric analysis of Ly6G/6C expression in tumor-infiltrating Ly6G+ cells sorted via magnetic beads from WT or ccl5−/− mice. (D) H&E staining of intratumoral Ly6Clow/−/Ly6Ghigh (P1, WT), Ly6Cint/ly6Gint (P2, ccl5−/−) and Ly6Chigh/Ly6Ghigh (P3, ccl5−/−) cells. Ly6G+ cells described in 1C were further FASC-sorted based on various Ly6G/6C levels. (E) Flow cytometric data showing side scatters of populations (P1-3) with various levels of Ly6C expression. (F) Flow cytometric analysis of LAMP2 expression in tumor-infiltrating P1 and P2. (G) Phagocytosed fluorescence of BM-derived macrophages, P1, P2 and P3 cells. Cells were sorted as described in 1D. (H) Flow cytometric analysis of CD86 and MHCII expression in tumor-infiltrating Ly6G+ cells sorted as described in 1C. Histogram shows CD86 expression of Ly6G-sorted / MHCII+−gated cells. Ly6G+ cells were magnetically sorted from 3-5 pooled 4T1 tumors / group, and data shown in 1A,1C-1H are representative of 2-5 independent experiments (3-5 mice/group). Phagocytosed fluorescence detection in 4 wells; mean ± SEM.
It is generally accepted that myeloid-derived suppressors are a heterogeneous population deviated from full maturation because of tumor-elicited inflammation (18). We postulated that such a deviation was dependent on host CCL5. We first sorted the Ly6G+ populations from 4T1 tumors via magnetic beads. Flow-cytometric analysis showed that the tumor-infiltrating Ly6G+ population spawned from WT BM consisted mostly of G-MDSCs (Ly6Clow/−/Ly6Ghigh, Population 1). Two distinct Ly6G+ populations in tumor carried by ccl5−/− mice were observed: Ly6Cint/Ly6Gint (Population 2) and Ly6Chigh/Ly6Ghigh (Population 3) (Fig. 1C). These populations referred as P1, P2 and P3 hereafter were further FACS-sorted and examined for cell morphologies using H&E staining. Consistently, the tumor-infiltrating P1 derived from WT BM are polymorphonuclear with nuclei curved into a horse-shoe shape, whereas the intratumoral P2 derived from ccl5−/− BM showed hypersegmented / cloverleaf-shaped nuclei. The cells of P3 showed ring-shaped nuclear morphology (Fig. 1D). The side-scatter parameters (SSCs) of these populations agreed with the microscopic observations: the cells of P2 had the highest SSCs (Fig. 1E), confirming the highly complex nuclear morphology of P2. In addition to the nuclear morphology, mature neutrophils exhibit significantly higher expression of lysosomal proteins and stronger phagocytosis activity than tumor-induced G-MDSCs (19). To verify that the P2 were mature neutrophils, we compared LAMP2 expression and phagocytosis abilities between WT P1 and ccl5−/− P2. The cells of ccl5−/− P2 demonstrated higher LAPM2 expression and stronger phagocytosis abilities than WT P1 (Fig.1F, 1G).
Lastly we examined the costimulatory molecule CD86 on sorted tumor-infiltrating Ly6G+ myeloid cells. Unlike CD80, CD86 is a co-stimulatory molecule usually associated with immunogenic antigen-presenting cells (APCs) (20), but not with immunosuppressive functioning of MDSCs (21, 22). The tumor-infiltrating Ly6G+/ MHCII+ cells from WT host expressed low levels of surface CD86. This co-stimulatory molecule was found to be positive on almost all MHCII+/Ly6G+ cells in tumor carried by ccl5−/− mice (Fig. 1H), suggesting that CCL5-deficient MHCII+/Ly6G+ cells more closely resemble mature APCs (23), and could possibly activate T cell responses.
Taken together, our findings indicate that host CCL5, but not tumor-derived CCL5, plays an important role in impeding the maturation of neutrophils under tumorigenesis-associated inflammation, hence facilitating the generation of immature Ly6G+ myeloid cells which are “immunosuppressive” in nature.
Arrested differentiation of ccl5−/− BM precursors into tumor-associated macrophages
It has been recently demonstrated that TAMs are different from alternatively activated macrophages (M2), and can directly derive from BM Ly6C+/CCR2+ inflammatory monocytes. In contrast to non-proliferative CD11bhigh/MHCIIhigh mammary tissue macrophages (MTMs), TAMs exhibit CD11blow/MHCIIhigh and CD11c+; they also proliferate upon differentiation (7). Proliferation is a feature ascribed to immature myeloid precursors, but not terminally-differentiated macrophages (24). Being positive for CD11c also blurs the identity of TAMs between a dendritic cell and a macrophage. We hypothesized that TAMs are a heterogeneous monocytic population prevented from full maturation in tumor, and might also be regulated by the host CCL5 signaling.
We first examined the precursor of TAMs in BM, and further traced the Ly6C+ cells in tumors. We noted the presence of extravasating inflammatory monocytes (CCR2+/CX3CR1low) (25) in WT BM, but not in ccl5−/− BM, in response to tumor growth (Fig. 2A). Approximately 76% of intratumoral Ly6C+ cells from WT were CCR2+ with up-regulation of F4/80, indicating an in situ transition from infiltrating monocytes to TAMs (7). In contrast, the equivalent intratumoral Ly6C+ cells from ccl5−/− BM were CCR2int/− with significantly less up-regulation of F4/80 in the presence of tumor-derived CCL5 (Fig. 2B). We further observed that TAMs (CD11blow/MHCIIhigh) dominated numerically over MTMs (CD11bhigh/MHCIIhigh) with a ratio of 2.5:1 in 4T1 tumors from WT hosts. Such a preponderance of TAMs over MTMs was not seen in tumors carried by ccl5−/− (Fig. 2C), suggesting that the differentiation to TAMs is possibly dependent on host CCL5. To accurately enumerate TAMs, tumor-infiltrating cells positive for Vcam1, CD11c and MHCII were counted using flow cytometer (7). We observed significantly less TAMs in ccl5−/− mice when compared with WT counterparts (P < 0.01) (Fig. 2D). In line with the proliferative feature of TAMs, the CD11b+/MHCII+-gated intratumoral cells from WT showed ∼70% Edu incorporation; in contrast, only ∼15% Edu incorporation was observed in the same cell population from ccl5−/− (Fig. 2E).
Figure 2.

Dependence of TAM differentiation on host CCL5. (A) Flow cytometric detection of inflammatory monocytes (CCR2+/CX3CR1low) in whole BM aspirates pooled from WT or ccl5−/− mice with or without 4T1 tumor. (B) Flow cytometric analysis of CCR2 and F4/80 in sorted Ly6C+ cells from pooled 4T1 tumors carried by WT or ccl5−/− mice. (C) Flow cytometric analysis of CD11bhigh/MHCII+ (MTMs) and CD11blow/MHCII+ (TAMs) in ungated single cell suspension of pooled 4T1 tumors carried by WT or ccl5−/− mice. (D) Quantification of CD11C+/MHCII+/VCAM1+ TAMs in 4T1 tumors carried by WT or ccl5−/− mice, mean± SEM. (E) Edu incorporation in sorted intratumoral CD11b+/MHCII+ cells from WT or ccl5−/− mice. Flow cytometric analysis was performed at 18 h after Edu addition. (F) Flow cytometric analysis for green emission of MTM and TAM populations in 4T1 tumors carried by recipient mice. All data are representative of 2-3 independent experiments with cells pooled from 3-5 Balb/c mice / group.
To determine if the failed differentiation from inflammatory monocytes to TAMs was a consequence of the absence of host CCL5 in BM, adoptive transfer of BM Ly6C+ cells from tumor-bearing ccl5−/− to WT counterparts was performed. CD11b+/Ly6C+ cells sorted from ccl5−/− BM were loaded with Qdot nanocrystal dye (green fluorescence 485/525) before intravenous (i.v.) transfer to tumor-bearing WT mice. As a control, WT CD11b+/Ly6C+ cells loaded with same dye were also transferred (i.v.) to tumor-bearing WT mice. TAMs (CD11blow/MHCIIhigh) and MTMs (CD11bhigh/MHCIIhigh) in recipient mice were gated and further analyzed against green fluorescence. As shown in Fig. 2F, the TAM population in mice that received ccl5−/− BM Ly6C+s was largely dim for green fluorescence; whereas the MTM population showed detectable emissions. These results indicate that the majority of TAMs were derived from endogenous WT myeloid precursors (non-fluorescent) rather than the adoptively transferred CD11b+/Ly6C+ cells from ccl5−/− BM (green fluorescent); in the same proinflammatory milieu, myeloid precursors derived from ccl5−/− BM inclined to differentiate into non-proliferative MTMs which more closely resemble mature macrophages. Such a preferential differentiation into MTMs was not seen when donor Ly6C+s were from WT BM. Collectively, these data reveal host CCL5 in BM as a critical player in the TAM differentiation during tumorigenesis.
Altered monocytic and granulocytic subtypes of GR-1+ cells in the absence of CCL5
Normal monocytes/macrophages and neutrophils share a common myeloid progenitor. As described above, both monocyte- and granulocyte-lineages are inclined toward more mature forms in a TME lacking host CCL5, but not tumor-derived CCL5. These observations prompted us to investigate their common BM precursors (Gr-1+ population) that comprises both immature granulocytes (Ly6G+) and TAM precursors (Ly6C+) (6).
We first sought to determine the cellular source of CCL5 in myeloid compartment by screening BM CD34+, CD90+ and Gr-1+/CD11b+ (MDSCs) cells for intracellular CCL5 expression. The analysis revealed that in both 4T1 and MMTV-PyMT (PyMT) mammary tumor models, BM Gr-1+/CD11b+ themselves secreted CCL5 after tumor inoculation (Supplementary Fig. S2, Fig. 3A and Supplementary Fig. S3).
Figure 3.

Suspended subtype-switching of MDSCs in the absence of autocrine CCL5. (A) CCL5 expression in BM MDSCs in response to 4T1 progression. (B) At ∼ 4 weeks post-inoculation, BM aspirates from WT and ccl5-/- mice with or without (naive) 4T1 tumor were analyzed flow cytometrically against Ly6C /Ly6G. (C) Sorted BM M-MDSCs (Ly6C+/Ly6G−) from naive WT and ccl5−/− mice were cultured in MDSC media for 4 days, followed by analysis on expressions of Ly6C and Ly6G before vs after culture. (D) BM MDSCs (Gr-1+/CD11b+) sorted from WT and ccl5−/− mice with (tumor: tu) or without (naïve:n) 4T1 tumor were subject to qPCR analysis of relative expression of Rb1 (upper, Rb1 mRNA in 4T1 cells was set to 1) and immunoblot analysis (lower). Data are representative of 2-4 experiments with cells pooled from 3-5 mice/group. qPCR in triplicates. mean ± SEM.
When compared to MDSCs in tumor-bearing ccl5−/− mice, MDSCs in naïve ccl5−/− exhibited the same atypical Ly6Chigh/Ly6Ghigh phenotype, but at a lower abundance. These observations suggest that the absence of autocrine CCL5, not 4T1 tumor-derived factors, caused the accumulation of the atypical Ly6Chigh/Ly6Ghigh population with a deficiency in the generation of the G-MDSC subset (Fig. 3B). Of note, Youn et al. suggested that a certain proportion of MMDSCs (Ly6Chigh/Ly6G−) acquired phenotypic and morphological features of G-MDSCs (Ly6Clow/−/Ly6Ghigh) upon epigenetic silencing of the retinoblastoma gene (Rb1) (26). We cultured M-MDSCs sorted from WT or ccl5−/− BM in vitro (27). Approximately 15% WT M-MDSCs gained the phenotype of G-MDSCs by down-regulating Ly6C and expressing Ly6G after 4 days in culture; this typical G-MDSC population was nearly not detectable in ccl5−/− M-MDSC culture. Instead, ∼35% ccl5−/− M-MDSCs became the atypical Ly6Chigh/Ly6Ghigh cells (Fig. 3C). We next examined the mRNA and protein levels of Rb1 in WT and ccl5−/− BM MDSCs from mice with or without tumor. A failure in epigenetic silencing of Rb1 in ccl5−/− MDSCs was revealed in response to tumor growth (Fig. 3D). These observations demonstrate that autocrine CCL5 is a key regulator of Rb1 activation and in the development of the G-MDSC subset. Detailed demonstrations of MDSCs' developmental alterations were included in Supplement (Supplementary Fig. S4).
Profound functional defects of the arrested Ly6Chigh/Ly6Ghigh cells
To confirm that the subtype-switching-arrested ccl5−/− MDSCs are functionally inactive, we analyzed differences between sorted Ly6Clow/−/Ly6Ghigh (WT) and Ly6Chigh/Ly6Ghigh (ccl5−/−) cells via Next Generation RNA-sequencing. The gene-expression profiling demonstrated that Ly6Clow/−/Ly6Ghigh BM MDSCs from WT bearing 4T1 tumor turned off expressions of genes related to red blood cell biosynthesis and survival, but up-regulated expression of proinflammatory [e.g. Saa3, Prok2, Ptges2 (COX-2), Lipg (endothelial lipase), CXCR1, VEGFα, IL-6Ra, CD14 and TLR1] and immunosuppressive (IL-4Rα, IL-13Ra1 and NOS2) molecules. In contrast, Ly6Chigh/Ly6Ghigh MDSCs from ccl5−/− BM failed to up-regulate these genes to a large extent in response to tumor growth, suggesting functional defects of ccl5−/− MDSCs (Fig. 4A). Some of the key findings from the sequencing profiles were corroborated by flow cytometry, RTqPCR and etc. (Fig. 4B, 4C and Supplementary Fig. S5). When compared to WT, significantly lower expression of ROS, NO, IL-10 and TGFβ by Ly6Chigh/Ly6Ghigh (ccl5−/−) were observed (Fig. 4D, 4E).
Figure 4.

Functional defects of Ly6Chigh/Ly6Ghigh MDSCs. (A-C) Sorted BM MDSCs (Gr-1+/CD11b+) described in (3D) were analyzed by Next Generation RNA-sequencing (A) and flow cytometry for expressions of intracellular NOS2 (B) and membrane-bound IL-4Rα (C). (D) Sorted BM MDSCs from naive WT and ccl5−/− mice were cultured in MDSC media. ROS/NO detection dyes were added to cultures and fluorescence was observed as instructed by product manual. (E) ELISA results of secreted TGFβ and IL-10 (24h) by WT MDSCs or ccl5−/− MDSCs. (F) Digested 4T1 tumors carried by WT or ccl5−/− mice were flow cytometrically analyzed for CD8+ T cell infiltration. (G) Splenocytes from 4T1 tumor (4 weeks)-bearing WT and ccl5−/− mice were analyzed for CD3+/CD4+ and CD3+/CD8+ T cells counts. Results represented 2-3 independent experiments with cells pooled from 3-5 mice/group; ELISA in triplets; mean ± SEM.
We further examined tumor-infiltrating CD8+ T cells and splenetic T cell counts (CD4+/CD3+ and CD8+/CD3+ cells) in WT vs ccl5−/− mice bearing 4T1 tumor (4 weeks), which could largely be affected by nitration of T cell-specific chemokines (28) and by TGFβ-suppressed T cell proliferation / NO-induced T cell apoptosis respectively (29-32). Indeed, ccl5−/− mice showed both enhanced tumor infiltration of CD8+ T cells and higher splenetic T cells counts when compared to WT peers (Fig. 4F, 4G).
Together, these observations confirm that the lack of autocrine CCL5 results in aberrant Ly6Chigh/Ly6Ghigh MDSCs with multi-tiered deficiency of immunosuppressive functions in BM.
Unaltered phenotypic and functional defects of ccl5−/− myeloid suppressor cells in tumor
To determine if exposure of ccl5−/− myeloid suppressor cells to tumor-derived CCL5 could “correct” their phenotypic features (Ly6Chigh/Ly6Ghigh) and functional defects, we analyzed the tumor-infiltrating Gr-1+ myeloid cells. The intratumoral Gr-1+/CD11b+ originated from ccl5−/− BM remained Ly6Chigh/Ly6Ghigh with unsilenced Rb1 expression (Fig. 5A, 5B). When compared with Ly6Clow/−/Ly6Ghigh cells, the predominant MDSC subset in tumor carried by WT, a consistently lower expression of NOS2 was observed in tumor-infiltrating Ly6Chigh/Ly6Ghigh cells (Fig. 5C). Furthermore, tumor-infiltrating Gr-1+/CD11b+ cells spawn from ccl5−/− BM showed significantly weakened ability to inhibit anti-CD3/CD28-induced T cell proliferation than the WT counterparts (Fig. 5D). Together, CCL5 in TME appeared incapable of compensating the deficiency of host CCL5 in BM.
Figure 5.

Unaltered phenotypic and functional defects of ccl5−/− MDSCs in tumor due to persistent absence of CCR5. (A) Flow cytometric analysis on Ly6C/Ly6G expression of MDSC populations in whole population of 4T1 tumors borne by WT or ccl5−/− mice. CCL5 in TME was confirmed by ELISA. (B) Immunoblotting of sorted MDSCs (CD11b+/Gr-1+) from 4T1 tumors (4w) carried by WT and ccl5−/− mice against Rb1 and GAPDH. (C) Immunoblotting of sorted BM-residing and 4T1 tumor-infiltrating MDSCs from WT or ccl5−/− mice against NOS2 and GAPDH (n: naïve; tu: tumor). (D) T cells proliferation in co-culture with tumor-infiltrating WT or ccl5−/− MDSCs. (E) Flow cytometric analysis of GzmB and PD-1 expression in CD8+ T cells infiltrating 4T1 tumors carried by WT or ccl5−/− mice. CD8+ T cells were sorted from 4-8 pooled 4T1 tumors / group via CD8 microbeads. (F) Flow cytometric analysis of CD4+ /FOXP3+ Tregs in inguinal lymph nodes draining 4T1 tumors carried by WT or ccl5−/− mice. (G) Gene expression profiling of CCL5 receptors (CCR1, CCR3 and CCR5) in sorted BM MDSCs as described in 3D. (H-J) Flow cytometric analysis on the expression of CCL5 receptors in sorted BM (H,I) and tumor-infiltrating (J) MDSCs as described previously. (K) Immunoblotting of sorted BM and intratumoral MDSCs against p-JAK3, p-IKBα and GAPDH. Data are representative of 2-3 independent experiments with cells pooled from 3-8 mice / group. mean ± SEM.
IMCs have all been demonstrated to induce “exhaustion” in effector T cells and expansion of regulatory T cells (Tregs) (1, 33, 34). To further demonstrate that ccl5−/− myeloid cells are able to activate productive T cell responses in CCL5-sufficient peripheries, we analyzed the expression of granzyme B (GzmB) and PD-1, markers for cytolytic activities and an inhibitory co-receptor of T cells respectively, by tumor-infiltrating CD8+ T cells. In WT, GzmB− cells made up most of tumor-infiltrating CD8+ T cells, of which ∼55% expressed PD-1. On the contrary, ∼95% tumor-infiltrating CD8+ T cells in ccl5−/− mice were PD-1−, of which ∼35% were also GzmB+ (Fig. 5E). Consistent with this observation, CD4+/Foxp3+ Tregs in the inguinal lymph nodes draining the 4T1 tumor were 37 times more abundant in WT than ccl5−/− (Fig. 5F).
We further explored the impacted signaling pathways downstream of CCL5 receptors (CCR1, CCR3, and CCR5) in Gr-1+ myeloid cells due to the absence of autocrine CCL5. The RNAseq profiling of CD11b+/Gr-1+ BM cells revealed different mRNA expression of CCR5, but not CCR1 and CCR3, between WT and ccl5−/− tumor-bearing mice (Fig. 5G). Flow cytometric analysis confirmed this expression pattern of CCL5 receptors (Fig. 5H, 5I). We further observed that the defective expression of CCR5 was conserved from BM-residing to tumor-infiltrating ccl5−/− Gr-1+ cells (Fig. 5J). The persistent lack of membrane-bound CCR5 on may explain why supplementing tumor-derived CCL5 in trans could rescue neither phenotypic nor functional defects of ccl5−/− Gr-1+ cells. To verify the deficiency of CCL5-CCR5 signaling in both BM and tumor-infiltrating Ly6Chigh/Ly6Ghigh cells, its down-stream targets such as JAK/STAT (35, 36) and NFκB (37, 38) were inspected by immunoblotting. Indeed, the elevated phosphorylation of JAK3 and degradation of phosphorylated IκBα were observed in sorted CD11b+/Gr-1+s from tumor-bearing WT mice, but not in the ccl5−/− counterparts (Fig. 5K). The dampened JAK/STAT and NFκB signaling transductions of ccl5−/− MDSCs, in turn, explain their loss of function phenotype, since these pathways are known to mediate the immune suppressive function of MDSCs (39).
Collectively, these findings indicate that 1) the autocrine CCL5 is required for the initial expression of CCR5 on developing Gr-1+ cells in BM; 2) the functional defects of Ly6Chigh/Ly6Ghigh myeloid cells are long-lasting due to the persistent lack of CCR5.
Therapeutic potential of targeting myeloid CCL5-CCR5 axis in breast cancer
Inspired by our findings in mouse models, we further investigated the autocrine CCL5-CCR5 axis in patients with TNBCs. As we showed previously, CCR5 expression on myeloid cells was dependent on the autocrine CCL5 in BM. Additionally, tumor-infiltrating immune cells have a typical morphology of small and compact basophilic nuclei, thus they can be reliably differentiated from cancer cells on H&E stained specimens (40). We, therefore, employed the CCR5 expression in the infiltrating immune cells, not cancer cells, as an index of myeloid CCL5 in TNBC patients.
Immunohistochemical analysis demonstrated that “immune CCR5” (Fig. 6A) inversely correlated with the maturation status of neutrophils in tumor (Fig. 6B, 6C), as well as 5-year survival rates of these patients (Fig. 6D and Supplementary Table S1).
Figure 6.
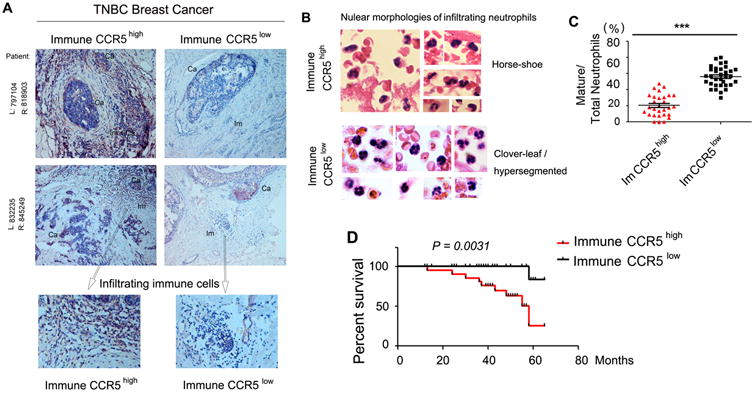
Inverse correlation between “immune CCR5” and progression of TNBCs in patients. (A) CCR5 immunochemistry in human TNBC specimens (CCR5: red to brown; nuclei: blue). Representative images of high (CCR5high, left, n=29) and low CCR5 expression (CCR5low, right, n=33) of infiltrating immune cells (Ca: cancer; Im: immune cells). (B) Representative H&E images of nuclear morphologies of intratumoral neutrophils from immune CCR5high (left) vs immune CCR5low (right) groups. (C-D) Percentages of mature neutrophils with hypersegmented nuclei (C) and Kaplan-Meier curve of 5-year-survival rates (D) of immune CCR5high vs CCR5low patients.
Based on the mouse and human data, we reasoned that targeting CCL5 in BM would have great therapeutic efficacy against breast cancer. Since CD11b+/Gr-1+s make up ∼85% of the BM cells in tumor-bearing mice, we designed BM-targeting nanoparticles (Fig. 7A), which comprised two main moieties: 1) the biodegradable mesoporous silicon nanoparticles (41) incorporated with liposomal CCL5 siRNA; 2) surface-conjugated affinity ligand (thioaptamer) for E-selectin expressed on BM endothelium (15). The efficiencies of BM-targeting and siRNA-releasing were verified experimentally before animal treatments (Fig. 7B).
Figure 7.

Reinvigorated anti-tumor immunity upon treatments targeting CCL5-CCR5 axis. (A) A representative SEM image of MSV nanoparticle. (B) Microscopic analysis of the release of fluorescent siRNA. Alexa555-CCL5-siRNA was released from ESTA-MSV in murine BM in a time dependent manner (Green: ESTA-MSV, Red: Alexa555-CCL5-siRNA, Blue: nuclei). (C) 4T1 tumor growth curve under the treatment of PBS (Mock), MSV nanoparticles loaded with scrambled siRNA (Control) and MSV nanoparticles loaded with CCL5-targeting siRNA (CCL5-targeting) (1st to 3rd treatment indicated by black arrows. The red arrow indicates the time point of analysis). (D-E) Total 4T1 tumor burden (g) (D) and spleen weights (g) (E) of 3 groups described in 7C. (F) Flow cytometric analysis of Ly6C/ Ly6G expression on BM-MDSCs and intratumoral MDSCs in mice treated with control or CCL5-targeting nanoparticles. BM cells were gated on Gr-1+. (G-H) TAMs positive for CD11C, MHCII and VCAM1 (G) and SSClow / CD8+ T cells (H) in 4T1 tumors carried by mice treated with mock, control or CCL5-targeting nanoparticles were counted via flow cytometer. (I) Flow cytometric analysis of GzmB and PD-1 expression by tumor-infiltrating CD8+ T cells sorted via CD8 microbeads. (J-L) Synergistic effects of CCL5-targeting nanoparticles and Maraviroc. Control group were treated with control nanoparticles (i.v) and DMSO (i.p.); the rest 2 groups were respectively treated with Maraviroc only (8mg/kg, i.p.) and Maraviroc combined with CCL5-targeting nanoparticles (i.v.).Tumor weights (J), growth curves (K) and counts of TAMs, tumor-infiltrating CD8+ T cells and GzmB+ / PD-1− / CD8 + T cells (L) in 3 groups were shown as indicated. Data are representative of 2-4 independent experiments (n=4 to 8 / group).
CCL5-siRNA-loaded MSV nanoparticles were delivered to 4T1 and PyMT tumor-bearing mice via tail vein injection once a week. This regimen was chosen due to the sustained release of siRNA liposomes from MSV (42). Compared to PBS (mock) and control nanoparticle-treated mice, significantly reduced 4T1 tumor growth in mice receiving CCL5-targeting nanoparticles was observed after the second treatment (Fig. 7C). After three nanoparticle treatments, reductions of tumor burden (4T1: ∼65%; PyMT: ∼30-40%) were evident (Fig. 7D, Supplementary Fig. S6A). Consistently, the enlargement of spleen, a sign for extramedullary hematopoiesis in which G-MDSCs significantly increase, reduced dramatically in 4T1-bearing mice receiving nano-treatment (Fig. 7E). The efficacy of nanoparticle-treatment was further corroborated by examining the mRNA levels of CCL5, CCR5 and NOS2 of BM-MDSCs (Supplementary Fig. S6B). CCL5-targeting nano-treatment in BM considerably reprogramed immunosuppressive myeloid cells, as evidenced by arrested M- to G- subset switching (Fig. 7F), decreased NOS2 expression of MDSCs, and crippled TAM development (Fig. 7G). The reprogrammed IMCs further led to reinvigorated anti-tumor immunities, exemplified by enhanced CD8+ T cell infiltration (Fig. 7H) and ∼9 fold increase of GzmB+/PD-1− /CD8+ T cells in tumor (Fig. 7I). We further proposed that the residual tumor growth is the consequence of incomplete inhibition of CCL5 in BM, and the blockade of CCR5 by Maraviroc in periphery could synergistically improve the therapeutic efficacy. As expected, combination of CCL5 nanoparticles and Maraviroc led to vigorous reductions of 4T1 tumors (Fig. 7J and 7K). 2 out of 8 mice rejected tumors at day 16 and day 20 upon the synergistic treatments. Unsurprisingly, further enhanced anti-tumor immunities were observed (Fig. 7L).
Discussion
IMCs include mainly a granulocyte lineage (G-MDSCs or TANs) and a monocyte lineage (TADCs and TAMs). During tumorigenesis, Ly6C+ myeloid cells further differentiate into both granulocyte-like-MDSCs / TANs (26, 43, 44) and monocyte-derived TAMs (6). In our study, the absence of autocrine CCL5 in evolving myeloid suppressors in BM causes defective expression of CCR5. In TME, the persistent lack of membrane CCR5 allows the CCL5-deficient myeloid cells to largely neglect tumor-derived CCL5, thereby gaining the ability to advance toward more mature neutrophils and macrophages, not the otherwise immature myeloid suppressor cells. Genetic ablation of ccl5 gene or nanoparticle-mediated silencing of host CCL5 in BM gives rise to not only the incomplete G-MDSC development, but also the suspended differentiation to CD11c+ TAMs (Cartoon illustrations in Supplementary Fig. S7). The concomitantly enhanced maturation of “pan-myeloids” in tumor, as well as the subsequent productive T cell responses point to an important role of the autocrine CCL5-CCR5 axis in myeloid-originated suppression. However, the molecular mechanism by which CCL5 regulates CCR5 expression in MDSCs needs further investigations.
Our findings also highlight the importance of MDSC subtype-switching. Despite their low proliferation rates and relatively weak immunosuppressive activities on a per cell basis in comparison to M-MDSCs, G-MDSCs are the predominant form of MDSCs in animal tumor models and cancer patients (26, 45). The advantage underlying the transition from potent MMDSCs to the less powerful and short-lived G-MDSCs as tumor progresses is not clear. Our whole exon RNA sequencing of 4T1 tumor-infiltrating Ly6G+ vs. Ly6C+ MDSCs revealed that certain key immunosuppressive molecules such as S100A8/A9, NOS2 and PD-L1 were upregulated in Ly6G+ G-MDSCs, but not in Ly6C+ M-MDSCs (Supplementary Fig. S8). Consistent with their immune-activating phenotypes, ccl5−/− intratumoral MDSCs showed not only the reduced expression of S100A8/A9 and NOS2, but also the upregulation of immunostimulatory CD86 on Ly6G+ MDSCs (Supplementary Fig. S8).
We propose that immunosuppressive functions are likely derived from G-MDSCs, as evidenced by the direct demonstration of tumor-promoting neutrophils (1) and increased anti-tumor effect upon depletion of Ly6G+ cells, but not Ly6C+ cells (46-48). This notion also explains, at least in part, that the arrested Ly6Chigh/Ly6Ghigh MDSCs, which failed to develop into the typical G-MDSCs, have lost most of immunosuppressive activities. The observation that MMDSCs are more immunosuppressive than G-MDSCs on a per cell basis could be the combined consequences of a higher proliferative capacity of M-MDSCs and the transition from M- to G-MDSCs, especially the Rb1low population (26). However, more research is needed to confirm the differential roles of MDSC subsets. Another limitation derives from the techniques (Percoll gradient centrifugation) employed to isolate MDSCs. The immunosuppressive cells with low densities may consist of other types of immune cells, which could be an independent project for the further studies.
Mounting evidence has put IMCs firmly on the map as a negative regulator of anti-tumor immunity. Various strategies are therefore sought to eliminate myeloid-originated immunosuppression. However, targeting a limited number of molecules of IMCs may not be effective, since multiple suppressive mechanisms with varying prevalence have been proposed to be operated by tumor at different stages. Our studies demonstrated that an autocrine CCL5-CCR5 axis is poised at the apex of the cascade directing BM precursors toward IMCs of granulocyte- and monocyte-lineages during tumorigenesis. Our analysis of TNBC patients further suggests that BM CCL5-CCR5 axis represent an excellent target in cancer immunotherapies.
Supplementary Material
Acknowledgments
We thank Dr. Aihao Ding (Weill Cornell Medicine) and Dr. Ming Li (Memorial Sloan Kettering Cancer Center) for insightful discussions on TAM differentiation. Celecoxib was a generous gift from Dr. Andrew Dannenberg (Weill Cornell Medicine).
Grant Support: This work was supported by New York State Department of Public Health grant C028251 to X. Ma, Qatar National Research Foundation grant NPRP 7-136-3-031 to L. Chouchane and X. Ma, and NIH training grant T32 5T32AI007621-15 to Y. Ban, the Ernest Cockrell Jr. Distinguished Endowed Chair to M. Ferrari, and the NIH grants U54 CA210181 to M. Ferrari, and 1R01CA193880-01A1 to H. Shen.
Footnotes
Conflicts of Interests: the authors declare no conflicts of interests.
References
- 1.Fridlender ZG, et al. Polarization of tumor-associated neutrophil phenotype by TGF-beta: “N1” versus “N2” TAN. Cancer Cell. 2009;16:183–194. doi: 10.1016/j.ccr.2009.06.017. [DOI] [PMC free article] [PubMed] [Google Scholar]
- 2.Noy R, Pollard JW. Tumor-associated macrophages: from mechanisms to therapy. Immunity. 2014;41:49–61. doi: 10.1016/j.immuni.2014.06.010. [DOI] [PMC free article] [PubMed] [Google Scholar]
- 3.Parker KH, Beury DW, Ostrand-Rosenberg S. Myeloid-Derived Suppressor Cells: Critical Cells Driving Immune Suppression in the Tumor Microenvironment. Adv Cancer Res. 2015;128:95–139. doi: 10.1016/bs.acr.2015.04.002. [DOI] [PMC free article] [PubMed] [Google Scholar]
- 4.Engelhardt JJ, et al. Marginating dendritic cells of the tumor microenvironment cross-present tumor antigens and stably engage tumor-specific T cells. Cancer Cell. 2012;21:402–417. doi: 10.1016/j.ccr.2012.01.008. [DOI] [PMC free article] [PubMed] [Google Scholar]
- 5.Gabrilovich DI, Nagaraj S. Myeloid-derived suppressor cells as regulators of the immune system. Nat Rev Immunol. 2009;9:162–174. doi: 10.1038/nri2506. [DOI] [PMC free article] [PubMed] [Google Scholar]
- 6.Wynn TA. Myeloid-cell differentiation redefined in cancer. Nat Immunol. 2013;14:197–199. doi: 10.1038/ni.2539. [DOI] [PMC free article] [PubMed] [Google Scholar]
- 7.Franklin RA, et al. The cellular and molecular origin of tumor-associated macrophages. Science. 2014;344:921–925. doi: 10.1126/science.1252510. [DOI] [PMC free article] [PubMed] [Google Scholar]
- 8.Capece D, Verzella D, Fischietti M, Zazzeroni F, Alesse E. Targeting costimulatory molecules to improve antitumor immunity. J Biomed Biotechnol. 2012;2012:926321. doi: 10.1155/2012/926321. [DOI] [PMC free article] [PubMed] [Google Scholar]
- 9.Soria G, et al. Concomitant expression of the chemokines RANTES and MCP-1 in human breast cancer: a basis for tumor-promoting interactions. Cytokine. 2008;44:191–200. doi: 10.1016/j.cyto.2008.08.002. [DOI] [PubMed] [Google Scholar]
- 10.Velasco-Velazquez M, Xolalpa W, Pestell RG. The potential to target CCL5/CCR5 in breast cancer. Expert Opin Ther Targets. 2014;18:1265–1275. doi: 10.1517/14728222.2014.949238. [DOI] [PubMed] [Google Scholar]
- 11.Zhang Y, et al. A novel role of hematopoietic CCL5 in promoting triple-negative mammary tumor progression by regulating generation of myeloid-derived suppressor cells. Cell research. 2013;23:394–408. doi: 10.1038/cr.2012.178. [DOI] [PMC free article] [PubMed] [Google Scholar]
- 12.Andreu P, et al. FcRgamma activation regulates inflammation-associated squamous carcinogenesis. Cancer Cell. 2010;17:121–134. doi: 10.1016/j.ccr.2009.12.019. [DOI] [PMC free article] [PubMed] [Google Scholar]
- 13.Guy CT, Cardiff RD, Muller WJ. Induction of mammary tumors by expression of polyomavirus middle T oncogene: a transgenic mouse model for metastatic disease. Mol Cell Biol. 1992;12:954–961. doi: 10.1128/mcb.12.3.954. [DOI] [PMC free article] [PubMed] [Google Scholar]
- 14.Pulaski BA, Ostrand-Rosenberg S. Mouse 4T1 breast tumor model. Curr Protoc Immunol. 2001;Chapter 20 doi: 10.1002/0471142735.im2002s39. Unit 20 22. [DOI] [PubMed] [Google Scholar]
- 15.Mai J, et al. Bone marrow endothelium-targeted therapeutics for metastatic breast cancer. J Control Release. 2014;187:22–29. doi: 10.1016/j.jconrel.2014.04.057. [DOI] [PMC free article] [PubMed] [Google Scholar]
- 16.Kurt RA, Baher A, Wisner KP, Tackitt S, Urba WJ. Chemokine receptor desensitization in tumor-bearing mice. Cell Immunol. 2001;207:81–88. doi: 10.1006/cimm.2000.1754. [DOI] [PubMed] [Google Scholar]
- 17.Pillay J, Tak T, Kamp VM, Koenderman L. Immune suppression by neutrophils and granulocytic myeloid-derived suppressor cells: similarities and differences. Cell Mol Life Sci. 2013;70:3813–3827. doi: 10.1007/s00018-013-1286-4. [DOI] [PMC free article] [PubMed] [Google Scholar]
- 18.Gabrilovich DI, et al. The terminology issue for myeloid-derived suppressor cells. Cancer Res. 2007;67:425. doi: 10.1158/0008-5472.CAN-06-3037. author reply 426. [DOI] [PMC free article] [PubMed] [Google Scholar]
- 19.Youn JI, Collazo M, Shalova IN, Biswas SK, Gabrilovich DI. Characterization of the nature of granulocytic myeloid-derived suppressor cells in tumor-bearing mice. J Leukoc Biol. 2012;91:167–181. doi: 10.1189/jlb.0311177. [DOI] [PMC free article] [PubMed] [Google Scholar]
- 20.Ko HJ, et al. Immunosuppressive myeloid-derived suppressor cells can be converted into immunogenic APCs with the help of activated NKT cells: an alternative cell-based antitumor vaccine. J Immunol. 2009;182:1818–1828. doi: 10.4049/jimmunol.0802430. [DOI] [PubMed] [Google Scholar]
- 21.Liechtenstein T, et al. A highly efficient tumor-infiltrating MDSC differentiation system for discovery of anti-neoplastic targets, which circumvents the need for tumor establishment in mice. Oncotarget. 2014;5:7843–7857. doi: 10.18632/oncotarget.2279. [DOI] [PMC free article] [PubMed] [Google Scholar]
- 22.Yang R, et al. CD80 in immune suppression by mouse ovarian carcinoma-associated Gr-1+CD11b+ myeloid cells. Cancer Res. 2006;66:6807–6815. doi: 10.1158/0008-5472.CAN-05-3755. [DOI] [PubMed] [Google Scholar]
- 23.Abi Abdallah DS, Egan CE, Butcher BA, Denkers EY. Mouse neutrophils are professional antigen-presenting cells programmed to instruct Th1 and Th17 T-cell differentiation. Int Immunol. 2011;23:317–326. doi: 10.1093/intimm/dxr007. [DOI] [PMC free article] [PubMed] [Google Scholar]
- 24.Klappacher GW, et al. An induced Ets repressor complex regulates growth arrest during terminal macrophage differentiation. Cell. 2002;109:169–180. doi: 10.1016/s0092-8674(02)00714-6. [DOI] [PubMed] [Google Scholar]
- 25.Geissmann F, Jung S, Littman DR. Blood monocytes consist of two principal subsets with distinct migratory properties. Immunity. 2003;19:71–82. doi: 10.1016/s1074-7613(03)00174-2. [DOI] [PubMed] [Google Scholar]
- 26.Youn JI, et al. Epigenetic silencing of retinoblastoma gene regulates pathologic differentiation of myeloid cells in cancer. Nat Immunol. 2013;14:211–220. doi: 10.1038/ni.2526. [DOI] [PMC free article] [PubMed] [Google Scholar]
- 27.Marigo I, et al. Tumor-induced tolerance and immune suppression depend on the C/EBPbeta transcription factor. Immunity. 2010;32:790–802. doi: 10.1016/j.immuni.2010.05.010. [DOI] [PubMed] [Google Scholar]
- 28.Molon B, et al. Chemokine nitration prevents intratumoral infiltration of antigen-specific T cells. J Exp Med. 2011;208:1949–1962. doi: 10.1084/jem.20101956. [DOI] [PMC free article] [PubMed] [Google Scholar]
- 29.Mazzoni A, et al. Myeloid suppressor lines inhibit T cell responses by an NO-dependent mechanism. J Immunol. 2002;168:689–695. doi: 10.4049/jimmunol.168.2.689. [DOI] [PubMed] [Google Scholar]
- 30.Rivoltini L, et al. Immunity to cancer: attack and escape in T lymphocyte-tumor cell interaction. Immunol Rev. 2002;188:97–113. doi: 10.1034/j.1600-065x.2002.18809.x. [DOI] [PubMed] [Google Scholar]
- 31.Saio M, Radoja S, Marino M, Frey AB. Tumor-infiltrating macrophages induce apoptosis in activated CD8(+) T cells by a mechanism requiring cell contact and mediated by both the cell-associated form of TNF and nitric oxide. J Immunol. 2001;167:5583–5593. doi: 10.4049/jimmunol.167.10.5583. [DOI] [PubMed] [Google Scholar]
- 32.Delisle JS, et al. The TGF-beta-Smad3 pathway inhibits CD28-dependent cell growth and proliferation of CD4 T cells. Genes Immun. 2013;14:115–126. doi: 10.1038/gene.2012.63. [DOI] [PubMed] [Google Scholar]
- 33.Gabrilovich DI, Ostrand-Rosenberg S, Bronte V. Coordinated regulation of myeloid cells by tumours. Nat Rev Immunol. 2012;12:253–268. doi: 10.1038/nri3175. [DOI] [PMC free article] [PubMed] [Google Scholar]
- 34.Jiang Y, Li Y, Zhu B. T-cell exhaustion in the tumor microenvironment. Cell Death Dis. 2015;6:e1792. doi: 10.1038/cddis.2015.162. [DOI] [PMC free article] [PubMed] [Google Scholar]
- 35.Wong M, et al. Rantes activates Jak2 and Jak3 to regulate engagement of multiple signaling pathways in T cells. J Biol Chem. 2001;276:11427–11431. doi: 10.1074/jbc.M010750200. [DOI] [PubMed] [Google Scholar]
- 36.Wong MM, Fish EN. Chemokines: attractive mediators of the immune response. Semin Immunol. 2003;15:5–14. doi: 10.1016/s1044-5323(02)00123-9. [DOI] [PubMed] [Google Scholar]
- 37.Huang CY, et al. CCL5 increases lung cancer migration via PI3K, Akt and NF-kappaB pathways. Biochem Pharmacol. 2009;77:794–803. doi: 10.1016/j.bcp.2008.11.014. [DOI] [PubMed] [Google Scholar]
- 38.Wang SW, et al. CCL5 and CCR5 interaction promotes cell motility in human osteosarcoma. PLoS One. 2012;7:e35101. doi: 10.1371/journal.pone.0035101. [DOI] [PMC free article] [PubMed] [Google Scholar]
- 39.Trikha P, Carson WE., 3rd Signaling pathways involved in MDSC regulation. Biochim Biophys Acta. 2014;1846:55–65. doi: 10.1016/j.bbcan.2014.04.003. [DOI] [PMC free article] [PubMed] [Google Scholar]
- 40.Nawaz S, Heindl A, Koelble K, Yuan Y. Beyond immune density: critical role of spatial heterogeneity in estrogen receptor-negative breast cancer. Mod Pathol. 2015;28:1621. doi: 10.1038/modpathol.2015.133. [DOI] [PubMed] [Google Scholar]
- 41.Tasciotti E, et al. Mesoporous silicon particles as a multistage delivery system for imaging and therapeutic applications. Nat Nanotechnol. 2008;3:151–157. doi: 10.1038/nnano.2008.34. [DOI] [PubMed] [Google Scholar]
- 42.Landen CN, Jr, et al. Therapeutic EphA2 gene targeting in vivo using neutral liposomal small interfering RNA delivery. Cancer Res. 2005;65:6910–6918. doi: 10.1158/0008-5472.CAN-05-0530. [DOI] [PubMed] [Google Scholar]
- 43.Narita Y, Wakita D, Ohkur T, Chamoto K, Nishimura T. Potential differentiation of tumor bearing mouse CD11b+Gr-1+ immature myeloid cells into both suppressor macrophages and immunostimulatory dendritic cells. Biomed Res. 2009;30:7–15. doi: 10.2220/biomedres.30.7. [DOI] [PubMed] [Google Scholar]
- 44.Yang L, et al. Expansion of myeloid immune suppressor Gr+CD11b+ cells in tumor-bearing host directly promotes tumor angiogenesis. Cancer Cell. 2004;6:409–421. doi: 10.1016/j.ccr.2004.08.031. [DOI] [PubMed] [Google Scholar]
- 45.Marvel D, Gabrilovich DI. Myeloid-derived suppressor cells in the tumor microenvironment: expect the unexpected. J Clin Invest. 2015;125:3356–3364. doi: 10.1172/JCI80005. [DOI] [PMC free article] [PubMed] [Google Scholar]
- 46.Fischer MA, et al. CD11b(+), Ly6G(+) cells produce type I interferon and exhibit tissue protective properties following peripheral virus infection. PLoS Pathog. 2011;7:e1002374. doi: 10.1371/journal.ppat.1002374. [DOI] [PMC free article] [PubMed] [Google Scholar]
- 47.Srivastava MK, et al. Myeloid suppressor cell depletion augments antitumor activity in lung cancer. PLoS One. 2012;7:e40677. doi: 10.1371/journal.pone.0040677. [DOI] [PMC free article] [PubMed] [Google Scholar]
- 48.Tsukamoto H, Nishikata R, Senju S, Nishimura Y. Myeloid-derived suppressor cells attenuate TH1 development through IL-6 production to promote tumor progression. Cancer Immunol Res. 2013;1:64–76. doi: 10.1158/2326-6066.CIR-13-0030. [DOI] [PubMed] [Google Scholar]
Associated Data
This section collects any data citations, data availability statements, or supplementary materials included in this article.