Abstract
In glaucoma, the output neurons of the retina, the retinal ganglion cells (RGCs), progressively degenerate, leading to irreversible blindness ( Ahram et al., 2015 ). The ex vivo stem cell method to replace degenerated RGCs remains a potentially viable approach ( Levin et al., 2004 ). However, the success of the approach depends upon the ability of the de novo generated RGCs to connect over the long distance with specific targets in the central visual pathway. Here, we describe a protocol to examine the target specificity of the de novo generated RGCs using a co-culture approach where the RGCs neurites are allowed to choose between specific (superior colliculus; SC) and non-specific (inferior colliculus; IC) tectal targets.
Keywords: Glaucoma, Human induced pluripotent stem cells, Retinal ganglion cells, Superior colliculus, Target specificity
Background
Glaucoma is one of the most prevalent causes of irreversible blindness worldwide ( Tham et al., 2014 ). It is characterized by a progressive degeneration of RGCs, the main output neurons of the retina, which connects with the brain for visual perception. Unfortunately, there is no treatment currently available to address RGCs degeneration. The management approaches, whether surgical, pharmacological or neuro-protective do not reverse the degenerative changes (Danesh-Meyer, 2011). Given this intractable situation, stem cell therapy has emerged as a potentially viable approach to replace dead RGCs. The success of this approach requires, 1) directed differentiation of functional and non-tumorigenic RGCs from pluripotent stem cells and 2) target specificity of the de novo generated RGCs. Our lab has recently demonstrated a chemically defined method that allows directed differentiation of RGCs from embryonic stem (ES)/induced pluripotent stem (iPS) cells by recapitulating developmental mechanism ( Teotia et al., 2016 ). The resulting RGCs are stable, functional, and non-tumorigenic. However, the success of the de novo generated cells in the ex vivo stem cell approach to glaucomatous RGC degeneration depends upon their axons ability to find proper targets in the central visual pathways. When transplanted, axons of RGCs must navigate within the retina to exit as optic nerve, decide to cross or not to cross at the optic chiasm, and reach specific targets for establishing retinotopic connections. We have demonstrated that ES/iPS cell-derived RGCs possess target specificity. Here, we describe in detail a co-culture experimental paradigm to test the target specificity of the de novo generated RGCs.
Materials and Reagents
100-mm Petri dishes (SARSTEDT, catalog number: 83.1802)
Kimtech science Kim-wipes (KCWW, Kimberly-Clark, catalog number: 34120)
Double-edge stainless steel razor blades (Personna, catalog number: MPPB-100)
Whatman filter paper, round (Sigma-Aldrich, catalog number: WHA10539028)
-
Plastic pipette tips
200 μl tips (Fisher Scientific, FisherbrandTM, catalog number: 02-707-452)
1 ml tips (Molecular Bio products, catalog number: 3580)
Tape
12 mm round coverslips (Fisher Scientific, FisherbrandTM, catalog number: 12-545-80)
Tissue culture plates, 24-well (Corning, Falcon®, catalog number: 353047)
12-well plate
27 G1/4 gauge needles (BD, catalog number: 305136)
Sprague-Dawley rats at postnatal day 1/3 (Charles river laboratories)
Ice and ice bucket
Hank’s balanced salt solution (HBSS), Ca2+/Mg2+ free (Mediatech, catalog number: 21-021-CV)
70% ethanol (Sigma-Aldrich, catalog number: 459844)
4% to 7% low melting point agarose (45 to 50 °C) (Thermo Fisher Scientific, InvitrogenTM, catalog number: 16520-100)
Poly D-lysine (Sigma-Aldrich, catalog number: P7886)
Ultrapure Laminin, mouse (Corning, catalog number: 354239)
DMEM/F12 media (Thermo Fisher Scientific, GibcoTM, catalog number: 11320033)
CFDA SE (carboxyfluorescein diacetate succinimidyl ester) (Thermo Fisher Scientific, Molecular ProbesTM, catalog number: V12883)
Vacuum grease
Ames’ Medium (Sigma-Aldrich, catalog number: A1420)
Toxin tetrodotoxin (TTX) (Tocris Bioscience, catalog number: 1078)
Lucifer yellow CH dipotassium salt (2 mg/ml) (Sigma-Aldrich, catalog number: L0144)
Alexa Fluor 568 Hydrazide (Thermo Fisher Scientific, Molecular ProbesTM, catalog number: A10437)
Sodium chloride (NaCl)
Potassium chloride (KCl)
Sodium phosphate dibasic (Na2HPO4)
Potassium dihydrogen phosphate (KH2PO4)
KCH3SO4
Magnesium chloride (MgCl2)
Calcium chloride (CaCl2)
HEPES
Glucose
EGTA
MgATP
Na2GTP
hiPSC-RGCs specific media as described previously ( Teotia et al., 2016 )
Phosphate buffer saline (PBS), Ca2+/Mg2+ free (see Recipes)
Intracellular solution (see Recipes)
Equipment
Stereo zoom microscope (Leica Microsystems, model: MZ6)
Stoelting tissue slicer/chopper (Stoelting)
Sterile biosafety hood (Thermo Fisher Scientific, Forma Scientific, model: Class IIA/B3 Biological safety cabinet)
Dissection hood (Thermo Fisher Scientific, Forma Scientific, Horizontal laminar flow hood)
Micro-dissecting scissors (Roboz, catalog number: RS-5611)
Tissue forceps (Teeth less) (Harvard apparatus, catalog number: 72-6685)
Bone rongeur (Roboz, catalog number: RS-8340)
Beakers (100 ml) (Corning, PYTEX®, catalog number: 1000-100)
Metal spatula
Vernier micrometer
Water bath set at 37 °C (Thermo Fisher Scientific, Fisher Scientific)
Fine and soft paintbrushes (Colour Shaper, catalog number: 11901)
-80 °C freezer
Tissue culture hood
Tissue culture incubator set at 37 °C, 5% CO2 (Sanyo)
Standard fluorescein isothiocyanate (FITC) filter sets
Cell scraper
Centrifuge (IEC, model: Centra GP8R)
Fluorescent microscope (Olympus, model: 1X70)
Recording chamber
Micromanipulator
Patch pipettes with tips of ~1 micron, fabricated out of thin-walled borosilicate glass capillaries (World Precision Instruments, catalog number: TW120F-4) using a pipette puller (i.e., NARISHIGE, model: PC-10 or Sutter Instrument, model: P-97) and with resistances of 5-10 MΩ
Patch clamp amplifier (Axon Multiclamp, Molecular Devices)
Autoclave
Software
Axiovision 4.8 software
ImageJ (NIH)
GraphPad Prism (Graphpad, La Jolla CA)
Windows Excel (Microsoft, Redmond, USA)
Procedure
-
Dissection of Superior (SC)/Inferior Colliculus (IC) from PN1/3 rat brain
Ethical statement: Experimental protocols and the use of animals were approved by the Institutional Animal Care and Use Committee, at the University of Nebraska Medical Center (UNMC) and conducted in accordance with the Association for Research in Vision and Ophthalmology (ARVO) Statement for the Use of Animals in Ophthalmic and Vision Research.
Sprague-Dawley rats of both sexes at postnatal day 1/3 are sacrificed by decapitation.
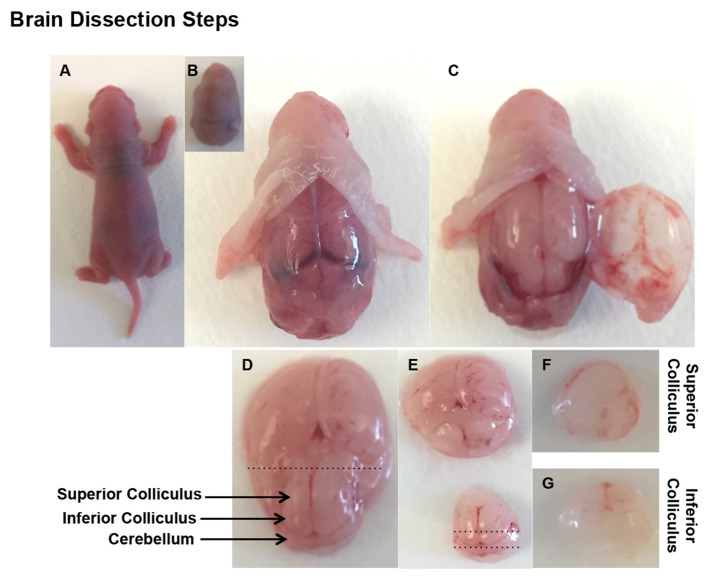
The brains are removed and transferred to 100-mm Petri dish containing HBSS solution and placed on ice (Figures 1A-1C).
Dissections of SC/IC are done under a stereomicroscope.
The tectum was exposed by carefully removing the overlying cortex. A pair of rostral and caudal bumps, superior and inferior colliculi, respectfully, can be observed. Anterior and posterior incisions are made to the rostral bumps to collect SC. Similarly another incision posterior to the caudal bump reveals IC (Figures 1D-1E).
Both sides of SC/IC are carefully separated from each other and kept in ice cold HBSS for further processing (Figures 1F-1G).
-
Preparation of slices from SC/IC tissues
Stoelting tissue slicer is used to slice SC/IC tissues. Section as thin as 100 μm is readily prepared.
Clean the Stoelting tissue slicer with 70% ethanol, wipe completely with Kim-wipe and place inside the sterile dissection hood.
Wipe a new razor blade with Kim-wipe moistened in 70% ethanol and mount on blade holder located on the right side of slicer arm by unscrewing two nuts from the left side of slicer arm to release the blade holder.
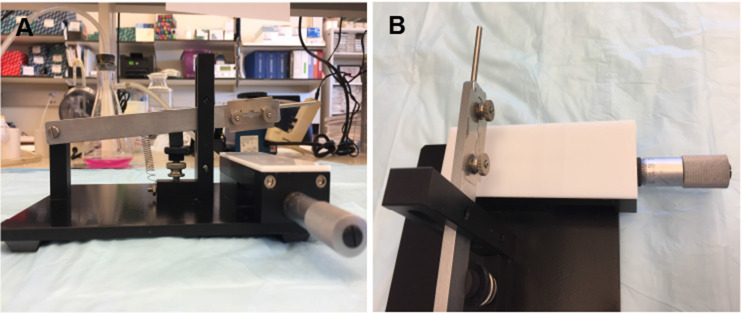
Mount the razor with cleaned side of the blade facing towards the side of vernier micrometer (Figures 2A and 2B).
Move the sample stage (base pad) to the left or to right by turning the vernier micrometer clockwise or anticlockwise to ensure proper functioning of the instrument.
Cut the filter paper into 2.5 x 8 cm and moisten with HBSS.
Transfer the tissue to wet area of filter paper.
Meanwhile, prepare freshly made 4% low melting point agarose.
Weigh 4 mg of agarose in glass beaker and add 100 ml of HBSS. Microwave the beaker for 3-4 min until agarose is completely melted and starts to boil.
Keep the melted agarose in a water bath set at 50 °C to avoid solidification. Keep agarose well mixed throughout the procedure by shaking the beaker intermittently.
Add the melted agarose drop by drop over the tissue with the help of plastic pipette tip, completely covering the SC/IC tissues until a mound of agarose is formed. Remove air bubble, if any (Figure 3).
Place the agarose-covered tissue on ice for 5-10 min to allow the agarose to solidify.
Once agarose solidifies completely, place the filter paper on sample stage and secure the paper with tape (Figure 4A).
Position the tissue for its first cut by moving the sample stage either to the left or to right.
Set the slice thickness to 100 µm (range: 100-300 µm).
Bring the slicer arm down, release slowly and let it fall by gravity.
Lift the slicer arm gently once first slice is done, turn the vernier counter clockwise forward by 100 µm and then subsequently cut another slice (Figure 4B).
When the whole tissue is sliced, lift the slicer arm and gently remove the slices off the surface with the help of wet soft paintbrush.
Transfer the slices in to culture Petri dish containing HBSS.
Transfer the slices using plastic pipette tip, the end broadened by a cut, with cut end to PDL and Laminin coated glass coverslips.
-
Poly-D-lysine (PDL) and laminin coating and plating of SC/IC tissue slices
Note: Poly-D-lysine and laminin are stored in a -80 °C freezer as 100 µl aliquots as stock solution of 10 mg/ml and 1 mg/ml, respectively.
SC/IC slices on to PDL and Laminin coated sterile glass coverslips are transferred to 24-well culture plates.
Briefly, one day prior to SC/IC tissue slices, coverslips/culture plates are coated with PDL and laminin.
Prepare working PDL solution (0.25 mg/ml) in sterile water. Add enough solution to cover surface of sterile glass coverslips.
Incubate overnight at room temperature in a tissue culture hood.
Next day, aspirate PDL solution and wash coverslips with sterile water twice at room temperature and allow to dry at room temperature.
Prepare laminin solution (5 µg/ml) in sterile DMEM/F12 media. Coverslips are then coated with 250-300 µl of laminin/per coverslip/well.
Incubate for 2 h at room temperature.
-
Aspirate to remove laminin and wash coverslips with DMEM/F12 media twice at room
temperature.
Carefully plate SC/IC slices on the coated glass coverslips as described above. Do not allow coating to dry.
Add 50 µl media drop on tissue slices in order to prevent drying and facilitate proper attachment. Incubate at 37 °C/5% CO2 overnight.
Next day, gently add 300 µl of hiPSC-RGCs media per coverslip/well as described previously ( Teotia et al., 2016 ).
-
Carboxyfluorescein diacetate, succinimidyl ester (CFDA SE) labeling of hiPSC-RGCs
hiPSC-RGCs are labeled with CFDA cell tracing agent for in vitro tracing of neurite outgrowth. CFDA SE passively diffuses into cells. The well-retained fluorescent conjugates are formed when the succinimidyl ester group reacts with intracellular amines. Preparations of the dye and labeling of cells should be protected from light.
Prepare CFDA solution (5 μM) immediately prior to use by diluting in PBS.
Grow hiPSC-RGCs in a 12-well plate, remove the media from the plate and add CFDA solution to hiPSC-RGCs in a 12-well culture plate.
Incubate cells at 37 °C/5% CO2 for 15 min.
Replace the diluted CFDA solution with fresh medium and incubate cells for another 30 min at 37 °C/5% CO2.
CFDA labeled cells are visualized by fluorescence microscopy using standard fluorescein isothiocyanate (FITC) filter sets. Cells are now ready to use for co-culture experiment. CFDA labeled cells can be cultured for 1-2 weeks post staining.
-
Co-culture of hiPSC-RGCs with SC/IC tissue slices in vitro
Setting up the co-culture of hiPSC-RGCs in the same plate as described in Procedure C.
Remove the PDL and laminin coated plate containing SC/IC tissue slices as described in Procedure C from 37 °C/5% CO2 incubator, aspirate the medium and keep in tissue culture hood.
Meanwhile, detach hiPSC-RGCs from 12-well plate using cell scraper.
Centrifuge the cells at 220 × g for 5 min to obtain cell pellet and aspirate the supernatant.
Resuspend the cells in 1 ml of fresh medium, gently mix and add 50 μl of media containing hiPSC-RGCs (~3-6/coverslip) away from the SC/IC slices on the above PDL and laminin coated coverslips.
Return the plate to the incubator and incubate at 37 °C/5% CO2 overnight. Allow the cells to adhere, next day, add 300 µl hiPSC-RGCs medium.
Change the medium every 2-4 days. hiPSC-RGCs can be co-cultured with SC/IC slices up to 8 days in vitro.
Once neurite outgrowth reaches considerable length, mount the coverslips on glass slides and image under the fluorescent microscope (Figure 5).
Compare the length and complexity of neurite outgrowth of hiPSC-RGCs extending towards both SC and IC slices. hiPSC-RGCs can be discriminated from clear-cut boundaries of SC/IC slices by CFDA staining of cell soma.
-
Electrophysiology of hiPSC-RGCs co-cultured with SC tissue slices
Whole-cell patch clamp electrophysiology allows for recording membrane voltage changes such as action potentials and excitatory and inhibitory synaptic potentials from hiPSC-RGCs co-cultured with SC tissue slices as well as the ionic currents that give rise to those voltage changes. The former is accomplished using the current clamp-recording mode while the latter is accomplished in voltage clamp recordings (Molleman, 2003; Marty and Neher, 2009; Teotia et al., 2016 ).
Mount a coverslip containing hiPSC-RGCs co-cultured with SC slice on a recording chamber using several dots of vacuum grease.
Position the recording chamber on the stage of an upright, fixed-stage microscope equipped with electrophysiology hardware and superfuse at ~1-4 ml/min with Ames’ Medium bubbled with a gas mixture of 5% CO2 and 95% O2.
To establish a whole-cell recording, provide gentle positive pressure through the pipette and position it on the membrane of the target cell using a micromanipulator while viewing the cell and pipette under the microscope.
Use the patch clamp amplifier to provide a 5 mV depolarizing step to measure resistance. The resistance will climb slightly as the pipette contacts the cell membrane.
Release the positive pressure and provide gentle suction while monitoring resistance to form a GΩ seal (seal resistance > 1 GΩ).
Once the GΩ seal is formed, apply a holding potential (-70 mV) and rupture the patch using either strong pulses of suction, gradual gentle suction with a syringe, or the ‘zap’ feature of the amplifier. The appearance of whole-cell capacitance transients indicates successful rupture of the patch and establishment of whole-cell recording.
In voltage-clamp, to record voltage-gated sodium and potassium currents (INa and IK), design a protocol in which the amplifier depolarizes the cell in increments of 10 mV (up to +50 mV). Use a P/8 leak subtraction protocol to subtract membrane leak and whole-cell capacitance transients from the data.
INa will be a fast inward current that rapidly inactivates, while IK is typically a slowly-developing and non-inactivating outward current (Figure 6).
Monitor the quality of the whole-cell recording by noting access resistance (Ra) using a 5 mV depolarizing pulse. Ra should be as low as possible (i.e., < 40 MΩ) and should remain relatively stable throughout the recording. Large Ra will introduce substantial voltage errors, distorting measures of current voltage-dependence and amplitude.
If INa is sufficiently large, the cell might generate action potentials in response to depolarizing current injections (+10 to +300 pA) in current-clamp mode (Figure 1). INa is typically blocked by the pufferfish toxin tetrodotoxin, which can be added to the extracellular solution and superfused onto the cells at a concentration of 0.5-2 μM.
Figure 1. Brain dissection.
Decapitate a PN2 rat pup and gently remove the brain from the skull (A-C). Remove the cortex overlying the midbrain, which is removed by horizontal cut to anterior-posterior axis (D-G).
Figure 2. The stoelting tissue slicer apparatus with double-edge stainless steel blades for slice cutting (A, B).
Figure 3. Schematic representation of agarose covered tissue.
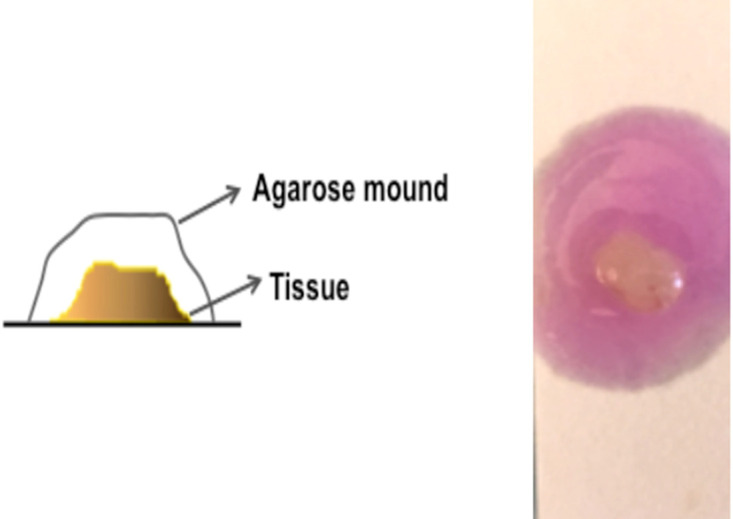
Figure 4. Filter paper mounted on sample stage (A) and tissue slices after slicing (B).
Figure 5. CFDA-tagged hiPSC-RGCs elaborated long processes toward SC cells aggregate (A), compared to the one co-cultured with IC cells aggregate (B).
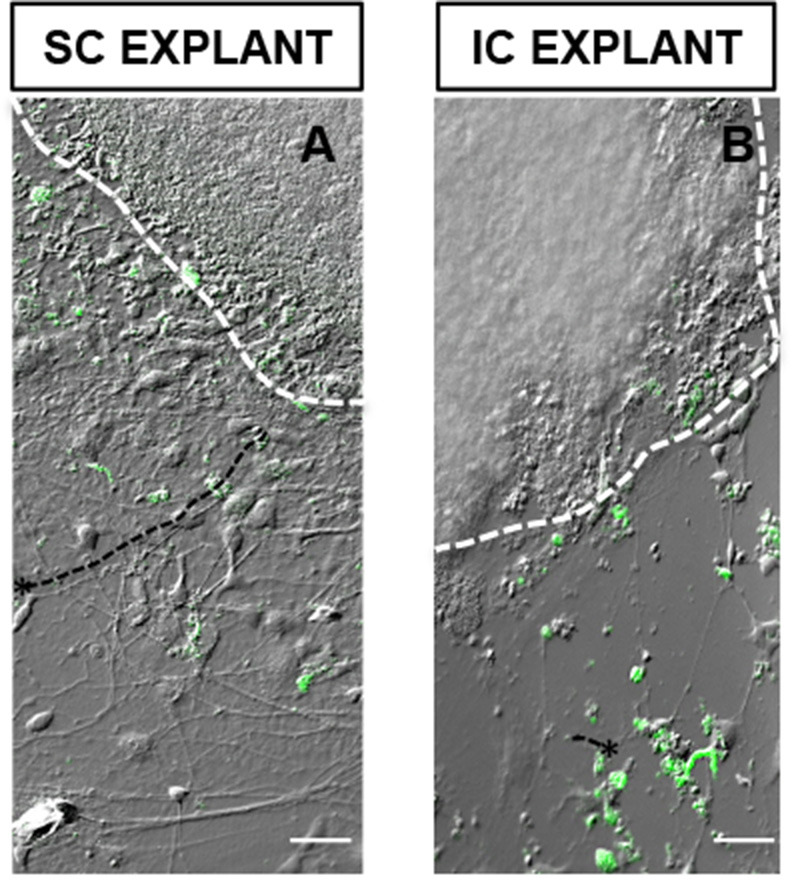
*Represents RGCs extending processes. Scale bars = 50 μm
Figure 6. Example recording of hiPSC-RGCs co-cultured with SC slices.
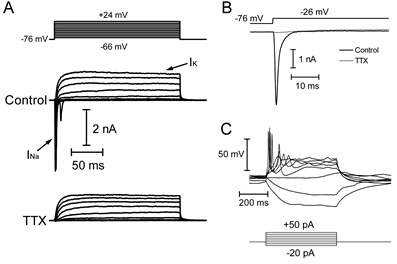
A. Whole-cell voltage clamp recording of INa and IK in response to step depolarizations (150 msec, -66 mV to +24 mV from a holding potential of -76 mV). INa is blocked by 1 mM TTX. B. Expanded time axis of current responses to a depolarizing step to -26 mV in control conditions and in the presence of 1 mM TTX. C. Current-clamp recording showing voltage responses to hyperpolarizing and depolarizing current injections (-20 to +50 pA). The cell fires action potentials in response to depolarizing current injections.
Data analysis
Imaging, quantification and analysis of dendritic branching
Mount coverslips on glass slides from 3-6 independent co culture experiments and capture images using fluorescent microscope.
For neurite tracing and sholl analysis collect images using Axiovision 4.8 software at 20x objective on a Zeiss upright fluorescent microscope. Conduct image analysis using ImageJ (NIH). Measure the length and complexity of dendritic branches independently for each group using the plugin Sholl Analysis (v1.50) in ImageJ by placing 20 μm concentric ring from the edge of neural rosettes as described previously ( Teotia et al., 2016 ).
Analyze and plot data using GraphPad Prism (GraphPad, La Jolla CA) and Windows Excel (Microsoft, Redmond, USA). Calculate statistical significance by either a paired Student’s t-test (two-tailed) or by one-way analysis of variance (ANOVA) for multiple groups.
Notes
When imaging cells, it is important to avoid areas where CFDA labeled cells are overlapping on the SC/IC tissue, and try to take into account only those areas where cells are juxtaposed to SC/IC explants.
Cells upon CFDA labeling can be used immediately. Non-toxicity and long-term retention of CFDA allows the fluorescence to be well retained in cells several days post staining. However, in case of cytotoxicity change culture media every day.
When reporting voltages, it is important to account for the liquid junction potential arising at the interface of the pipette solution and the extracellular solution. Although various software programs can calculate this value, it should ideally be empirically measured for each combination of solutions used. The LJP for our intracellular solution and Ames’ Medium was measured as 6 mV.
The intracellular can also contain Lucifer yellow CH dipotassium salt (2 mg/ml) in order to visualize cell morphology. Lucifer yellow CH is a fixable dye with an excitation spectrum peaking around 430 nm and emission peaking around 540 nm that, if desired, can be visualized in combination with immunocytochemistry after whole-cell recording. For different wavelength ranges, other dyes such as Alexa Fluor 568 Hydrazide can be used at 100-200 μM.
TTX solutions should be handled with care and properly disposed of according to institutional guidelines.
Recipes
-
Phosphate buffer saline (PBS)
137 mM NaCl
2.7 mM KCl
4.3 mM Na2HPO4
1.47 mM KH2PO4
Adjust to a final pH of 7.4
Autoclave at 121 °C for 30 min
-
Intracellular solution
98 mM KCH3SO4
44 mM KCl
3 mM NaCl
3 mM MgCl2
1 mM CaCl2
5 mM HEPES
2 mM glucose
3 mM EGTA
1 mM MgATP
1 mM Na2GTP
Adjusted pH to 7.3
Psmolality adjusted to ~280 mOsm
Acknowledgments
This work was supported by NIH/NEI: R01-EY022051 (IA).
Citation
Readers should cite both the Bio-protocol article and the original research article where this protocol was used.
References
- 1.Ahram D. F., Alward W. L. and Kuehn M. H.(2015). The genetic mechanisms of primary angle closure glaucoma. Eye 29(10): 1251-1259. [DOI] [PMC free article] [PubMed] [Google Scholar]
- 2.Danesh-Meyer H. V.(2011). Neuroprotection in glaucoma: recent and future directions. Curr Opin Ophthalmol 22(2): 78-86. [DOI] [PubMed] [Google Scholar]
- 3.Levin L. A., Ritch R., Richards J. E. and Borrás T.(2004). Stem cell therapy for ocular disorders. Arch Ophthalmol 122(4): 621-627. [DOI] [PubMed] [Google Scholar]
- 4.Marty A. and Neher E.(2009). Tight-seal whole-cell recording. In: Sakmann, B. and Neher, E.(Eds.). Single-Channel Recording. Springer, pp 31-52. [Google Scholar]
- 5.Molleman A.(2003). Patch clamping: an introductory guide to patch clamp electrophysiology. John Wiley& Sons. [Google Scholar]
- 6.Teotia P., Chopra D. A., Dravid S. M., Van Hook M. J., Qiu F., Morrison J., Rizzino A. and Ahmad I.(2016). Generation of functional human retinal ganglion cells with target specificity from pluripotent stem cells by chemically defined recapitulation of developmental mechanism. Stem Cells 35(3): 572-585. [DOI] [PMC free article] [PubMed] [Google Scholar]
- 7.Tham Y. C., Li X., Wong T. Y., Quigley H. A., Aung T. and Cheng C. Y.(2014). Global prevalence of glaucoma and projections of glaucoma burden through 2040: a systematic review and meta-analysis. Ophthalmology 121(11): 2081-2090. [DOI] [PubMed] [Google Scholar]
- 8.Van Hook M. J. and Thoreson W. B.(2014). Whole-cell patch-clamp recording. In: Xiong, H. and Gendelman, H. E.(Eds.). Current Laboratory Methods in Neuroscience Research. Springer, pp 353-367. [Google Scholar]


