Abstract
We aimed evaluate 18F-fluorodeoxyglucose uptake at major joints for differentiating patients with rheumatoid arthritis (RA) from those with non-RA arthritis using 18F-fluorodeoxyglucose (FDG)-positron emission tomography (PET).
Eighteen patients with RA (13 women; age, 66.8 ± 13.2 years) and 17 patients with non-RA (6 women; age, 50.8 ± 12.5 years) were included. Twelve joints of each patient were examined: shoulder, elbow, wrist, hip, knee, and ankle on both sides. A visual scoring (VS) system was used; quantitative parameters such as maximum standardized uptake value (SUVmax), metabolic active volume (MAV), and total lesion glycolysis (TLG) were evaluated. Total score and value of each parameter were compared between the RA and non-RA groups.
Total VS score (mean, 37.7 ± 9.0 vs 21.9 ± 7.2; P < .0001) and SUVmax (mean, 28.1 ± 8.5 vs 17.9 ± 5.8; P < .001) were significantly higher in the RA group than in the non-RA group. A significant between-group difference was also observed with respect to total MAV (608.3 ± 370.7 vs 176.5 ± 217.8; P < .001) and total TLG (1139.3 ± 759.1 vs 289.5 ± 395.4; P < .001). Receiver operating characteristic curve analysis revealed that total VS had the highest area under curve (.92), with sensitivity and specificity of 88.9% and 76.4%, respectively.
Quantitative PET parameters could differentiate RA from non-RA. Total VS score, however, appears to be the best convenient qualitative tool for diagnosing RA.
Keywords: fluorodeoxyglucose, positron emission tomography, rheumatoid arthritis
1. Introduction
Positron emission tomography (PET)/computed tomography (CT) with 18F-fluorodeoxyglucose (FDG) has emerged to be a powerful imaging tool in the field of oncology.[1–3] FDG-PET provides detailed functional and metabolic information based on increased glucose uptake and glycolysis in cancer cells.[4] This imaging tool has recently been increasingly used for assessing inflammatory diseases. The benefit of using FDG-PET for assessing noncancerous diseases such as osteomyelitis, sarcoidosis, fever of unknown origin, and vasculitis has been well demonstrated.[5–7] Upregulation of glucose transporters in inflammatory cells along with enhanced expression of various inflammatory cytokines enhances FDG uptake in inflammatory states.[8,9] These findings suggest the feasibility of using FDG for assessing various inflammatory joint disorders.
Rheumatoid arthritis (RA), a chronic autoimmune polyarthritis with a global prevalence of .24%, is a highly debilitating disease that is characterized by synovitis and bone destruction.[10] The diagnosis of RA is largely based on clinical[11] and laboratory evaluation of several biological parameters such as rheumatoid factor, C-reactive protein (CRP), erythrocyte sedimentation rate (ESR), and matrix metalloproteinases-3 (MMP-3). These clinical criteria, however, do not accurately reflect the disease activity. Furthermore, increased levels of these parameters are observed in both RA and other inflammatory polyarthropathies. Hence, early differentiation from other inflammatory polyarthropathies can be difficult. Because early treatment dramatically affects the outcome, accurate differential diagnosis of arthritis at an early stage is highly desirable.[12] Magnetic resonance imaging (MRI) and sonography have been recently demonstrated to be effective for detecting synovitis in the early stages of the disease. Although RA, however, involves multiple joints of the body, whole-body imaging with MRI appears to be technically unfeasible and is time consuming. Similarly, sonography largely provides morphological information and is liable to considerable interobserver variability.[13] In this context, using FDG-PET can potentially provide unique quantitative metabolic information for systemic assessment of disease activity in patients with RA.
Use of FDG-PET for quantification of metabolic changes in RA was first reported by Palmer et al. Its use as a potential tool to distinguish RA from other joint diseases,[14] for monitoring of disease activity[15] and therapeutic response,[16] and to predict subsequent disease progression[17] has since been widely investigated. Only a limited number of PET parameters have, however, been studied and the diagnostic value of these parameters has not been systemically investigated. The maximum standardized uptake value (SUVmax) is a commonly used PET parameter for quantification of inflammation. Recently, more precise volumetric PET parameters, such as metabolic tumor volume (MTV) and total lesion glycolysis (TLG) have been used for metabolic evaluation of several malignancies.[18–20] Nonetheless, to date, no such volumetric PET parameters have been used to evaluate inflammatory joint disorders.
In the present study, we used a hybrid PET/CT system and systematically studied PET parameters of cumulative FDG uptake as well as some novel parameters such as metabolic active volume (MAV) and TLG, to differentiate RA from a heterogeneous group of inflammatory spondyloarthritis (non-RA), and assessed their diagnostic value.
2. Materials and methods
2.1. Subjects
A retrospective study was conducted from January 2013 until December 2015. Our institutional review board approved the study; written informed consent was obtained from all patients before their enrolment. A total of 35 patients were included in the study. Among these, 18 patients (5 men and 13 women; mean age, 66.8 years; range, 22–80 years) were diagnosed as cases of RA based on American College of Rheumatology (ACR) revised criteria 1987[11]; 17 patients (11 men and 6 women; mean age, 50.8 years; range, 33–71 years) who had presented with arthritis and did not qualify the ACR criteria for RA were categorized as aseptic arthritis other than RA (non-RA). All patients with RA were treated with 1 or 2 disease-modifying drugs; 3 of these patients received additional nonsteroidal anti-inflammatory drugs; 3 other patients received additional steroid injections. Thirteen patients in the non-RA group were treated with either steroid or nonsteroidal anti-inflammatory drugs (NSAIDs; steroids, n = 4; NSAID, n = 9), whereas 4 patients did not receive any medication. Non-RA group comprised patients with a heterogeneous group of aseptic arthritis: nonspecific arthritis (n = 10); SAPHO syndrome (n = 5); IgG4 arthritis (n = 1); and psoriatic arthritis (n = 1). Inclusion in the non-RA group was based solely on seronegativity and clinical assessment.
2.2. Biological parameters
CRP, ESR, and MMP-3 were evaluated for both RA and non-RA patients within 1 week before or after PET/CT examination.
2.3. FDG-PET/CT image acquisition
Whole-body PET was performed following an intravenous injection of 18F-FDG (5 MBq/kg) after the patient had fasted for more than 6 hours. Data acquisition was done in 3D mode, 60 minutes after the injection, with a PET/CT scanner (Biograph 16; Siemens Medical Solutions Inc, Munich, Germany). Patients were scanned from head to toe in the arms-down position. Attenuation correction of the PET images was performed with low-voltage CT. FDG uptakes in bilateral shoulders, elbows, wrists, hips, knees, and ankle joints were recorded. In each patient, 12 joints were assessed; a total of 420 joints were assessed in the study. All these patients underwent FDG PET/CT for evaluation of malignancy or for suspicion of malignancy.
2.4. Data analysis
By integrating data on attenuation-corrected transaxial images, the injected doses of FDG, the patient's body weight, and the cross-calibration factor between the PET and dose calibrator, functional SUV images were produced and semiquantitative analysis was done. The SUV was defined as follows: SUV = radioactive concentration in the region of interest (ROI) (MBq/g)/injected dose (MBq)/patient's body weight (g).
ROIs for each joint were manually marked using a dedicated workstation (GE Advantage workstation 4.6; GE Healthcare, Milwaukee, WI). The ROI analyses were performed by an experienced nuclear medicine physician with the help of CT images of the relevant areas. SUVmax in the ROI was used as the representative value for the assessment of the FDG uptake.
FDG uptake in large joints was also visually evaluated by 2 expert nuclear medicine physicians (Y.A., A.T.) using a scoring system as follows: (1) no uptake above background; (2) uptake < mediastinum; (3) uptake ≥ mediastinum but ≤ liver; (4) uptake moderately increased compared to liver at any site; (5) uptake markedly increased compared to liver at any site (Fig. 1).[21] Joints with visual uptake score of 1 were classified as FDG negative; those with visual uptake score ≥2 were classified as FDG positive. The total numbers of PET-positive and PET-negative joints were evaluated in both groups.
Figure 1.
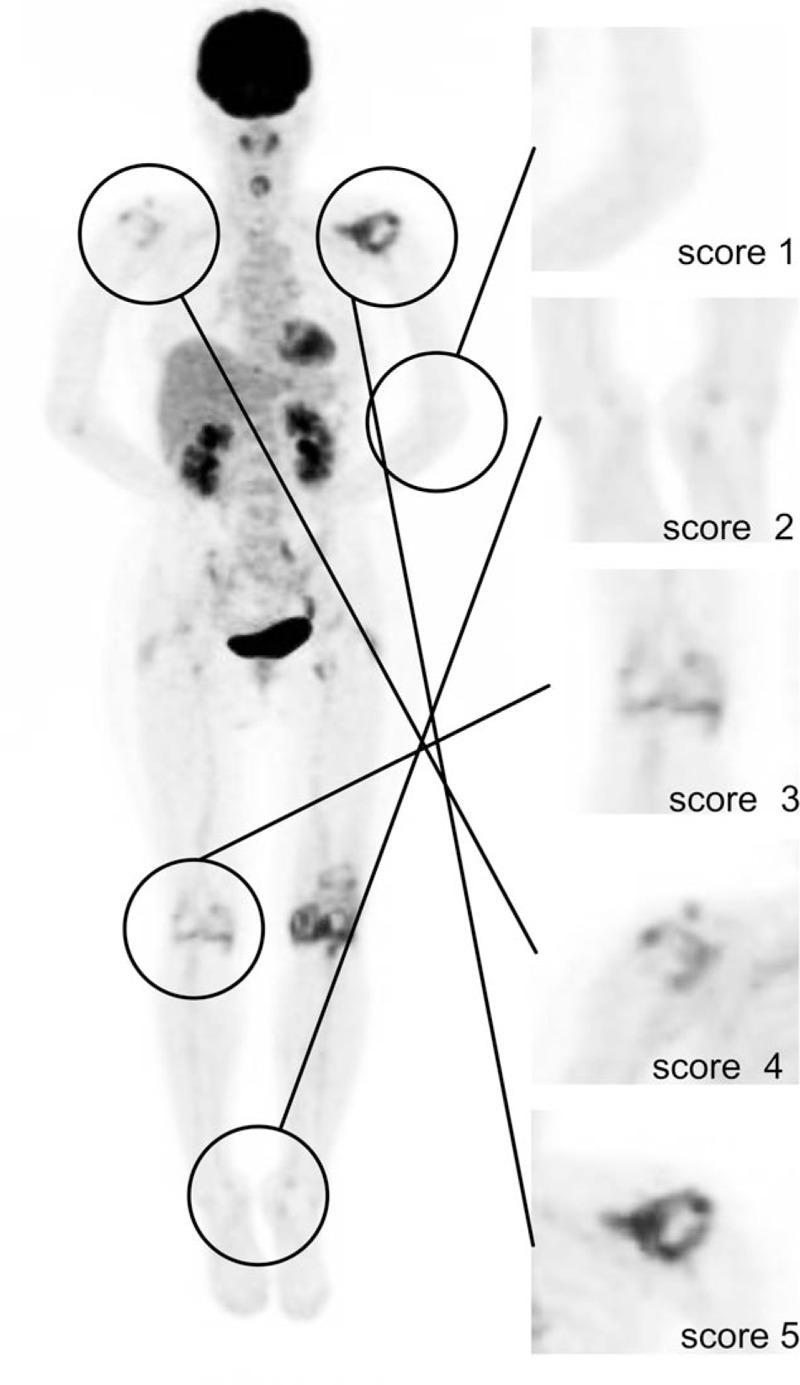
Anterior maximum intensity projection image of 18F FDG-PET/CT for evaluation of visual score with the corresponding 5-scale visual scoring system (right) employed in the study.
Based on the visual score, receiver operating characteristic (ROC) curve analysis was performed to determine the optimal threshold level for SUVmax. The derived SUVmax cut-off value was fed into an automated segmentation software, PET-VCAR (GE Healthcare, Milwaukee, WI), to determine the volumetric metabolic parameters, MAV, and TLG. PET-VCAR performs autosegmentation on defined threshold volumes and automatically calculates MAV and average SUV. TLGs of each joint were calculated as the product of MAV and average SUV within that volume. The sum of visual score (total visual score) and the sum of metabolic parameters were calculated for each patient.
For assessment of laterality, the uptake in the right-sided joints was compared with that in the left-sided joints. The absolute value of SUVmax was calculated by subtraction of left-sided SUVmax from the right-sided SUVmax for each joint pair. A cumulative absolute value was calculated by addition of the absolute value for each joint pair and the sum of absolute values was obtained for each patient. The sum of absolute value is termed as laterality bias of SUVmax. All parameters, including total visual score, sum of SUVmax, total MAV, total TLG, number of PET-positive joints, and the laterality bias of SUVmax were compared between RA and non-RA patients.
2.5. Statistical analysis
Spearman correlation was used to assess the correlation of sum of SUVmax and total MAV with the total visual score. Unpaired t test was performed for each patient to compare the biological parameters, total visual score, sum of SUVmax, total MAV, total TLG, number of PET-positive joints, and the laterality bias between RA and non-RA. Pearson correlation was used for correlation of SUVmax between right and left side of the joint. ROC analysis was performed to determine the threshold of SUVmax, the cut-off of total score, sum of SUVmax, total MAV, total TLG, and laterality, in terms of their ability to differentiate RA from non-RA. Sensitivity, specificity, positive predictive value, negative predictive value, accuracy, and area under curve (AUC) were then calculated using the ROC curve. Chi-square test was used to assess the correlation between various metabolic parameters with use of different cut-off values. All data are expressed as mean ± SD. The IBM SPSS Statistics 22 software program (International Business Machines Corp, New York) was used for data analysis, and P values of <.05 were considered to be statistically significant.
3. Results
Eighteen patients with RA and 17 non-RA patients included in the study were compared on the basis of biological and PET-based parameters, including the metabolic parameters.
3.1. Biological parameters
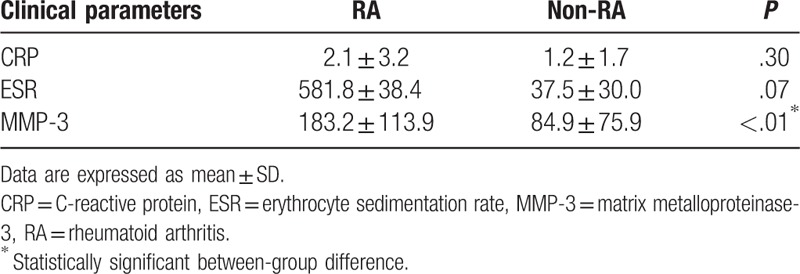
Mean ESR (58.8 ± 38.4) and CRP (2.1 ± 3.2) levels in the RA group were higher than those in the non-RA group (37.5 ± 30.0 and 1.2 ± 1.7, respectively); however, the between-group difference was not statistically significant (Table 1). Mean MMP-3 level in the RA group was, however, significantly higher than that in the non-RA group (183.2 ± 113.9 vs 84.9 ± 75.9; P < .01).
Table 1.
Comparison of biological parameters between rheumatoid arthritis and nonrheumatoid arthritis groups.
3.2. FDG uptake and volumetric metabolic parameters
FDG uptake at all joints was graded and compared based on the visual PET score (Fig. 1). On group-based comparison (Fig. 2A), the total visual score, derived from the added sum of all visual scores from all assessed joints, was observed to be significantly higher in the RA group as compared to that in the non-RA group (37.7 ± 9.0 vs 21.9 ± 7.2; P < .0001). Similarly, another parameter for FDG uptake, the total SUV max, obtained from the sum of SUVmax in the ROI for each joint in patients with RA was also significantly higher than that in non-RA patients (28.1 ± 8.5 vs 17.9 ± 5.8; P < .001; Fig. 2B). On evaluation of volumetric metabolic parameters, the total MAV (608.3 ± 370.7 vs 176.5 ± 217.8; P < .001) as well as total TLG (1139.3 ± 759.1 vs 289.5 ± 395.4; P < .001) in patients with RA were significantly higher than those in non-RA patients. Furthermore, the total number of PET-positive joints in patients with RA was significantly higher than those in non-RA patients (11.1 ± 1.3 vs 6.1 ± 3.4; P < .0001). The total visual score showed a strong correlation with the sum of SUVmax (r = 0.91; P < .0001) (Fig. 3A) and total MAV (r = 0.78; P < .0001) (Fig. 3B) in all patients.
Figure 2.
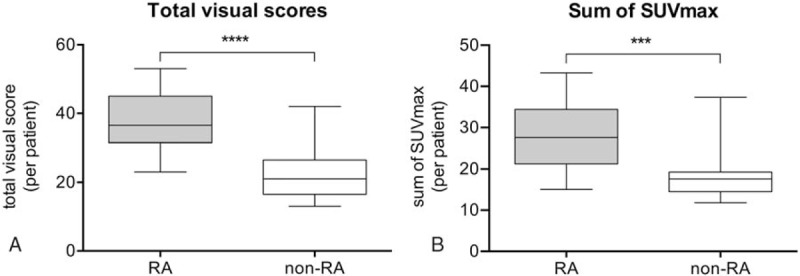
Box plot representation of the distribution of total visual scores (A) and sum of SUVmax (B) in RA and non-RA groups. Total visual scores (mean, 37.6 ± 9.0 vs 21.5 ± 7.2; P < .0001) and sums of SUVmax (mean, 28.1 ± 8.5 vs17.9 ± 5.81; P < .0001) in the RA group were significantly higher than those in the non-RA group. RA = rheumatoid arthritis, SUVmax = maximum standardized uptake value.
Figure 3.
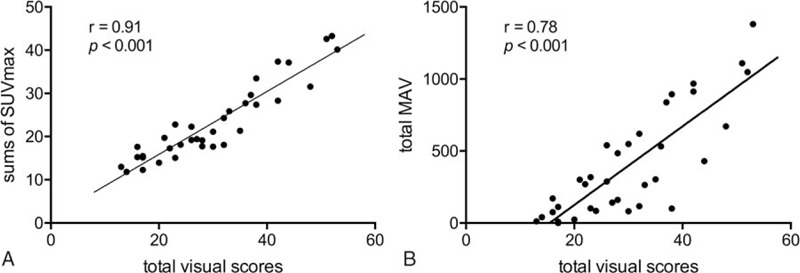
Correlation of total visual scores with sum of SUVmax (A) and total MAV (B). A strong correlation of total visual score with sum of SUVmax (r = 0.91; P < .0001) and total MAV (r = 0.78; P < .0001) is observed. MAV = metabolic active volume, SUVmax = maximum standardized uptake value.
3.3. Assessment of the pattern of joint involvement in terms of laterality
The higher SUV max and the lower SUV max for each right- and left-sided joint pair showed a high correlation for both RA (r = 0.898; P < .001) and non-RA (r = 0.950; P < .001) patients. The RA group, however, showed a more heterogeneous distribution as compared to that in the non-RA group. Furthermore, the laterality bias of SUVmax values was found to be significantly higher in the RA group as compared to that in the non-RA group (3.6 ± 1.9 vs 1.8 ± .8; P < .01) (Fig. 4).
Figure 4.
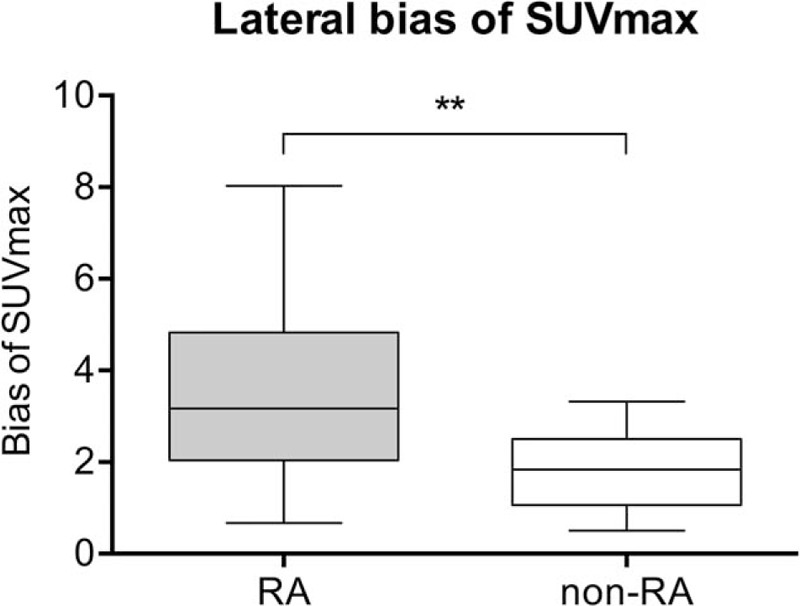
Plot showing the laterality bias of SUVmax in non-RA and RA patients. The cumulative absolute difference between right- and left-sided SUVmax for each joint pair was significantly different between RA and non-RA patients (mean, 3.6 ± 1.9 vs 1.8 ± .8; P < .01). RA = rheumatoid arthritis, SUVmax = maximum standardized uptake value.
3.4. ROC curve analysis for PET-based metabolic parameters
The diagnostic performance of each parameter to differentiate RA and non-RA patients and the optimal cut-off levels are presented in Table 2. Use of total visual score cut-off level of 26.5 to differentiate between RA and non-RA was associated with 88.9% sensitivity and 76.5% specificity (AUC, 0.92). A threshold level of 20.4 for the sum of SUVmax was associated with 83.3% sensitivity and 88.2% specificity (AUC, 0.86). Similarly, threshold level of 8.5 for PET-positive joints to distinguish between RA and non-RA was associated with 94% sensitivity and 70% specificity (AUC, 0.90). Optimal cut-off levels for total MAV and total TLG were associated with a sensitivity and specificity of 83.3% and 70.6% (AUC, 0.86) and 83.3% and 88.2% (AUC, 0.87), respectively. The laterality bias of SUVmax showed the lowest diagnostic performance among all parameters (optimal cut-off level, 2.2; AUC, 0.79) (Fig. 5).
Table 2.
Statistical measures and significance levels of different positron emission tomography–based parameters.

Figure 5.
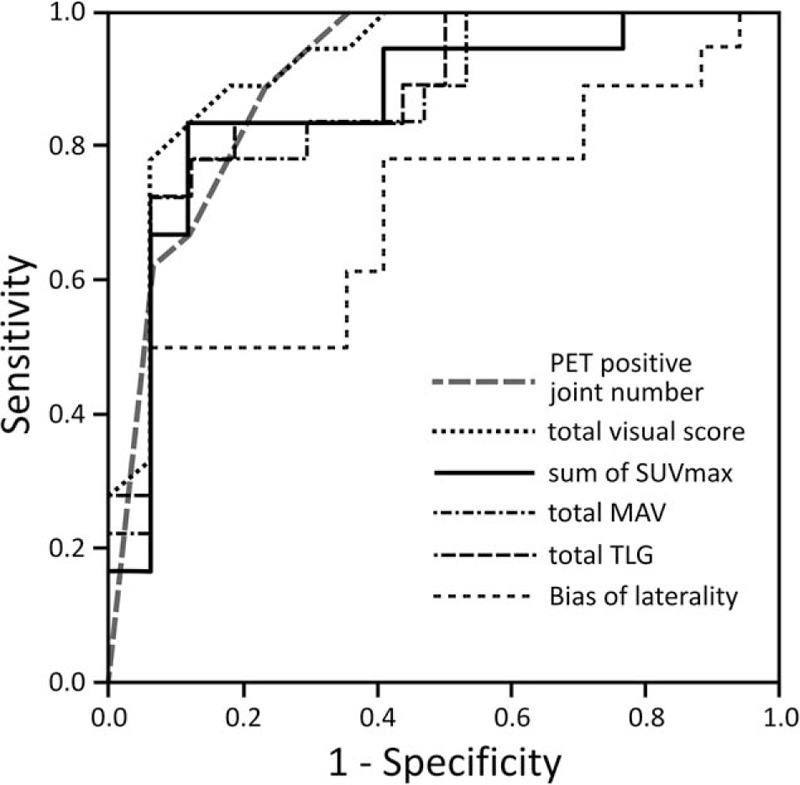
ROC curves for number of PET-positive joints, total visual score, sum of SUVmax, total MAV, total TLG, and laterality bias to differentiate RA from non-RA. Detailed results are given in Table 2. MAV = metabolic active volume, PET = positron emission tomography, RA = rheumatoid arthritis, ROC = receiver operating characteristic, SUVmax = maximum standardized uptake value, TLG = total legion glycolysis.
4. Discussion
In the present study, we performed the first comprehensive assessment of the diagnostic performance of several PET/CT-based parameters to distinguish RA from non-RA. Threshold levels associated with statistically significant diagnostic ability were found for commonly employed PET parameters such as the total visual score and the sum of SUVmax, as well as for novel volumetric metabolic parameters such as total MAV and TLG.
The total visual score system used in the present study is a relatively simple and fast method for interpretation of PET findings in clinical settings. This methodology has previously been assessed for use as a prognostic tool to monitor therapeutic response in patients with RA and as a diagnostic tool to compare the uptake pattern in patients with RA and in those with spondyloarthropathy.[16,22–24] Similar to the findings in these studies, the visual score for patients with RA was higher than that for those who were non-RA; more importantly, it showed a high sensitivity for differentiating RA from other heterogeneous groups of inflammatory arthropathies. However, the specificity for these parameters was observed to be relatively lower than other parameters. For visual assessment, we employed a modified scoring system, as reported by Kubota et al[21]; the reproducibility and interobserver variability of this system was reported to be approximately 85%. A visual evaluation system would be more likely to overlook artifacts and background activity. This would be particularly important in seronegative inflammatory arthropathies, in which surrounding overlapping inflammatory activity in adjacent joint regions may potentially lead to overestimation of the visual score and thus contribute to lower specificity.
The cumulative semiquantitative parameter of FDG uptake, SUVmax, has been shown to be a useful systemic tool to differentiate RA from other forms of inflammatory arthropathies[25,26]; it has been shown to correlate with clinical and inflammatory parameters as well as disease activity in patients with RA.[15,21] SUVmax was also found useful in our study to differentiate RA from other heterogeneous forms of arthropathies. In previous MRI and sonography studies, SUVmax was shown to correlate with enhanced pannus volume and glucose utilization by the macrophages in the pannus of patients with RA. These mechanisms might explain the higher FDG uptake in these patients, whereas fibrosis and ossification of synovial membranes in most non-RA cases might explain the less intense uptake.[27–30] Septic inflammation of joint could also lead to high FDG uptake and should be considered for differentiation; however, clinical progression and manifestation would apparently be different from aseptic arthritis and RA. Although the sensitivity of this parameter was relatively lower than that of the qualitative parameters of visual assessment, we found a very high specificity for this parameter among all assessed parameters, and the volumetric metabolic parameter TLG also showed an equal specificity. As TLG reflects both the degree of FDG uptake and the size of metabolically active lesion, the specificity in our study might be due to the multiple vantage points of this parameter.
Our report is the first study to examine metabolic parameters such as MAV and TLG in patients with arthritis and assess their ability to distinguish RA from non-RA cases. These metabolic parameters have been recognized for their role as prognostic markers in various malignancies[31,32]; and are considered to reflect the disease activity more precisely than other currently used parameters. The technique for assessment of MAV in this study was similar to volumetric measurement in tumor studies, albeit the use of the term MTV is preferred in for assessment of malignancies. The MAV and TLG represent the volumetric metabolic measure of the total inflammatory burden, and both of these parameters showed a significant positive correlation with the total visual score. These parameters were significantly different in RA and non-RA groups and thus may aid in the differential diagnosis in these patients. Although MAV and TLG showed similar sensitivity, the specificity of total TLG was comparatively higher and was similar to that of SUVmax. This was also the first study to explore the utility of total TLG and MAV in patients with arthritis, and our results provide significant evidence for incorporation of these parameters in future joint assessment studies.
Another interesting finding in our study pertained to the laterality in patients with RA. Although clinical symmetry is included as an important parameter in the ACR revised criteria 1987, variation does exist as shown in recent radiological reports; indeed, this aspect of RA is increasingly being questioned. Comparatively few radiological studies have assessed symmetry in RA; most of these were based on the Larsen method for joint assessment.[33,34] Although some studies found no difference in global symmetry in seropositive or patients with RA as compared to the respective control groups, others have reported up to 13% to 16% asymmetry in RA subjects.[35–38] The latter studies involved only a small number of joints, and in particular, the metacarpophalangeal and proximal interphalangeal joints of the hands, whereas global symmetry was not assessed. Our study is the first to assess global symmetry by comparing semiquantitative FDG uptake; we found significantly higher laterality among patients with RA as compared to that in non-RA patients. The higher laterality in RA might be due to the higher uptake in some of the more inflamed joints of patients with RA compared to their contralateral joints, whereas the joint uptake was uniformly low in non-RA patients.
Although all evaluated PET-based parameters showed significant difference between the 2 groups, the biological parameters of CRP and ESR did not show any significant between-group difference. And the ESR and CRP do not show any correlation with the FDG uptake in our study reflecting the similar disease status between the 2 groups of patients. Only MMP-3 showed statistically significant difference between 2 groups. These findings suggest that metabolic imaging parameters would be better for the differential diagnosis and assessment of inflammatory arthropathies.
Our study had some limitations. First, we only assessed the correlation of PET-based parameters among each other. We, however, believe that the correlation of these parameters, especially that of the novel parameters TLG and MAV, with clinical indicators of disease activity indicates their great potential to contribute in management of therapy. Second, we relied on ROC analysis of all studied patients to determine the single SUVmax threshold to calculate MAV and TLG. Because the range of SUVmax in each group might be different, the appropriate threshold for each group should have been investigated independently.
5. Conclusion
All the assessed parameters (total visual score, number of PET-positive joints, sum of SUVmax, total MAV, total TLG, and laterality bias) of FDG-PET were able to discriminate RA from another heterogeneous group of inflammatory arthropathies. Visual assessment including total visual score and number of PET-positive joints would be the easiest tool to use in clinical practice and has a high sensitivity. However, SUVmax and volumetric metabolic parameters, especially TLG, might be more specific. The utility of volumetric metabolic parameters (TLG and MAV) for evaluation of therapeutic response should be studied in a larger number of patients.
Acknowledgments
This work has been performed in Gunma University Hospital and was supported by all staff members. The authors are very grateful to Dr Ayako Taketomi Takahashi for her assistance in writing the manuscript in English. The authors thank all the co-medical and medical staff involved in the patient care.
Footnotes
Abbreviations: CRP = C-reactive protein, ESR = erythrocyte sedimentation rate, FDG = 18F-fluorodeoxyglucose, MAV = metabolic active volume, MMP-3 = matrix metalloproteinase-3, MRI = magnetic resonance imaging, PET/CT = positron emission tomography integrated with computed tomography, ROC = receiver operating characteristic, SUVmax = maximum standardized uptake value, TLG = total lesion glycolysis.
The authors have no conflicts of interest to disclose.
References
- [1].Hillner BE, Siegel BA, Liu D, et al. Impact of positron emission tomography/computed tomography and positron emission tomography (PET) alone on expected management of patients with cancer: initial results from the National Oncologic PET Registry. J Clin Oncol 2008;26:2155–61. [DOI] [PubMed] [Google Scholar]
- [2].Juweid ME, Cheson BD. Positron-emission tomography and assessment of cancer therapy. N Engl J Med 2006;354:496–507. [DOI] [PubMed] [Google Scholar]
- [3].Jadvar H, Desai B, Ji L, et al. Baseline 18F-FDG PET/CT parameters as imaging biomarkers of overall survival in castrate-resistant metastatic prostate cancer. J Nucl Med 2013;54:1195–201. [DOI] [PMC free article] [PubMed] [Google Scholar]
- [4].Basu S, Hess S, Nielsen Braad P-E, et al. The basic principles of FDG-PET/CT imaging. PET Clin 2014;9:355–70. [DOI] [PubMed] [Google Scholar]
- [5].Balink H, Bennink RJ, Van Eck-Smit BLF, et al. The role of 18F-FDG PET/CT in large-vessel vasculitis: appropriateness of current classification criteria? BioMed Res Int 2014;2014:687608. [DOI] [PMC free article] [PubMed] [Google Scholar]
- [6].Dioguardi P, Gaddam SR, Torigian DA. FDG PET assessment of osteomyelitis: a review. PET Clin 2012;7:161–79. [DOI] [PubMed] [Google Scholar]
- [7].Sobic-Saranovic D, Artiko V, Obradovic V. FDG PET imaging in sarcoidosis. Semin Nucl Med 2013;43:404–11. [DOI] [PubMed] [Google Scholar]
- [8].Zhuang H, Alavi A. 18-Fluorodeoxyglucose positron emission tomographic imaging in the detection and monitoring of infection and inflammation. Semin Nucl Med 2002;32:47–59. [DOI] [PubMed] [Google Scholar]
- [9].Love C, Tomas MB, Tronco GG, et al. FDG PET of infection and inflammation. Radiographics 2005;25:1357–68. [DOI] [PubMed] [Google Scholar]
- [10].Cross M, Smith E, Hoy D, et al. The global burden of rheumatoid arthritis: estimates from the Global Burden of Disease 2010 study. Ann Rheum Dis 2014;73:968–74. [DOI] [PubMed] [Google Scholar]
- [11].Arnett FC, Edworthy SM, Bloch DA, et al. The American Rheumatism Association 1987 revised criteria for the classification of rheumatoid arthritis. Arthritis Rheum 1988;31:315–24. [DOI] [PubMed] [Google Scholar]
- [12].Landewe RBM, Boers M, Verhoeven AC, et al. COBRA combination therapy in patients with early rheumatoid arthritis: long-term structural benefits of a brief intervention. Arthritis Rheum 2002;46:347–56. [DOI] [PubMed] [Google Scholar]
- [13].Tan YK, Østergaard M, Conaghan PG. Imaging tools in rheumatoid arthritis: ultrasound vs magnetic resonance imaging. Rheumatology 2012;51:36–42. [DOI] [PubMed] [Google Scholar]
- [14].Palmer WE, Rosenthal DI, Schoenberg OI, et al. Quantification of inflammation in the wrist with gadolinium-enhanced MR imaging and PET with 2-[F-18]-fluoro-2-deoxy-D-glucose. Radiology 1995;196:647–55. [DOI] [PubMed] [Google Scholar]
- [15].Beckers C, Ribbens C, Marcelis S. Assessment of disease activity in rheumatoid. J Nucl Med 2004;45:956–64. [PubMed] [Google Scholar]
- [16].Okamura K, Yonemoto Y, Okura C, et al. Evaluation of tocilizumab therapy in patients with rheumatoid arthritis based on FDG-PET/CT. BMC Musculoskelet Disord 2014;15:393. [DOI] [PMC free article] [PubMed] [Google Scholar]
- [17].Yonemoto Y, Okamura K, Kobayashi T, et al. Predictive factors related to shoulder joint destruction in rheumatoid arthritis patients treated with biologics: a prospective study. Mod Rheumatol 2016;1–6. In press. [DOI] [PubMed] [Google Scholar]
- [18].Davison JMG, Russo G, Subramaniam RM. PET-based primary tumor volumetric parameters and survival of patients with non-small cell lung carcinoma. Am J Roentgenol 2013;200:635–40. [DOI] [PubMed] [Google Scholar]
- [19].Paidpally VCA, Chung CH, Richmon J, et al. FDG volumetric parameters and survival outcomes after definitive chemoradiotherapy in patients with recurrent head and neck squamous cell carcinoma. Am J Roentgenol 2014;203:W139–45. [DOI] [PMC free article] [PubMed] [Google Scholar]
- [20].Hong JHKH, Han EJ, Byun JH, et al. Total lesion glycolysis using 18F-FDG PET/CT as a prognostic factor for locally advanced esophageal cancer. J Korean Med Sci 2016;31:39–46. [DOI] [PMC free article] [PubMed] [Google Scholar]
- [21].Kubota K, Morooka IK, Mitsumoto M, et al. Whole-body FDG-PET/CT on rheumatoid arthritis of large joints. Ann Nucl Med 2009;23:783–91. [DOI] [PubMed] [Google Scholar]
- [22].Okamura K, Yonemoto Y, Arisaka Y, et al. The assessment of biologic treatment in patients with rheumatoid arthritis using FDG-PET/CT. Rheumatology 2012;51:1484–91. [DOI] [PubMed] [Google Scholar]
- [23].Vijayant V, Sarma M, Aurangabadkar H, et al. Potential of (18)F-FDG-PET as a valuable adjunct to clinical and response assessment in rheumatoid arthritis and seronegative spondyloarthropathies. World J Radiol 2012;4:462–8. [DOI] [PMC free article] [PubMed] [Google Scholar]
- [24].Goerres GW, Forster A, Uebelhart D, et al. F-18 FDG whole-body PET for the assessment of disease activity in patients with rheumatoid arthritis. Clin Nucl Med 2006;31:386–90. [DOI] [PubMed] [Google Scholar]
- [25].Taniguchi Y, Arii K, Kumon Y, et al. Positron emission tomography/computed tomography: a clinical tool for evaluation of enthesitis in patients with spondyloarthritides. Rheumatology 2010;49:348–54. [DOI] [PubMed] [Google Scholar]
- [26].Okabe T, Shibata H, Shizukuishi K, et al. F-18 FDG uptake patterns and disease activity of collagen vascular diseases-associated arthritis. Clin Nucl Med 2011;36:350–4. [DOI] [PubMed] [Google Scholar]
- [27].Beckers CJX, Ribbens C, André B, et al. (18)F-FDG PET imaging of rheumatoid knee synovitis correlates with dynamic magnetic resonance and sonographic assessments as well as with the serum level of metalloproteinase-3. Eur J Nucl Med Mol 2006;33:275–80. [DOI] [PubMed] [Google Scholar]
- [28].Matsui T, Nakata N, Nagai S, et al. Inflammatory cytokines and hypoxia contribute to 18F-FDG uptake by cells involved in pannus formation in rheumatoid arthritis. J Nucl Med 2009;50:920–6. [DOI] [PubMed] [Google Scholar]
- [29].McGonagle D, Gibbon W, Emery P. Classification of inflammatory arthritis by enthesitis. Lancet 1998;352:1137–40. [DOI] [PubMed] [Google Scholar]
- [30].Kubota R, Yamada S, Kubota K, et al. Fluorodeoxyglucose in vivo: high accumulation in macrophages and granulation tissues studied by microautoradiography. J Nucl Med 1992;33:1972–80. [PubMed] [Google Scholar]
- [31].Lee JW, Kang CM, Choi HJ, et al. Prognostic value of metabolic tumor volume and total lesion glycolysis on preoperative 18F-FDG PET/CT in patients with pancreatic cancer. J Nucl Med 2014;55:898–904. [DOI] [PubMed] [Google Scholar]
- [32].Lim R, Eaton A, Lee NY, et al. 18F-FDG PET/CT metabolic tumor volume and total lesion glycolysis predict outcome in oropharyngeal squamous cell carcinoma. J Nucl Med 2012;53:1506–13. [DOI] [PubMed] [Google Scholar]
- [33].Bukhari M, Lunt M, Harrison BJ, et al. Erosions in inflammatory polyarthritis are symmetrical regardless of rheumatoid factor status: results from a primary care-based inception cohort of patients. Rheumatology 2002;41:246–52. [DOI] [PubMed] [Google Scholar]
- [34].Boini SGF. Radiographic scoring methods as outcome measures in rheumatoid arthritis: properties and advantages. Ann Rheum Dis 2001;60:817–27. [PMC free article] [PubMed] [Google Scholar]
- [35].Zangger P, Keystone EC, Bogoch ER. Asymmetry of small joint involvement in rheumatoid arthritis: prevalence and tendency towards symmetry over time. Joint Bone Spine 2005;72:241–7. [DOI] [PubMed] [Google Scholar]
- [36].Panayi GS, Celinska E, Emery P, et al. Seronegative and seropositive rheumatoid arthritis: similar diseases. Br J Rheumatol 1987;26:172–80. [DOI] [PubMed] [Google Scholar]
- [37].Burns TM, Calin A. The hand radiograph as a diagnostic discriminant between seropositive and seronegative ‘rheumatoid arthritis’: a controlled study. Ann Rheum Dis 1983;42:605–12. [DOI] [PMC free article] [PubMed] [Google Scholar]
- [38].El-Khoury GY, Larson RK, Kathol MH, et al. Seronegative and seropositive rheumatoid arthritis: radiographic differences. Radiology 1988;168:517–20. [DOI] [PubMed] [Google Scholar]


