

Abstract
When the sensory block level (SBL) is ≥T5 or T4, a high incidence of hypotension occurs in parturients after spinal anesthesia. A rapidly ascending SBL is another risk factor for spinal anesthesia-induced hypotension. However, the relationship between the ascension rate of the SBL and spinal anesthesia-induced hypotension remains unclear.
After placement in the left lateral position, combined epidural–spinal anesthesia was performed on 140 parturients undergoing caesarean section using the following procedure: no volume preloading, injection site of L3–4 or L4–5, injection rate of 0.1 mL/sec, and administration of 10 mg of 0.5% hyperbaric bupivacaine. A receiver-operating characteristic curve was built to estimate the accuracy of the SBL ascension rate in detecting spinal anesthesia-induced hypotension.
The mean time interval from spinal injection to placement in the supine position was 136 ± 10 seconds in all anesthesia procedures. The earliest and most complete records of the SBL started from the 3rd minute after spinal injection. The threshold spread rate corresponding to the highest accuracy for occurrence of hypotension was an SBL of ≥T8 at the 3rd minute after spinal injection, with 82% and 88% sensitivity and specificity, respectively.
The ascension rate of an SBL of ≥T8 at the 3rd minute after spinal injection is as a predictor of hypotension in parturients.
Keywords: hypotension, parturients, sensory block level, spinal anesthesia
1. Introduction
An extensive and rapidly ascending sensory block level (SBL) readily contributes to the high incidence of hypotension after spinal anesthesia in parturients, increasing the risk of maternal discomfort and fetal anoxia.[1,2] Various studies have revealed that spinal anesthesia-induced hypotension occurs at a high incidence after sensory block at the level of ≥T5 or T4 in parturients.[3–6] These findings are supported by the fact that nerve fibers affecting the vasomotor tone of the arterial and venous vessels arise from T5–L1 and that cardioaccelerator fibers arise from T1–T4. Although a rapidly ascending SBL is another risk factor, how the rate of ascension of the SBL induces spinal anesthesia-induced hypotension is unclear. Therefore, the purpose of this study was to elucidate the relationship between the rate of SBL ascension and spinal anesthesia-induced hypotension after spinal anesthesia in parturients.
2. Methods
This prospective observational study was performed after the Institution's Ethics Examining Committee of Human Research's approval. After the consent form signed, 140 healthy parturients at term with singleton pregnancy scheduled for elective caesarean sections from October 2015 to August 2016 were recruited in this study. Excluded from the study were parturients below the age of 18 or above the age of 40; whose gestational age was less than 36 weeks; whose height was less than 150 cm or more than 170 cm; whose body mass index was more than 50 kg/m2; who had an allergy to anesthetic drugs; were in active labor; and who were experiencing fetal macrosomia, pregnancy-induced hypertension, or a contraindication to central neuraxial block.
No premedication or prehydration was administered before induction of spinal anesthesia. After inserting a 16-gauge intravenous cannula in the left forearm, the patency of the cannula was maintained through the titration of lactated Ringer solution at the rate of 10 mL/kg/h. All parturients received routine monitors, including 3-lead electorcardiography, noninvasive blood pressure (BP), and fingertip pulse oximetry. Parturients were placed in the left lateral position, and combined epidural–spinal anesthesia was performed in the L3–4 or L4–5 vertebral interspace after skin infiltration with 1% lidocaine. The epidural space was identified by loss of resistance to 1 mL of air through an 18-gauge epidural needle. Using the needle-through-needle technique, a 27-gauge pencil-point spinal needle was introduced into the dura mater. Next, 2 mL of 0.5% bupivacaine was injected at the rate of 0.1 mL/sec, with the orifice of the spinal needle facing cephalad after verifying the free flow of cerebrospinal fluid (CSF). An epidural catheter was carefully inserted 3.5 to 4.0 cm into the epidural space through the epidural needle by immediately placing the parturients in the supine position with a 15° left lateral table tilt until delivery of the infant. If an inadvertent dural puncture or venous puncture during epidural catheterization occurred and the time interval from spinal injection to placement in the supine position was >3 minutes, the parturient was excluded from the study.
The heart rate and pulse oximetry of the parturients were monitored consistently before the induction of anesthesia and throughout the intraoperative period (0.5 mg of atropine was injected intravenously when the heart rate was <60 bpm, and the flow rate of oxygen was maintained at 4 L/min through a face mask). Before induction of spinal anesthesia, blood pressure (BP) was measured with a noninvasive BP cuff on the right brachial artery. The baseline systolic BP (SBP) was acquired by the average of 3 readings at 2-minute intervals with the parturients lying at a 15° left lateral table tilt without disturbance.
After spinal injection, the SBP and SBL were recorded simultaneously at 1-minute intervals for the 1st 20 minutes and at 5-minute intervals thereafter until the surgery was finished. The SBL and SBP were recorded by 2 investigators, respectively, neither of whom performed the anesthesia procedure. The SBL was assessed along the abdominal midline from T12 toward the cephalad region with an alcohol swab. The surgery was allowed to commence when the SBL reached T6. For top-up of the epidural bolus, 5 mL of 0.75% ropivacaine was administered through an epidural catheter into the epidural space. A maximum of 20 mL was administered when the SBL had not reached T6 15 minutes after injection of the anesthetic.
Hypotension was defined as an SBP of <90 mm Hg or a 30% decrease from the baseline value. Hypotension was treated with 50 μg of intravenous phenylephrine every 1 minute until the hypotension was corrected. In addition, if the parturients were nauseous, the same dose of phenylephrine was administered intravenously regardless of the SBP at that time. During the operation, the patient-derived visual analogue scale (VAS) score for pain was recorded with a 100-mm gauge (based on a 0–100 linear VAS: 0 = no pain, 100 = worst pain imaginable) when the parturient complained of discomfort or pain due to the operative procedure. A 1-mg bolus of butorphanol was administered intravenously if the VAS score was >30 but the SBL was at or above the T6 dermatome, and a 5-mL epidural bolus top-up of 0.75% ropivacaine was given through an epidural catheter to a maximum of 20 mL if the VAS score was >30 and the SBL was below the T6 dermatome. All rescue medications were administered by the anesthetist performing the anesthesia procedure. Finally, the incidence of side effects (such as nausea, vomiting, and shivering) throughout the intraoperative period was recorded by the investigator collecting the hemodynamic parameters.
After delivery of the infant, the surgical nursing staff infused oxytocin according to the uterine tone. The pediatric personnel obtained the Apgar scores at 1 and 5 minutes. A blood sample was taken from a double-clamped segment of the umbilical cord, and blood gas analysis was conducted by the anesthetist performing the anesthesia procedure.
The SBLs after spinal injection and during spinal anesthesia-induced hypotension were recorded, including the maximal sensory block level (maxSBL), the SBL at which hypotension occurred (sensory block level occurring hypotension [hypoSBL]), the time to the maxSBL, and the time to hypotension. Neonatal outcomes including weight, umbilical vein pH, Apgar scores at 1 and 5 minutes, and side effects such as nausea, vomiting, and shivering were also recorded.
After spinal anesthesia, all subjects were divided into a hypotension group (group H) and nonhypotension group (group non-H). The dermatomes T12 to C1 were coded from lowest to highest as 1 to 20. Values are expressed as the mean ± standard deviation, median (interquartile range), or number and analyzed using the unpaired Student t test, Mann–Whitney U test, Wilcoxon signed-ranks test, chi-square test, or Fisher exact test, where appropriate. Continuous data were assessed with the unpaired Student t test, non-normally distributed variables with the Mann–Whitney U test for unpaired data, and the Wilcoxon signed-ranks test for paired data. Categorical data were assessed with the chi-square test or Fisher exact test. A receiver-operating characteristic curve was created to evaluate the accuracy of the spread speed or height of the SBL in predicting the occurrence of hypotension, and an area of 0.5 indicated that the predicted accuracy was equated with random selection. The optimal operating point was identified by the highest combination of sensitivity and specificity and the correctly classified rate. A P value of <.05 was considered statistically significant (2-tailed). Statistical analyses were performed using Stata version 12.0 (StataCorp, College Station, TX) or GraphPad Prism version 5.0 (GraphPad Software Inc., San Diego, CA).
3. Results
In this study, 8 parturients were excluded from the study as a result of the following reasons: 1 experienced unintentional dural puncture; 4 suffered inadvertent venous puncture; 1 failed to collect SBP data due to serious shivering; and 2 were diagnosed with supine hypotensive syndrome before the induction of anesthesia. A total of 132 parturients participated in the study, of 62 experienced hypotension and 70 did not (Fig. 1).
Figure 1.
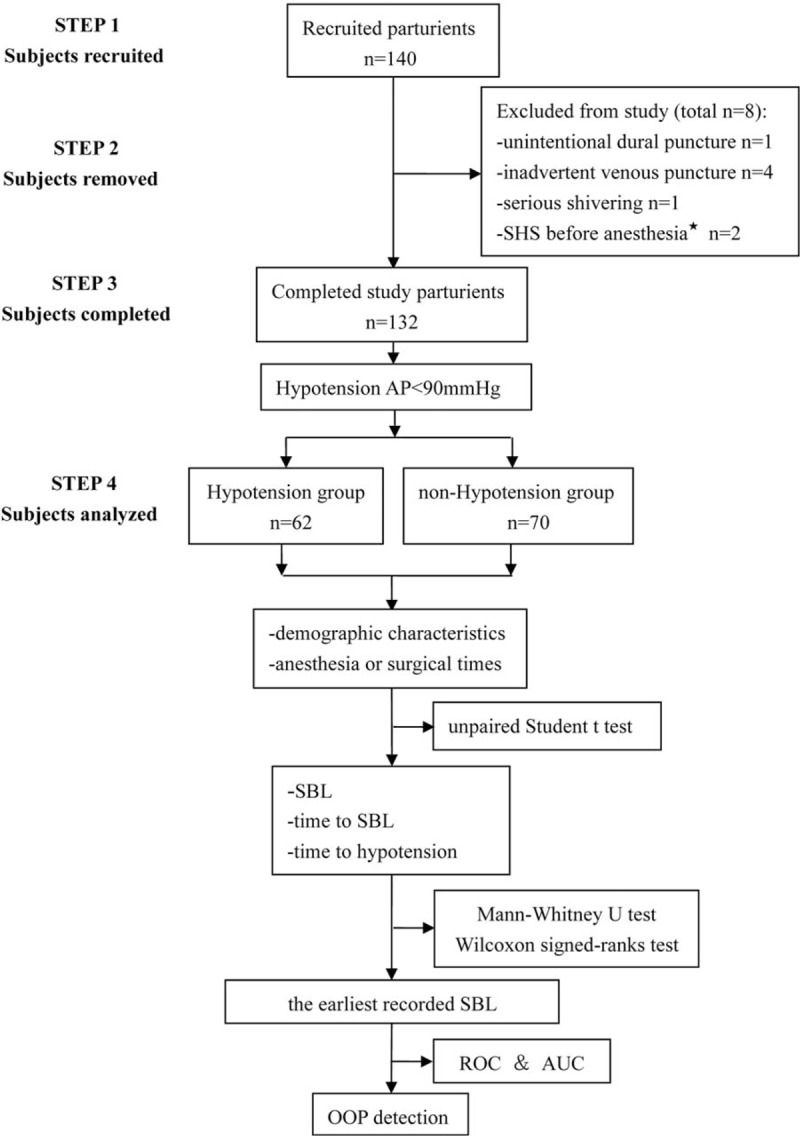
Analysis process of the study subjects. AUC = the area under the curve, ROC = receiver-operating characteristic curve, OOP = optimal operating point, SBL = sensory block level, SHS = supine hypotensive syndrome.
The demographic characteristics and anesthesia and surgical times are shown in Table 1. No significant difference was observed between the 2 groups.
Table 1.
Demographic characteristics and anesthesia or surgical times.
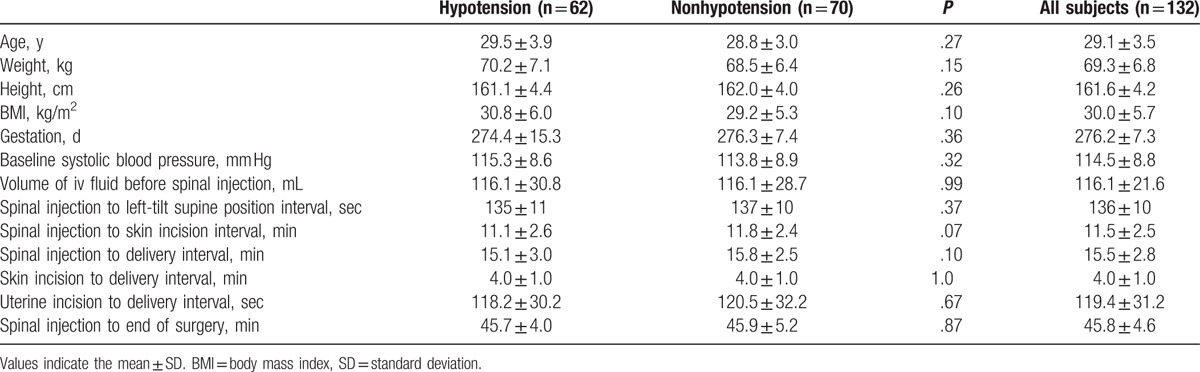
Figure 2 shows the distribution of the SBL. The median maxSBL was higher in group H than in group non-H (T3 vs T4, respectively; P < .0001) (Fig. 2A), the median hypoSBL was lower than the median maxSBL in group H (T4 vs T3, respectively; P < .0001) (Fig. 2B), and the median hypoSBL in group H was similar to the median maxSBL in group non-H (T4 vs T4, respectively; P = .47) (Fig. 2C).
Figure 2.
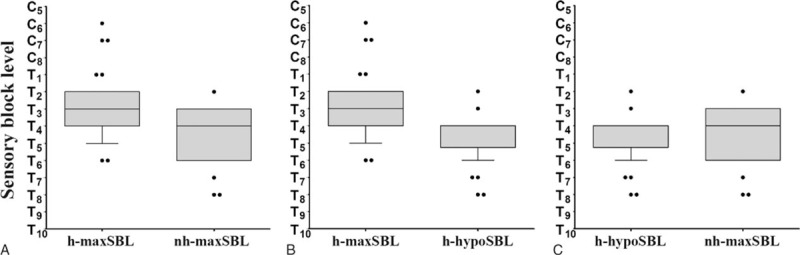
Ascending range of sensory block level after spinal anesthesia. Box plots display the 25th, 50th, and 75th percentiles as horizontal lines on a bar, whiskers above and below the box indicated the 90th and 10th percentiles, and data beyond the 10th and 90th percentiles are showed as individual points.
Figure 3 shows that the median time to maxSBL in group non-H was longer than that in group H (10.5 vs 9.0 minutes, respectively; P < .001) (Fig. 3A), the median time to maxSBL in group non-H was longer than the median time to hypoSBL in group H (10.5 vs 6.0 minutes, respectively; P < .0001) (Fig. 3B), and the median time to maxSBL was longer than the median time to hypoSBL in group H (9 vs 6 minutes, respectively; P < .0001) (Fig. 3C).
Figure 3.
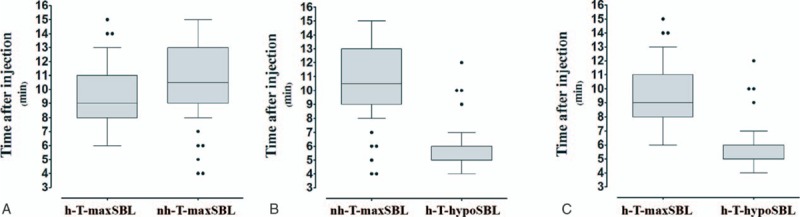
Time to sensory block level or hypotension. Box plots display the 25th, 50th, and 75th percentiles as horizontal lines on a bar, whiskers above and below the box indicated the 90th and 10th percentiles, and data beyond the 10th and 90th percentiles are showed as individual points.
The mean time interval from spinal injection to placement in the supine position was 136 ± 10 seconds in all anesthesia procedures (Table 1). Because the SBL was measured every 1 minute after spinal injection, the earliest record of the SBL began at the 3rd minute after spinal injection.
Compared with the predictive accuracy of the occurrence of hypotension with maxSBL (area under the receiver-operating characteristic curve [AUC] = 0.77), a stronger power was acquired with an ascending SBL at the 3rd minute after spinal injection (3rdminSBL) (AUC = 0.86, P = .02). The optimal operating point was T8 because it showed the highest combination of sensitivity and specificity (sensitivity = 0.82, specificity = 0.88, and correctly classified rate = 0.86) (Fig. 4).
Figure 4.
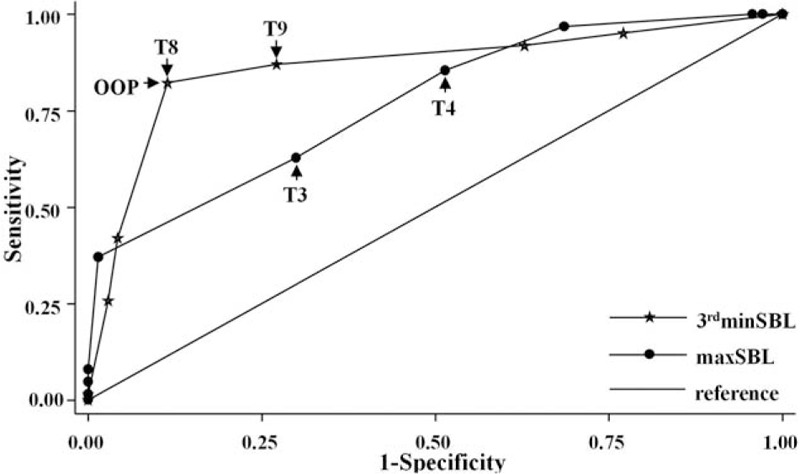
Receiver-operating characteristic curves (ROCs) for 3rdminSBL and maxSBL. 3rdminSBL = sensory block level at the 3rd minute after spinal injection, maxSBL = maximal sensory block level.
A higher frequency of nausea was found in group H than in group non-H, but no significant difference in the incidence of shivering was observed between the 2 groups. No parturients experienced vomiting. The incidence of receiving intravenous butorphanol after delivery of the infant and receiving an epidural bolus top-up was similar between the 2 groups (Table 2).
Table 2.
Maternal side effects and neonatal outcomes.
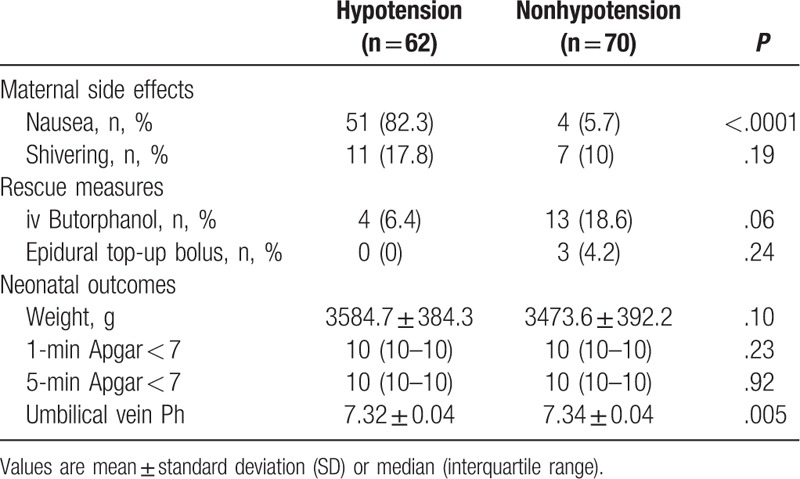
A higher umbilical vein pH was found in group non-H than in group H (7.34 ± 0.04 vs 7.32 ± 0.04, respectively; P = .005). Similar outcomes for neonatal weight and the Apgar scores were found between the 2 groups (Table 2).
4. Discussion
The findings of this study demonstrate that the SBL ascension rate is a predictor of hypotension in parturients receiving combined epidural–spinal anesthesia. With high sensitivity (0.82) and specificity (0.88), an SBL of ≥T8 at the 3rd minute after spinal injection was beneficial in bridging the gap of predicting the occurrence of hypotension and the ascending SBL.
In this study, parturients who developed hypotension had a higher SBL, supporting the theory that a higher block level is associated with a higher incidence of hypotension.[7–9] However, the time to hypotension was shorter than the time to the maxSBL (median, 6 vs 9 minutes, respectively), and the hypoSBL was lower than the maxSBL (median, T4 vs T3, respectively); these findings are similar to those by Sudha et al.[10] The time to hypotension was earlier than the time to the maxSBL, indicating that the role of the maxSBL in the occurrence of hypotension was explanation but no prediction.
Actually, using only the SBL to explain the occurrence of spinal anesthesia-induced hypotension is inadequate. In 2001, Seltenrich et al[11] reported that if a similar SBL resulted in a difference in the incidence of hypotension, it was because of a slower-onset sympathetic block allows more time for physiologic compensation. A similar phenomenon was shown in this study. When the SBL reached T4, hypotension occurred in group H but not in group non-H; this was because of the longer time to T4 in group non-H than in group H (10.5 vs 6.0 minutes, respectively). Therefore, the SBL ascension rate is as important as the height of the SBL in the occurrence of hypotension.
Many factors are likely to affect the spread of the SBL, but variability in the lumbosacral CSF volume is the most important factor contributing to the variability in the spread of the spinal sensory anesthesia level.[12] Onuki et al[13] showed that the CSF volume ranged from approximately 25 to 45 mL in 18 pregnant women. Therefore, the range of spread of the SBL after injection of local anesthetics into the CSF is unpredictable. In the present study, we hypothesized that the SBL ascension rate may serve as an indicator of the trend of the SBL spread after spinal anesthesia.
Coppejans et al[14] reported that the mean time interval from injection of an anesthetic to placement in the supine position was 129 seconds in the lateral position as a result of the extra time required to place and secure the epidural catheter. These mean times were 125, 132, and 125 seconds, respectively, in 3 groups of the study by Hallworth et al.[15] In the present study, we detected a slightly prolonged duration from spinal injection to placement in the supine position; the mean interval time was 136 seconds in all anesthesia procedures. However, we believe that this is reasonable in clinical practice. In this study, the SBL was measured every 1 minute after spinal injection; therefore, the earliest record started from the 3rd minute after spinal injection.
In this study, a receiver-operating characteristic curve was created to evaluate the predictive accuracy of hypotension according to the SBL at 3rdminSBL or the maxSBL. Acting as the measure of accuracy, the AUC of 3rdminSBL was 0.86, indicating considerable discriminative power for the occurrence of hypotension. Meanwhile, taking both sensitivity (0.82) and specificity (0.88) into consideration, we found that a 3rdminSBL of ≥T8 was the optimal operating point at which to predict the occurrence of hypotension with a correctly classified rate of 0.86. Although the AUC of the maxSBL (0.77) was considered a sign of moderate power, we suggest that the maxSBL should be used as a retrospective index because of the unpredictable spread range of the SBL and the fact that the time to maxSBL lags behind the time to hypotension. A 3rdminSBL of ≥T8 should be the predictive index for the occurrence of hypotension.
A higher incidence of nausea was observed in parturients who developed hypotension, which was likely associated with hypotension after spinal injection. Maternal BP close to baseline level which can maintain the umbilical vein pH higher than parturients experiencing hypotension, similar results appeared in our trial.[16] However, both umbilical vein pH values were within the normal range, which can explain why no Apgar score was <7 at 1 or 5 minutes in our study. Another potential reason is that a healthy fetus has good tolerance when hypotension lasts <4 minutes.[17]
This study was subject to several limitations. First, this study was performed using noninvasive arterial BP monitoring. Considering the marked changes in hemodynamics that occur after spinal anesthesia, a timely and accurate outcome can be acquired by invasive arterial BP monitoring. However, we believe that the results of our study also provide clinical guidance because noninvasive arterial BP measurement is a routine monitoring technique. Second, the CSF volume was not measured with magnetic resonance imaging in the current study. Therefore, whether the unpredictable SBL ascension range was influenced by the variability in the CSF volume remains unclear.
In summary, because of the unpredictable SBL ascension range, the ascension rate is more suitable for the prediction of hypotension. After placement in the left lateral position, combined epidural–spinal anesthesia was performed on parturients undergoing caesarean section using the following procedure: no volume preloading, injection site of L3–4 or L4–5, injection rate of 0.1 mL/sec, and administration of 10 mg of 0.5% hyperbaric bupivacaine. Based on our findings, the ascension rate of an SBL of ≥T8 at the 3rd minute after spinal injection is recommended as a predictor of hypotension in parturients.
Footnotes
Abbreviations: CSF = cerebrospinal fluid, hypoSBL = sensory block level occurring hypotension, maxSBL = maximal sensory block level, 3rdminSBL = sensory block level at the 3rd minute after spinal injection, SBL = sensory block level.
NZ and LH contributed equally and should be co-first authors to this work.
The authors have no funding and conflicts of interest to disclose.
References
- [1].Smith WL. Anaesthesia for caesarean section. J Natl Med Assoc 1960;52:125–7. [PMC free article] [PubMed] [Google Scholar]
- [2].Datta S, Alper MH. Anaesthesia for cesarean section. Anesthesiology 1980;53:142–60. [DOI] [PubMed] [Google Scholar]
- [3].Chumpathong S, Chinachoti T, Visalyaputra S, et al. Incidence and risk factors of hypotension during spinal anaesthesia for cesarean section at Siriraj Hospital. J Med Assoc Thai 2006;89:1127–32. [PubMed] [Google Scholar]
- [4].Ohpasanon P, Chinachoti T, Sriswasdi P, et al. Prospective study of hypotension after spinal anaesthesia for cesarean section at Siriraj Hospital: incidence and risk factors, part 2. J Med Assoc Thai 2008;91:675–80. [PubMed] [Google Scholar]
- [5].Kyokong O, Charuluxananan S, Sriprajittichai P, et al. The incidence and risk factors of hypotension and bradycardia associated with spinal anaesthesia. J Med Assoc Thai 2006;89suppl 3:s58–64. [PubMed] [Google Scholar]
- [6].Somboonviboon W, Kyokong O, Charuluxananan S, et al. Incidence and risk factors of hypotension and bradycardia after spinal anaesthesia for cesarean section. J Med Assoc Thai 2008;91:181–7. [PubMed] [Google Scholar]
- [7].Yorozu T, Morisaki H, Kondoh M, et al. Comparative effect of 6% hydroxyethyl starch (containing 1% dextrose) and lactated Ringer's solution for cesarean section under spinal anaesthesia. J Anesth 2002;16:203–6. [DOI] [PubMed] [Google Scholar]
- [8].Hallworth SP, Fernando R, Columb MO, et al. The effect of posture and baricity on the spread of intrathecal bupivacaine for elective cesarean delivery. Anesth Analg 2005;100:1159–65. [DOI] [PubMed] [Google Scholar]
- [9].Coppejans HC, Hendrickx E, Goossens J, et al. The sitting versus right lateral position during combined spinal-epidural anaesthesia for cesarean delivery: block characteristics and severity of hypotension. Anesth Analg 2006;102:243–7. [DOI] [PubMed] [Google Scholar]
- [10].Singh SI, Morley-Forster PK, Shamasah M, et al. Influence of injection rate of hyperbaric bupivacaine on spinal block in parturientss: a randomized trial. Can J Anaesth 2007;54:594. [DOI] [PubMed] [Google Scholar]
- [11].Yorozu T, Morisaki H, Kondoh M, et al. Comparative effect of 6% hydroxyethyl starch (containing 1% dextrose) and lactated Ringer's solution for cesarean section under spinal anaesthesia. J Anesth 2002;16:203–6. [DOI] [PubMed] [Google Scholar]
- [12].Carpenter RL, Hogan QH, Liu SS, et al. Lumbosacral cerebrospinal fluid volume is the primary determinant of sensory block extent and duration during spinal anaesthesia. Anesthesiology 1998;89:24–9. [DOI] [PubMed] [Google Scholar]
- [13].Onuki E, Higuchi H, Takagi S, et al. Gestation-related reduction in lumbar cerebrospinal fluid volume and dural sac surface area. Anesth Analg 2010;110:148–53. [DOI] [PubMed] [Google Scholar]
- [14].Coppejans HC, Hendrickx E, Goossens J, et al. The sitting versus right lateral position during combined spinal-epidural anaesthesia for cesarean delivery: block characteristics and severity of hypotension. Anesth Analg 2006;102:243–7. [DOI] [PubMed] [Google Scholar]
- [15].Hallworth SP, Fernando R, Columb MO, et al. The effect of posture and baricity on the spread of intrathecal bupivacaine for elective cesarean delivery. Anesth Analg 2005;100:1159–65. [DOI] [PubMed] [Google Scholar]
- [16].Datta S, Alper MH, Ostheimer GW, et al. Method of ephedrine administration and nausea and hypotension during spinal anaesthesia for cesarean section. Anesthesiology 1982;56:68–70. [DOI] [PubMed] [Google Scholar]
- [17].Ebner H, Barcohana J, Bartoshuk AK. Influence of postspinal hypotension on the fetal electrocardiogram. Am J Obstet Gynecol 1960;80:569–72. [DOI] [PubMed] [Google Scholar]