

Abstract
Purpose
To compare quantitative fractional ventilation measurements from multiple breath washout imaging (MBW‐I) using hyperpolarized 3He with both spoiled gradient echo (SPGR) and balanced steady‐state free precession (bSSFP) three‐dimensional (3D) pulse sequences and to evaluate the feasibility of MBW‐I with hyperpolarized 129Xe.
Methods
Seven healthy subjects were scanned using 3He MBW‐I with 3D SPGR and bSSFP sequences. Five also underwent MBW‐I with 129Xe. A dual‐tuned coil was used to acquire MBW‐I data from both nuclei in the same subject position, enabling direct comparison of regional information.
Results
High‐quality MBW images were obtained with bSSFP sequences using a reduced dose (100 mL) of inhaled hyperpolarized 3He. 3D MBW‐I with 129Xe was also successfully demonstrated with a bSSFP sequence. Regional quantitative ventilation measures derived from 3He and 129Xe MBW‐I correlated well in all subjects (P < 0.001) with mean Pearson's correlation coefficients of r = 0.61 and r = 0.52 for 3He SPGR‐bSSFP and 129Xe‐3He (bSSFP) comparisons. The average intersubject mean difference (and standard deviation) in fractional ventilation in SPGR‐bSSFP and 129Xe‐3He comparisons was 15% (28%) and 9% (38%), respectively.
Conclusions
Improved sensitivity in MBW‐I can be achieved with polarization‐efficient bSSFP sequences. Same scan‐session 3D MBW‐I with 3He and 129Xe has been demonstrated using a dual‐tuned coil. Magn Reson Med 77:2288–2295, 2017. © 2016 The Authors Magnetic Resonance in Medicine published by Wiley Periodicals, Inc. on behalf of International Society for Magnetic Resonance in Medicine. This is an open access article under the terms of the Creative Commons Attribution License, which permits use, distribution and reproduction in any medium, provided the original work is properly cited.
Keywords: hyperpolarized gas, 129Xe, 3He, multiple breath washout, lung function
INTRODUCTION
Pulmonary function testing based on dynamic monitoring of exhaled tracer gases is becoming increasingly used in a clinical setting to monitor lung ventilation heterogeneity 1. Multiple breath washout (MBW) monitors the decay in concentration of resident N2 or washed‐in SF6 tracer gas at the mouth while subjects breathe oxygen or air over a period of several minutes. MBW is a sensitive marker of functional changes in the small airways (<2 mm), and obstructive lung disease is typically reflected in prolonged washout of tracer gas from the lungs. MBW‐derived parameters of ventilation heterogeneity have been shown to be more sensitive to early disease than flow‐dependent measures from spirometry in cystic fibrosis (CF) patients 2, 3 was found to be a sensitive marker of obstructive lung disease 4, 5, 6. Multiple theoretical approaches have been developed in attempts to derive regional information about different compartments of the lung from whole‐lung MBW signals [e.g., 7], but these are not capable of providing definitive regional quantitative information about lung ventilation.
MRI of hyperpolarized 3He and 129Xe gases offers unique insight into pulmonary ventilation and physiology 8, 9, 10. Various approaches have been proposed to quantify lung ventilation from imaging as a single number summarizing the total ventilated volume in the thorax—for example, percent ventilated volume 11 or by clustering ventilation into functional compartments 12. However, the major disadvantage of these methods is the sacrifice of regional information. An alternative approach is to directly convert image intensity from single‐breath ventilation‐weighted images into regional volume fraction with knowledge of the inhaled gas volume 13. Nevertheless, the quantitative interpretation of lung ventilation by this method is affected by spatial variations in the transmit/receive B1 field of the radiofrequency (RF) coil, T1 decay, and weighting of the signal by RF depolarization.
Dynamic imaging of gas wash‐in over multiple breaths of hyperpolarized 3He MRI was demonstrated as a quantitative method for measuring regional ventilation in guinea pig lungs 14. This method was subsequently improved and shown to be feasible for use in larger species, including humans 15, 16. Additionally, in humans, continuous spectroscopic acquisition during MBW has been demonstrated using residual 3He gas in the lungs after ventilation imaging 17. This methodology was recently extended to an MBW‐I technique capable of producing quantitative ventilation maps covering the whole of the lungs 18.
Quantitative methods use either MR signal build up (gas wash‐in) or decay (wash‐out) to derive the fractional ventilation (fraction of gas volume turned over in each breath) from the amount of signal change in each voxel. These methods compensate for the effects of hyperpolarized gas T1 decay, RF depolarization, and RF coil sensitivity and thus can provide fully quantitative measures of regional lung ventilation.
Previously, MBW‐I has been implemented using fast low flip angle spoiled gradient echo (SPGR) sequences with a single dose of hyperpolarized 3He 18. However, the scarcity and current high cost of 3He necessitates the use of reduced gas doses or a different gas isotope. This work evaluates three‐dimensional (3D) MBW‐I with balanced steady‐state free precession (bSSFP) sequences in order to maximize the use of the finite available polarization. Here, quantitative ventilation information derived from bSSFP sequences (with a 50% reduction in 3He gas dose) is validated against previously presented SPGR methods. 3D MBW‐I with hyperpolarized 129Xe has been challenging because of its approximately three‐fold lower Larmor frequency when compared with 3He. Recent advances in polarizer technology 19, 20 and optimized bSSFP imaging 21 have facilitated high‐quality ventilation imaging with 129Xe 22. Here, these gains in polarization and signal efficiency from bSSFP sequences are also exploited to demonstrate 3D MBW‐I with hyperpolarized 129Xe.
METHODS
Subjects
Seven healthy subjects between the ages of 24 and 38 years and with an FEV1 in the range of 82%–126% predicted (Table 1) were scanned under written informed consent and agreement of the National Research Ethics Service (United Kingdom).
Table 1.
Subject Demographics and Study Results.
| Subject | Sex | Age, y | Weight, kg | FEV1, %preda | Study 1 Sequence | SNRd | Fractional Ventilation, r, Mean ± SD | Tidal Volume, mL | Global Turnovere | Images Used to Fit Fractional Ventilation | Voxel‐by‐voxel Correlation Coefficient[Link] | Bland–Altman Analysis, MD (SD) in % | Study 2 Imaging Nucleus | SNRd | Fractional Ventilation, r, Mean ± SD | Tidal Volume, mL | Global Turnover | Images Used to Fit Fractional Ventilation | Voxel‐by‐voxel Correlation Coefficient | Bland–Altman Analysis[Link], MD(SD) in % |
|---|---|---|---|---|---|---|---|---|---|---|---|---|---|---|---|---|---|---|---|---|
| 1 | F | 32 | 61 | 116 | SPGR | 186 | 0.28 ± 0.09 | 627 | 0.22 | 4 | 0.58 | 30.1 (38) | 129Xe | 116 | 0.30 ± 0.08 | 740 | 0.30 | 3 | 0.59 | 38 (34) |
| bSSFP | 446 | 0.24 ± 0.11 | 602 | 0.21 | 4 | 3He | 191 | 0.20 ± 0.07 | 450 | 0.19 | 4 | |||||||||
| 2 | M | 24 | 77 | 108 | SPGR | 48 | 0.33 ± 0.10 | 915 | 0.25 | 3 | 0.62 | 21.7 (27) | 129Xe | 48 | 0.35 ± 0.09 | 1110 | 0.31 | 4 | 0.46 | 25 (26) |
| bSSFPb | 27 | 0.28 ± 0.11 | 1103 | 0.26 | 3 | 3He | 163 | 0.26 ± 0.07 | 920 | 0.27 | 3 | |||||||||
| 3 | M | 30 | 75 | 82 | SPGR | 96 | 0.25 ± 0.09 | 919 | 0.18 | 5 | 0.68 | 2.6 (23) | 129Xe | 102 | 0.30 ± 0.08 | 1150 | 0.27 | 3 | 0.81 | 2 (18) |
| bSSFP | 233 | 0.21 ± 0.08 | 937 | 0.21 | 5 | 3He | 114 | 0.26 ± 0.07 | 980 | 0.28 | 4 | |||||||||
| 4 | M | 28 | 84 | 108 | SPGR | 147 | 0.22 ± 0.07 | 826 | 0.21 | 3 | 0.73 | 3.9 (23) | 129Xe | 121 | 0.24 ± 0.08 | 830 | 0.22 | 4 | 0.45 | 69 (45) |
| bSSFP | 240 | 0.22 ± 0.08 | 937 | 0.19 | 4 | 3He | 178 | 0.11 ± 0.05 | 620 | 0.18 | 4 | |||||||||
| 5 | M | 28 | 79 | 108 | SPGR | 53 | 0.19 ± 0.09 | 589 | 0.11 | 4 | 0.40 | 28.7 (42) | 129Xe | 39 | 0.19 ± 0.08 | 685 | 0.14 | 3 | 0.28 | 12 (69) |
| bSSFP | 196 | 0.12 ± 0.06 | 523 | 0.13 | 5 | 3He | 145 | 0.18 ± 0.07 | 500 | 0.15 | 4 | |||||||||
| 6 | F | 38 | 80 | 126 | SPGR | 82 | 0.47 ± 0.08 | 1206 | 0.35 | 3 | 0.56 | 7.6 (19) | — | — | — | — | — | — | — | — |
| bSSFPc | 202 | 0.47 ± 0.07 | 1265 | 0.34 | 4 | |||||||||||||||
| 7 | M | 28 | 75 | 98 | SPGR | 60 | 0.24 ± 0.08 | 1132 | 0.22 | 3 | 0.67 | 11.6 (21) | — | — | — | — | — | — | — | — |
| bSSFPc | 82 | 0.26 ± 0.07 | 1048 | 0.23 | 4 |
Values were calculated according to Quanjer et al. 34.
For 3He bSSFP acquisition, twice the in‐plane resolution and a gas dose of 200 mL 3He were used.
bSSFP imaging was performed using a flip angle of 7° with 200 mL 3He.
SNR = signal to noise ratio (standard deviation of noise divided by mean signal from the lungs) of the first image acquired during MBW‐I.
Global fractional ventilation derived from the ratio of mean tidal volume (measured by pneumotachograph) to mean inspiratory lung volume (calculated from images).
MD = mean difference (expressed as the coefficient of variation) and SD = standard deviation (expressed in percent).
Pearson's correlation coefficient (P < 0.001 in all cases).
This study was divided into two parts. In study 1, all seven subjects underwent 3He MBW‐I with 3D SPGR and bSSFP sequences. In study 2, five of the seven subjects also underwent 3He and 129Xe MBW‐I using 3D bSSFP sequences to compare results with the two inert gas isotopes.
Hardware
All MRI examinations were performed on a GE Signa HDx 1.5T scanner (GE Healthcare, Milwaukee, Wisconsin, USA). 3He was polarized to approximately 25% using a commercial spin‐exchange optical pumping polarizer (GE Healthcare, Amersham, United Kingdom). 129Xe (comprising approximately 86% of the xenon mixture) was polarized to approximately 25% using a custom‐built spin‐exchange optical pumping polarizer 19. For study 1, a flexible transmit/receive vest coil (CMRS, Brookfield, Wisconsin, USA) tuned to the 3He Larmor frequency (48.62 MHz) was used. For study 2, a custom‐built flexible dual‐tuned transmit‐receive coil tuned to both 3He and 129Xe Larmor frequencies (48.62 and 17.65 MHz) 23 was used, allowing a direct comparison of quantitative ventilation maps from the two nuclei without the need for position changes between scans or image registration techniques. During MBW‐I, gas flow at the mouth was recorded using a RSS 100HR pneumotachograph (Hans Rudolph, Shawnee, Kansas, USA).
Imaging
Parameters for the 3D MBW‐I sequences for studies 1 and 2 are summarized in Table 2. Hyperpolarized gas doses were topped up to 1 L with N2 and inhaled from functional residual capacity 18. Flip angles were considerably lower than the optimum value for a single‐breath‐hold 3D bSSFP static ventilation imaging sequence at the chosen resolution (flip angle ≈ 22°), because washout is monitored over multiple breaths and therefore some longitudinal magnetization must be preserved. For study 1, two thirds of the optimum flip angle was chosen (flip angle = 14°) for bSSFP imaging, and for study 2, a higher gas dose and one third of the optimum flip angle (flip angle = 7°) was used for both 3He and 129Xe (Table 2).
Table 2.
MBW‐I Parameters for Study 1 and Study 2.
| Parameter | Study 1 | Study 2 | ||
|---|---|---|---|---|
| SPGR (3He) | bSSFP (3He) | bSSFP (3He) | bSSFP (129Xe) | |
| Pulse repetition time, ms | 2.5 | 1.6 | 1.4 | 2.9 |
| Echo time, ms | 0.75 | 0.6 | 0.4 | 0.9 |
| Field of view, cm | 38 × 30.4 | 38 × 30.4 | 38 × 30.4 | 38 × 30.4 |
| Acquisition matrix, mm | 32 × 26 × 26 | 32 × 26 × 26 | 32 × 26 × 26 | 32 × 26 × 26 |
| Voxel size, mm | 12 × 12 × 10 | 12 × 12 × 10 | 12 × 12 × 10 | 12 × 12 × 10 |
| Scan time, s | 1.7 | 1.1a | 0.9 | 2.0 |
| Slice thickness, mm | 10 | 10 | 10 | 10 |
| Bandwidth, kHz | 32.3 | 166 | 166 | 16.1 |
| Flip angle | 1° | 14° | 7° | 7° |
| RF pulse envelope | Gaussian | Gaussian | Hard pulse | Hard pulse |
| Pulse width, μS | 500 | 500 | 200 | 200 |
| Dose of hyperpolarized gas, mL | 200 | 100a | 200 | 600 |
In subject 2 3He bSSFP imaging was performed using 200 mL of hyperpolarized 3He to demonstrate the feasibility of acquiring images with double the in‐plane resolution (64 × 51 × 26), resulting in a voxel size of 6 × 6 × 10 mm and an acquisition time of 2.1 s.
MBW‐I Protocol
MBW‐I breathing maneuvers and postprocessing of images was performed as described in detail 18. Briefly, the main components of the MBW‐I protocol were as follows. First, subjects were trained in the required breathing procedures both outside and inside the scanner before hyperpolarized gas imaging. Subjects inhaled a single dose of hyperpolarized gas from functional residual capacity. Upon inhalation, two sets of volumetric images were acquired during breath‐hold and the signal decay between corresponding images was analyzed to calculate a correction factor for compensation of non–washout‐related signal decay, including T1 decay and RF depolarization. Following the second acquisition, subjects began relaxed tidal breathing, interrupted by short breath‐holds for image acquisitions after each breathing cycle. All images were acquired with a fixed delay time of 4 s to allow one breathing cycle between acquisitions. Major airways were excluded from all calculations because a fractional ventilation r = 1 can be expected and no signal is received from the airways after the first volume turnover. Pneumotachograph recordings were used to exclude data when a tidal volume change of more than ±15% occurred.
Example washout data from a single slice for all subprotocols are shown in Figure 1. A typical time‐volume curve acquired with the flow meter during the protocol is shown in Figure 1. The resulting signal decay over all acquisitions was corrected for RF and T1 depolarization and fitted with an exponential least‐squares function to obtain gas turnover (fractional ventilation) on a voxel‐by‐voxel basis, as shown in Figure 1.
Figure 1.
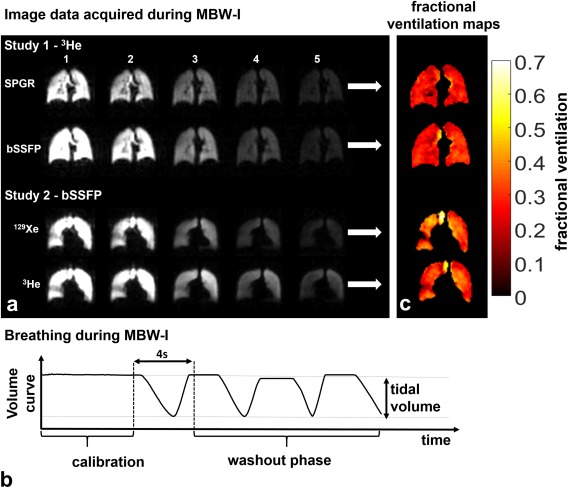
Representative results from MBW‐I. Comparison of 3He MBW‐I with SPGR with bSSFP sequences (subject 4) and comparison of 129Xe and 3He bSSFP MBW‐I (subject 3). Schematic lung volume curve during MBW‐I as derived from flow recordings at the mouth. Fractional ventilation maps of the slices shown in panel A. For all acquisitions, the time delay between images was fixed to 4 s to allow subjects to comfortably complete one breathing cycle.
Comparison
For both, subjects were not moved between imaging experiments, hence a voxel‐by‐voxel comparison of derived fractional ventilation maps could be performed without the need for image registration. We acknowledge that the lungs themselves do move, but the controlled breathing maneuver allows for a basic pixel‐wise comparison without image registration; to do so, fractional ventilation maps were masked with the intersection of the two maps. Pearson's r coefficient was calculated for the correlation between the two experiments, and Bland–Altman analysis was performed to determine the intrasubject mean difference and standard deviation as a percentage of the mean.
RESULTS
The results of this study are summarized in Table 1.
Study 1: 3He MBW‐I, SPGR Versus bSSFP
MBW‐I with 3He using both SPGR and bSSFP sequences was performed successfully in all seven subjects, and image quality was sufficient to generate fractional ventilation maps. 3He MBW images acquired from subject 4 with SPGR and bSSFP sequences are shown in Figure 1, alongside resulting fractional ventilation maps of the corresponding slices (Fig. 1). Similar values of fractional ventilation were found and good visual agreement of ventilation features was observed when comparing fractional ventilation maps derived from the two imaging sequences (Fig. 2). An average Pearson's correlation coefficient over all subjects of r = 0.61 (all P < 0.001) was determined. The mean intersubject difference (coefficient of variation) was found to be 15.2%, with a standard deviation of 27.6%.
Figure 2.
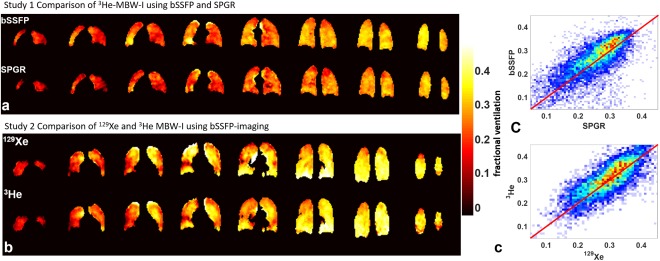
(A, B) Comparative fractional ventilation maps from 3He MBW‐I using bSSFP and SPGR sequences (subject 6) (A) and from 129Xe and 3He MBW‐I using bSSFP sequences (subject 3) (B). (C) Voxel‐by‐voxel correlation plots of the datasets in panel A (top, r = 0.56) and panel B (bottom, r = 0.81). The solid red line indicates the line of unity, and the color map represents the density of points, with blue <10 and red >30.
To demonstrate the signal benefits associated with bSSFP sequences, an additional 3He MBW‐I dataset was acquired using a bSSFP sequence with a two‐fold increased spatial resolution (64 × 51 in‐plane, subject 2). The results of this scan are presented against a lower resolution SPGR scan for that subject in Figure 3. Fractional ventilation maps derived from images acquired at the two different resolutions showed similar features. Maps derived from the higher resolution scan appeared qualitatively slightly noisier than the lower resolution SPGR images; however, a significant Pearson's correlation of r = 0.62 (P < 0.001) was determined from a voxel‐by‐voxel comparison (after zero‐filling SPGR images to mimic the resolution of the bSSFP images).
Figure 3.
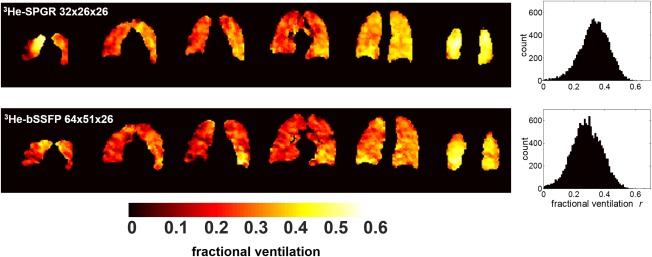
Comparison of fractional ventilation maps derived from subject 2 using low‐resolution SPGR and high‐resolution bSSFP imaging sequences with hyperpolarized 3He. The k‐space of the SPGR acquisition was zero‐filled before reconstruction to mimic the resolution of the bSSFP images. Fractional ventilation maps from selected slices (anterior to posterior) are shown, along with whole‐lung fractional ventilation histograms. Slight differences in the intensity of the maps from each acquisition result from using the same color map in both cases. Different average fractional ventilation values were obtained (SPGR average [standard deviation] r = 0.33 [0.10], bSSFP average [standard deviation] r = 0.28 [0.11]); see also the shift in peak position of the histograms.
Study 2: MBW‐I with 129Xe
bSSFP MBW‐I with 129Xe was successfully performed in all investigated subjects and image quality was sufficient to derive quantitative fractional ventilation maps (mean values summarized in Table 1). Figure 1 shows raw images from 129Xe and 3He MBW‐I in subject 3, with corresponding fractional ventilation maps depicted in Figure 1. 3He and 129Xe fractional ventilation maps from slices covering the whole of the lungs are shown in Figure 2. Comparable values of fractional ventilation were obtained, with a trend of slightly increased r values for 129Xe, and good qualitative, visual agreement of features was observed when comparing 3He and 129Xe MBW‐I data, as illustrated in Figure 2 and the corresponding correlation plot in Figure 2. An average Pearson's correlation coefficient of r = 0.52 (with P < 0.001 in each individual case) was calculated. Bland–Altman analysis resulted in a mean intersubject difference (coefficient of variation) of 9.2% (biased towards larger values for 129Xe) with a corresponding intersubject standard deviation of 38.4%.
To validate MBW‐I, mean fractional ventilation was compared with the global lung volume turnover calculated from measurement of the tidal volume at the mouth and extraction of the lung volume from image segmentation. In both study 1 and study 2, a highly significant correlation of both independent measures was found with a mean Pearson's coefficient of r = 0.93 (P < 0.001) and r = 0.81 (P < 0.01), respectively.
DISCUSSION
Study 1: 3He MBW‐I, SPGR Versus bSSFP
The comparison of fractional ventilation values derived from 3He MBW‐I with SPGR and bSSFP sequences showed good agreement between sequences in all subjects. Considering the scarcity and expense of 3He, bSSFP MBW‐I presents a potentially more economically viable alternative to SPGR MBW‐I, requiring a 50% lower 3He gas dosage for images and fractional ventilation maps of comparable quality at the same spatial resolution. In addition, the 10% 3He: 90% N2 mix used for bSSFP scans better approximates air in the lungs in terms of density and diffusion coefficient 24. The feasibility of acquiring images with double the in‐plane resolution and the same gas dosage with the bSSFP sequence when compared with the SPGR sequence was also demonstrated in one subject. The lower resolution SPGR images in Figure 3 appear smoother than the higher resolution bSSFP images, which might be explained by the zero‐filling of SPGR data required to mimic equivalent resolutions (3). Nevertheless, the good voxel‐by‐voxel correlation between fractional ventilation data at both resolutions suggests that a voxel size of approximately 1 cm3 is sufficient to fulfill a major assumption of the washout model; that is, that ventilation is homogeneous within an image voxel. This assumption may hold in healthy subjects, but in patients with inhomogeneous ventilation (e.g., asthma), where ventilation heterogeneity begins in the small airways and can result in a patchy appearance on 3He ventilation images 25, it may be less applicable 26. Thus, an increase in spatial resolution of MBW‐I data should provide greater insight into the characteristic length scales of ventilation heterogeneity.
Study 2: MBW‐I with 129Xe
3D MBW‐I with 129Xe has been demonstrated for the first time, made feasible by recent improvements in 129Xe polarization levels, and the efficient use of induced polarization afforded by bSSFP sequences. By comparison, in our previous preliminary work with SPGR sequences and lower 129Xe polarizations, image signal‐to‐noise ratio (SNR) was insufficient for multiple 3D acquisitions required for 129Xe MBW‐I 27. Here, comparable functional information was derived from MBW‐I datasets from both 3He and 129Xe nuclei, with similar ventilation heterogeneity observed. The voxel‐by‐voxel correlation of regional 3He and 129Xe fractional ventilation values resulted in a slightly lower average Pearson's correlation coefficient (r = 0.52, P < 0.001 in all cases) compared with the correlation between SPGR and bSSFP sequences for 3He. Only in subject 5 was the correlation coefficient noticeably lower than in other subjects. In addition, subject 5 was a former smoker, and some effects of lung obstruction were observed similar to subject 3 (Fig. 1A, study 2). It has been reported previously that xenon has a reduced ability to penetrate less ventilated airspaces when compared with helium 28, and therefore this might be expected to affect the measured fractional ventilation data. Additionally, xenon is a much denser (ρHe‐N2 = 1.143 kg/m3, ρXe‐N2 = 3.957 kg/m3) and less diffusive gas (DHe‐N2 = 0.85 cm2/s, DXe‐N2 = 0.10 cm2/s) 29, 30 than helium. In the case of 129Xe MBW‐I, the tracer gas itself comprises approximately 15% of the inspired lung volume, compared with approximately 2.5% for the 3He gas mix. The fact that 129Xe was mixed with nitrogen and not a lighter gas (such as 4He) to better approximate the physical properties of air is a limitation of this study. Nevertheless, the general absence of airway obstruction in the healthy subjects scanned in this study means this is expected to have a limited impact on the data presented here. Xenon signal loss by diffusive uptake into the blood and tissue was not considered when calculating fractional ventilation; it was assumed that the dissolved fraction (approximately 2%) was small enough to be negligible when compared with the fraction exhaled by ventilation 31.
The breathing pattern is the major limitation on accuracy and repeatability of quantitative fractional ventilation imaging. A trend of 129Xe MBW‐I resulting in higher mean fractional ventilation was observed, which could be linked to the consistently higher tidal volume measured with129Xe when compared with 3He experiments (Table 1). In the absence of ventilation defects, differences in mean fractional ventilation information from repeated experiments are likely to arise from an altered breathing pattern and/or different inspiratory levels. Those could potentially arise from differences in image acquisition time for 129Xe and 3He MBW‐I. The method also relies upon the subjects' ability to reproduce their breathing pattern between experiments. In order to reduce errors from variation in breathing within an experiment, images with a tidal and/or lung volume varying by more than ±15% of the mean were excluded. This rejection criterion resulted in a worst case propagated error in fractional ventilation of 21%. A passive volume delivery device could also be used to increase the reproducibility and accuracy of the subjects breathing pattern 32.
In addition, image SNR and the number of images used in fitting can influence the accuracy of the fractional ventilation parameter. In background work a Monte‐Carlo analysis of errors from MBW‐I was performed 33 with an initial SNR of approximately 60 using 3‐5 points for fitting. Assuming an average lung turnover of 0.15–0.35, the results showed an error of between 4% and 10% in the fractional ventilation parameter. An even lower error can be expected with higher image SNR values [see Horn 33 for reference]. Experimental parameters that affect the accuracy of the fit to fractional ventilation—including the number of images included in the fit and the respective image SNR—are provided in Table 1 for the different experiments performed.
In conclusion, bSSFP sequences allow efficient use of polarization and reduced gas dosage requirements when compared with SPGR for MBW‐I applications in humans. The achieved gains in SNR can alternatively be used to improve spatial resolution in MBW‐I. The feasibility of 3D MBW‐I with 129Xe has also been demonstrated successfully for the first time and was validated against 3He MBW‐I. In future work, it may be possible to identify sensitivity differences in MBW‐I with the different gases to characterize different physiological processes of obstructive lung diseases.
ACKNOWLEDGMENTS
We thank Helen Marshall, Guilhem Collier, and Juan Parra‐Robles for practical assistance carrying out experiments.
REFERENCES
- 1. Robinson PD, Goldman MD, Gustafsson PM. Inert gas washout: theoretical background and clinical utility in respiratory disease. Respiration 2009;78:339–355. [DOI] [PubMed] [Google Scholar]
- 2. Horsley AR, Gustafsson PM, Macleod KA, Saunders C, Greening AP, Porteous DJ, Davies JC, Cunningham S, Alton EWFW, Innes JA. Lung clearance index is a sensitive, repeatable and practical measure of airways disease in adults with cystic fibrosis. Thorax 2008;63:135–140. [DOI] [PubMed] [Google Scholar]
- 3. Gustafsson PM, De Jong PA, Tiddens HA, Lindblad A. Multiple‐breath inert gas washout and spirometry versus structural lung disease in cystic fibrosis. Thorax 2008;63:129–134. [DOI] [PubMed] [Google Scholar]
- 4. Verbanck S, Schuermans D, Meysman M, Paiva M, Vincken W. Noninvasive assessment of airway alterations in smokers: the small airways revisited. Am J Respir Crit Care Med 2004;170:414–419. [DOI] [PubMed] [Google Scholar]
- 5. Verbanck S, Schuermans D, Van Muylem A, Melot C, Noppen M, Vincken W, Paiva M. Conductive and acinar lung‐zone contributions to ventilation inhomogeneity in COPD. Am J Respir Crit Care Med 1998;157:1573–1577. [DOI] [PubMed] [Google Scholar]
- 6. Lutchen KR, Habib RH, Dorkin HL, Wall MA. Respiratory impedance and multibreath N2 washout in healthy, asthmatic, and cystic fibrosis subjects. J Appl Physiol 1990;68:2139–2149. [DOI] [PubMed] [Google Scholar]
- 7. Lewis SM, Evans JW, Jalowayski AA. Continuous distributions of specific ventilation recovered from inert gas washout. J Appl Physiol 1978;44:416–423. [DOI] [PubMed] [Google Scholar]
- 8. Fain SB, Korosec FR, Holmes JH, O'Halloran R, Sorkness RL, Grist TM. Functional lung imaging using hyperpolarized gas MRI. J Magn Reson Imaging 2007;25:910–923. [DOI] [PubMed] [Google Scholar]
- 9. Moeller HE, Chen XJ, Saam B, Hagspiel KD, Johnson GA, Altes TA, de Lange EE, Kauczor HU. MRI of the lungs using hyperpolarized noble gases. Magn Reson Med 2002;47:1029–1051. [DOI] [PubMed] [Google Scholar]
- 10. Ruppert K. Biomedical imaging with hyperpolarized noble gases. Reports on progress in physics Physical Society 2014;77:116701. [DOI] [PubMed] [Google Scholar]
- 11. Woodhouse N, Wild JM, Paley MN, Fichele S, Said Z, Swift AJ, van Beek EJ. Combined helium‐3/proton magnetic resonance imaging measurement of ventilated lung volumes in smokers compared to never‐smokers. J Magn Reson Imaging 2005;21:365–369. [DOI] [PubMed] [Google Scholar]
- 12. He M, Kaushik SS, Robertson SH, Freeman MS, Virgincar RS, McAdams HP, Driehuys B. Extending semiautomatic ventilation defect analysis for hyperpolarized (129)Xe ventilation MRI. Acad Radiol 2014;21:1530–1541. [DOI] [PMC free article] [PubMed] [Google Scholar]
- 13. Tzeng YS, Lutchen K, Albert M. The difference in ventilation heterogeneity between asthmatic and healthy subjects quantified using hyperpolarized 3He MRI. J Appl Physiol 2009;106:813–822. [DOI] [PubMed] [Google Scholar]
- 14. Deninger AJ, Mansson S, Petersson JS, et al. Quantitative measurement of regional lung ventilation using 3He MRI. Magn Reson Med 2002;48:223–232. [DOI] [PubMed] [Google Scholar]
- 15. Emami K, Kadlecek SJ, Woodburn JM, Zhu J, Yu J, Vahdat V, Pickup S, Ishii M, Rizi RR. Improved technique for measurement of regional fractional ventilation by hyperpolarized 3He MRI. Magn Reson Med 2010;63:137–150. [DOI] [PMC free article] [PubMed] [Google Scholar]
- 16. Hamedani H, Clapp JT, Kadlecek SJ, et al. Regional fractional ventilation by using multibreath wash‐in He MR imaging. Radiology 2016;279:917–924. [DOI] [PMC free article] [PubMed] [Google Scholar]
- 17. Deppe MH, Parra‐Robles J, Ajraoui S, Wild JM. Combined measurement of pulmonary inert gas washout and regional ventilation heterogeneity by MR of a single dose of hyperpolarized (3)He. Magn Reson Med 2011;65:1076–1084. [DOI] [PubMed] [Google Scholar]
- 18. Horn FC, Deppe MH, Marshall H, Parra‐Robles J, Wild JM. Quantification of regional fractional ventilation in human subjects by measurement of hyperpolarized 3He washout with 2D and 3D MRI. J Appl Physiol 2014;116:129–139. [DOI] [PubMed] [Google Scholar]
- 19. Norquay G, Parnell SR, Xu X, Parra‐Robles J, Wild JM. Optimized production of hyperpolarized 129Xe at 2 bars for in vivo lung magnetic resonance imaging. J Appl Physics 2013;113:044908. [Google Scholar]
- 20. Nikolaou P, Coffey AM, Walkup LL, et al. Near‐unity nuclear polarization with an open‐source 129Xe hyperpolarizer for NMR and MRI. Proc Natl Acad Sci U S A 2013;110:14150–14155. [DOI] [PMC free article] [PubMed] [Google Scholar]
- 21. Wild JM, Teh K, Woodhouse N, Paley MN, Fichele S, de Zanche N, Kasuboski L. Steady‐state free precession with hyperpolarized 3He: experiments and theory. J Magn Reson 2006;183:13–24. [DOI] [PubMed] [Google Scholar]
- 22. Stewart NJ, Norquay G, Griffiths PD, Wild JM. Feasibility of human lung ventilation imaging using highly polarized naturally abundant xenon and optimized three‐dimensional steady‐state free precession. Magn Reson Med 2015;74:346–352. [DOI] [PubMed] [Google Scholar]
- 23. Rao M, Wild JM. RF instrumentation for same‐breath triple nuclear lung MR imaging of H and hyperpolarized He and Xe at 1.5T. Magn Reson Med 2016;75:1841–1848. [DOI] [PMC free article] [PubMed] [Google Scholar]
- 24. Kirby M, Svenningsen S, Owrangi A, et al. Hyperpolarized 3He and 129Xe MR imaging in healthy volunteers and patients with chronic obstructive pulmonary disease. Radiology 2012;265:600–610. [DOI] [PubMed] [Google Scholar]
- 25. Altes TA, Powers PL, Knight‐Scott J, Rakes G, Platts‐Mills TA, de Lange EE, Alford BA, Mugler JP 3rd, Brookeman JR. Hyperpolarized 3He MR lung ventilation imaging in asthmatics: preliminary findings. J Magn Reson Imaging 2001;13:378–384. [DOI] [PubMed] [Google Scholar]
- 26. Horn FC, Marshall H, Siddiqui S, Horsley A, Smith L, Aldag I, Kay R, Taylor CJ, Parra‐Robles J, Wild J. Ventilation Heterogeneity in Obstructive Airways Disease—Comparing Multi‐Breath Washout‐Imaging with Global Lung Measurements. In Proceedings of the 23rd Annual Meeting of ISMRM, Toronto, Canada, 2015. Abstract 0852.
- 27. Horn FC, Deppe MH, Marshall H, Norquay G, Parra‐Robles J, Wild JM. Observation of Gravitational Dependence of Regional Fractional Ventilation in Human Lungs with 2D and 3D Multi‐Breath Washout Imaging of 3He and 129Xe. In Proceedings of the 20th Annual Meeting of ISMRM, Melbourne, Victoria, Australia, 2012. p. 177.
- 28. Svenningsen S, Kirby M, Starr D, Leary D, Wheatley A, Maksym GN, McCormack DG, Parraga G. Hyperpolarized He and Xe MRI: differences in asthma before bronchodilation. J Magn Reson Imaging 2013;38:1521–1530. [DOI] [PubMed] [Google Scholar]
- 29. Wild JM, Marshall H, Xu X, Norquay G, Parnell SR, Clemence M, Griffiths PD, Parra‐Robles J. Simultaneous imaging of lung structure and function with triple‐nuclear hybrid MR imaging. Radiology 2013;267:251–255. [DOI] [PubMed] [Google Scholar]
- 30. Acosta RH, Agulles‐Pedros L, Komin S, Sebastiani D, Spiess HW, Blumler P. Diffusion in binary gas mixtures studied by NMR of hyperpolarized gases and molecular dynamics simulations. Phys Chem Chem Phys 2006;8:4182–4188. [DOI] [PubMed] [Google Scholar]
- 31. Mugler JP 3rd, Altes TA. Hyperpolarized 129Xe MRI of the human lung. J Magn Reson Imaging 2013;37:313–331. [DOI] [PMC free article] [PubMed] [Google Scholar]
- 32. Emami K, Xu Y, Hamedani H, Xin Y, Profka H, Rajaei J, Kadlecek S, Ishii M, Rizi RR. Multislice fractional ventilation imaging in large animals with hyperpolarized gas MRI. NMR Biomed 2012;25:1015–1025. [DOI] [PMC free article] [PubMed] [Google Scholar]
- 33. Horn FC. Quantitative imaging of lung function using hyperpolarised gas MRI [PhD thesis]. Sheffield: Sheffield University; 2015. Available at: http://etheses.whiterose.ac.uk/9440/. [Google Scholar]
- 34. Quanjer PH, Stanojevic S, Cole TJ, et al.; ERS Global Lung Function Initiative . Multi‐ethnic reference values for spirometry for the 3‐95‐yr age range: the global lung function 2012 equations. Eur Respir J 2012;40:1324–1343. [DOI] [PMC free article] [PubMed] [Google Scholar]