

Abstract
Background
This study determined the overall response rate (ORR) and safety of ofatumumab monotherapy in patients with untreated and relapsed Waldenström’s macroglobulinaemia (WM).
Methods
Patients (n=37) received up to three cycles of weekly ofatumumab. Cycle 1 (C1) administered ofatumumab 300 mg during Week 1 followed by 1,000 mg during Weeks 2–4 (Treatment Group A [TGA]; n=15) or 2,000 mg during Weeks 2–5 (TGB; n=22). Patients with stable disease or minor response (MR) after 16 weeks were eligible to receive a Redosing Cycle (RC) of ofatumumab at 300 mg during Week 1 and 2,000 mg during Weeks 2–5. Patients responding to C1 or RC who progressed within 36 months could receive Cycle 2 (C2) of ofatumumab at 300 mg during Week 1 and 2,000 mg during Weeks 2–5.
Findings
The ORR after C1 was 51% and improved to 59% (15 partial responses, 7 MRs) after the RC. Median time to response for responders was 78·5 days, and median progression-free survival was 536 days. Thirteen patients received C2. The ORR was 77% for patients after completing C2. All 37 patients experienced at least one adverse event (AE). Two patients had immunoglobulin M (IgM) flare, and 16 patients experienced Grade ≥3 AEs (32 Grade 3, 1 Grade 4).
Interpretation
Ofatumumab monotherapy demonstrated a high ORR and was well tolerated, with a low incidence of IgM flare.
Funding
Financial support for this study was provided by GlaxoSmithKline and Genmab. This trial was registered at www.ClinicalTrials.gov as #NCT00811733.
Introduction
Waldenström’s macroglobulinaemia (WM) is a type of indolent B-cell non-Hodgkin’s lymphoma (B-NHL) characterised by production of a monoclonal immunoglobulin M (IgM) paraprotein, bone marrow infiltration, and variable CD20 expression.1–3 Patients experience cytopenias resulting from bone marrow infiltration and complications arising from high serum IgM levels, such as hyperviscosity, haemolytic anaemia, and cryoglobulinemia.4–8 Until recently, no treatments were specifically approved for WM. In January 2015, the FDA approved ibrutinib for patients with WM, but it is unclear whether continued therapy allows for patients to ever discontinue treatment with this drug. Other agents utilized, including alkylators and nucleoside analogues, cause myelosuppression and long-term marrow failure. The chimeric anti-CD20 monoclonal antibody rituximab obtains an overall response rate (ORR) of 25–75%,9–14 with a median time to progression of 6–16 months in patients with WM.9–11,14 Furthermore, 40–50% of patients treated with single-agent rituximab experience an IgM flare, defined as a transient increase in IgM that occurs with therapy and is followed by a sufficient decrease in IgM to qualify as a response. The acute rise in IgM is often sufficient to result in significant morbidity and mortality.1,14,15 Thus, development of novel agents, especially non-chemotherapeutics, is needed in WM.
Ofatumumab is a human anti-CD20 monoclonal antibody that binds to an epitope distinct from that recognized by rituximab.16 Ofatumumab demonstrates more potent complement-dependent cytotoxicity (CDC) than rituximab in vitro, especially in cells with low CD20 expression such as chronic lymphocytic leukaemia (CLL).17,18 Ofatumumab is approved for the treatment of fludarabine- and alemtuzumab-refractory CLL19,20 and of previously untreated CLL in combination with chlorambucil21 and has demonstrated clinical activity in B-NHL.22 Considering the established antitumor effects of rituximab, variable CD20 expression in WM, and the enhanced CDC of ofatumumab, we conducted a phase 2 clinical trial to evaluate ofatumumab efficacy and tolerability in patients with WM.
Methods
Patients
Adult patients had untreated or relapsed WM, and required therapy according to criteria established by the Second International Workshop on WM.8,23,24 Patients had detectable CD20-positive tumour by immunohistochemistry or flow cytometry; adequate organ function defined by absolute neutrophil count ≥1·0 × 109/L and platelet count >50 × 109/L unless due to marrow infiltration; transaminases ≤2·5 × the upper level of normal (ULN); total bilirubin <2 × ULN unless due to Gilbert’s disease; and serum creatinine <3 mg/dL. Patients with monoclonal antibody therapy within 3 months prior to enrolment, treatment for WM within 28 days prior to enrolment, or uncontrolled chronic or active infections were excluded.
Institutional review boards at participating centres approved the protocol. Patients gave written informed consent. The study was conducted in accordance with the Guidelines for Good Clinical Practice and the Declaration of Helsinki. This study was conducted by the Waterfall Waldenström’s Research Consortium and other centres and is registered at ClinicalTrials.gov (NCT00811733).
Treatment plan
In this open-label, single-arm study (Figure 1) patients received up to three cycles (Cycle 1 [C1], Redosing Cycle [RC], and Cycle 2 [C2]) of weekly ofatumumab. In Treatment Group A (TGA), patients received intravenous ofatumumab at 300 mg during Week 1 and 1,000 mg during Weeks 2–4 (C1). Due to the acceptable safety of the 1,000 mg dose level in TGA and clinical activity of the 2,000 mg dose level established in CLL, the study was amended to change C1 to 300 mg during Week 1 and 2,000 mg during Weeks 2–5 (Treatment Group B [TGB]). Patients were premedicated with acetaminophen 1000 mg (or 975 mg) orally, diphenhydramine 50 mg orally or intravenously, and dexamethasone 8 mg orally or intravenously.
Figure 1. Study schematic.

Study schema for the OMB110921 study. For the first 15 patients in TGA, C1 consisted of intravenous ofatumumab 300 mg during Week 1 followed by 1,000 mg during Weeks 2–4. The next 22 patients were enrolled in TGB and received intravenous ofatumumab 300 mg during Week 1 followed by 2,000 mg during Weeks 2–5. Patients with SD or an MR at Week 16 of C1 were eligible to receive an RC consisting of ofatumumab 300 mg during Week 1 and 2,000 mg during Weeks 2–5. Patients who achieved a response in C1 or RC and then progressed within 36 months were eligible to receive C2.
C1=Cycle 1. C2=Cycle 2. MR=minor response. OFA=ofatumumab. RC=redosing cycle. SD=stable disease. TGA=Treatment Group A. TGB=Treatment Group B.
Response was assessed starting at Week 16 of C1, given the potential of IgM flare and the long time to response observed with rituximab. Patients with stable disease (SD) or minor response (MR) at C1 Week 16 were eligible to receive an RC of ofatumumab at 300 mg during Week 1 and 2,000 mg during Weeks 2–5. Response was re-assessed at Week 16 of RC. Patients who achieved a response following C1 or RC and subsequently developed progressive disease (PD) within 36 months were eligible to receive Cycle 2 (C2) of ofatumumab at 300 mg during Week 1 and 2,000 mg during Weeks 2–5.
The rationale for having a Redosing Cycle (RC) was to assess whether a second cycle of ofatumumab would be able to improve the response of a patient who was a poor or non-responder. Since the dosing of monoclonal antibodies is relatively arbitrary, it was felt to be important to include the responses at the different intervals in order to provide evidence of a dose effect. The rationale for having Cycle 2 (C2) was to assess whether retreatment with ofatumumab would be able to generate responses in patients who previously demonstrated a response and then progressed. Patients were required to wait until at least demonstrating progression as they would need to meet standard criteria for needing further treatment.
Assessment of toxicity and response
National Cancer Institute Common Terminology Criteria for Adverse Events, v3·0 were used to evaluate toxicity from the first dose until 60 days after the last treatment dose. No dose reductions were allowed. Patients were assessed for clinical response using recommendations from International Workshops on WM.25,26 The baseline IgM (average of screening and Cycle 1, Week 1 IgM levels) was used to assess response and results were reviewed centrally. IgM was measured weekly until Week 8, followed by monthly for the first year. IgM flare was defined as IgM level increasing by >25% from baseline and associated with a response to treatment.
Pharmacokinetics
Blood samples were collected during and after each treatment cycle. For each infusion, the maximum observed plasma ofatumumab concentration (Cmax) and the plasma ofatumumab concentration prior to the start of the next infusion (Ctrough) were determined directly from the raw concentration–time data. Non-linear mixed effects modelling of the concentration–time data was performed using a two-compartment model with first-order elimination and combined additive and proportional error using the software NONMEM, v7·2·0 (ICON, Ellicott City, MD). The covariate model was adapted from the population pharmacokinetic model for ofatumumab monotherapy.27 Individual post hoc parameter estimates were generated for each patient, and pharmacokinetic parameter estimates were derived using standard equations.
Statistical analysis
Sample size determination was based on practical considerations rather than power calculation. Patients were enrolled into either TGA or TGB according to the protocol in effect at the time. Responders included patients with complete response (CR), partial response (PR), or MR. Patients with SD, PD, or unknown or missing responses were considered non-responders.
For the primary endpoint, the ORR and corresponding exact 95% confidence intervals (CI) after C1 and RC were estimated and presented. The ORR is the number of responders divided by the number of patients by intent-to-treat analysis, including all eligible patients who were exposed to at least one dose of ofatumumab.
Summary statistics were generated for the secondary endpoints. Progression-free survival (PFS), time to response, and duration of response were estimated using the Kaplan–Meier method with Day 0 defined as the date of the first infusion. PFS was defined as the time from baseline date to disease progression or death, time to response was defined as the time from baseline date to the first response date, and duration of response was defined as the time from initial response to relapse/progression or death. PFS estimates did not include the interval following disease progression for patients who received C2.
Role of the funding source
The study was planned, initiated, and sponsored by GlaxoSmithKline and Genmab. The sponsor was responsible for data gathering. The sponsor and authors were responsible for data analysis and interpretation and contributed to preparing and reviewing the manuscript. All authors approved the manuscript for submission. The corresponding author had full access to the study data and the final responsibility for the decision to submit for publication. As of March 2015, ofatumumab is an asset of Novartis AG.
Results
Patient characteristics and disposition
Thirty-seven patients were enrolled between March 2009 and February 2011 (Table 1). Median age was 63 years (range 43–85). Median IgM at baseline was 3·11 g/dL (range 0·81–8·64). Median haemoglobin at baseline was 9·8 g/dL (range 5·3–13·2), and 26 (70%) patients had haemoglobin <11 g/dL. Twenty-eight (76%) patients were previously treated, with a median of three prior therapies (range 1–5), of whom 25 patients (89%) had received prior rituximab. TGA consisted of the first 15 patients, and TGB the following 22 patients. Thirty-four (92%) patients received all planned doses in C1. Two patients discontinued C1 early due to AEs (haemolysis, fluid overload; one patient each), and one patient withdrew consent. Twelve (32%) patients (8/15 in TGA, 4/22 in TGB) entered the RC, and all planned doses of ofatumumab were delivered. All 13 patients who entered C2 received all planned doses (Figure 2).
Table 1.
Patient baseline characteristics
| TGA (1,000 mg) n=15 | TGB (2,000 mg) n=22 | Total N=37 | |
|---|---|---|---|
|
| |||
| Age | |||
|
| |||
| Median age, years (range) | 59 (43–85) | 63·5 (45–79) | 63 (43–85) |
| Age ≥60 years, n (%) | 6 (40) | 17 (77) | 23 (62) |
|
| |||
| Gender | |||
|
| |||
| Male, n (%) | 9 (60) | 13 (59) | 22 (59) |
| Female, n (%) | 6 (40) | 9 (41) | 15 (41) |
| Median IgM at baseline, g/dL (range) | 3·49 (1·18–6·63) | 3·00 (0·81–8·64) | 3·11 (0·81–8·64) |
| Median Hgb at baseline, g/dL (range) | 9·8 (5·3–12·0) | 9·6 (7·0–13·2) | 9·8 (5·3–13·2) |
|
| |||
| Prior therapy | |||
|
| |||
| No prior therapy, n (%) | 3 (20) | 6 (27) | 9 (24) |
| Previously treated, n (%) | 12 (80) | 16 (73) | 28 (76) |
| Median number of therapies,* n (range) | 3 (2–5) | 2·5 (1–4) | 3 (1–5) |
| Prior rituximab,* n (%) | 11 (92) | 14 (88) | 25 (89) |
|
| |||
| Symptomatic or bulky lymphadenopathy or organomegaly at screening | |||
|
| |||
| Yes, n (%) | 6 (40) | 6 (27) | 12 (32) |
Includes only previously treated patients.
Hgb=haemoglobin. IgM=immunoglobulin M. TGA=Treatment Group A. TGB=Treatment Group B.
Figure 2. Flow chart indicating treatment delivery for each treatment group.
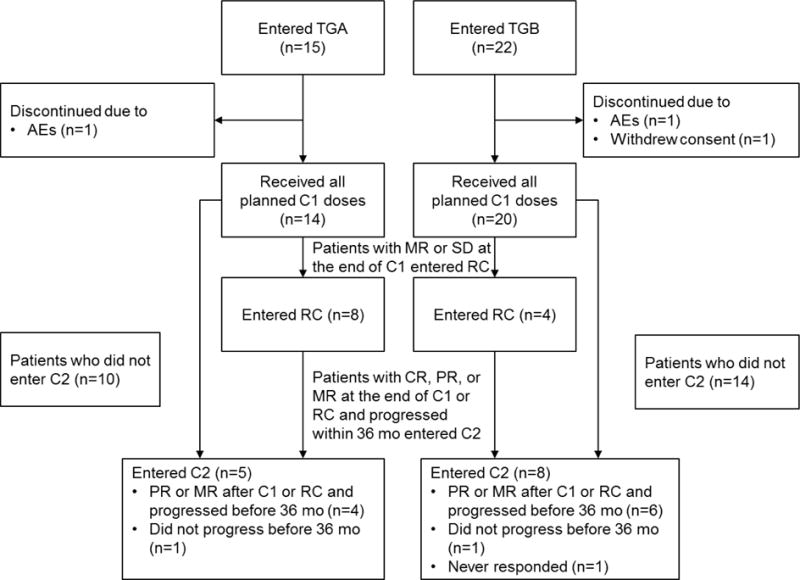
Patients were treated with weekly ofatumumab infusions at either 1,000 mg (TGA) or 2,000 mg (TGB). Patients received up to three cycles of treatment (C1, RC and C2). Only patients who had demonstrated a response (CR, PR, or MR) during either C1 or RC and subsequently progressed within 36 months were eligible for C2.
AE=adverse event. C1=Cycle 1. C2=Cycle 2. CR=complete response. MR=minor response. PR=partial response. RC=redosing cycle. TGA=Treatment Group A. TGB=Treatment Group B.
Efficacy
All patients assessed for the primary endpoint were evaluated for response, with a median duration follow-up of 405 days for TGA and 393 days for TGB (743 and 414 days for responders, respectively). The ORR after C1 was 51% (TGA: 33%, TGB: 64%), with 12 (32%) PRs (TGA: three [20%], TGB: nine [41%]), and seven (19%) MRs (TGA: two [13%], TGB: five [23%]). After C1+RC, the ORR improved to 59% (TGA: 47%, TGB: 68%), with 15 (41%) PRs (TGA: four [27%], TGB: 11 [50%]) and seven (19%) MRs (TGA: three [20%], TGB: four [18%]).
Twelve patients entered the RC following C1. The median IgM level at the time of re-dosing was 3·2 g/dL (TGA: 3·2 g/dL; TGB: 4·0 g/dL). Only ten patients had response assessments performed during the RC, three of whom improved in response status (one SD to MR [time to re-dosing was 216 days], one SD to PR [time to re-dosing was 183 days; time to progression was 558 days], one MR to PR [time to re-dosing was 279 days; patient did not progress]).
Table 2 describes ORR following C1+RC by patient characteristics. In patients with baseline IgM level <4 g/dL, 16 of 25 (64%) responded to ofatumumab (TGA: 6/9=67%; TGB: 10/16=63%). In patients with baseline IgM level ≥4 g/dL, six of 12 (50%) responded (TGA: 1/6=17%; TGB: 5/6=83%).
Table 2.
Total investigator-assessed response rates by disease characteristics following C1 + RC
| TGA (1,000 mg) n=15 |
TGB (2,000 mg) n=22 |
Total N=37 |
|
|---|---|---|---|
|
| |||
| All patients, % (n/N) | 47 (7/15) | 68 (15/22) | 59 (23/37) |
|
| |||
| Prior therapy, % (n/N) | |||
|
| |||
| Yes | 42 (5/12) | 69 (11/16) | 57 (16/28) |
| No | 67 (2/3) | 67 (4/6) | 67 (6/9) |
|
| |||
| Prior rituximab, % (n/N) | |||
|
| |||
| Yes | 36 (4/11) | 64 (9/14) | 52 (13/25) |
| No | 75 (3/4) | 75 (6/8) | 75 (9/12) |
|
| |||
| Baseline IgM level, % (n/N) | |||
|
| |||
| <4 g/dL | 67 (6/9) | 63 (10/16) | 64 (16/25) |
| ≥4 g/dL | 17 (1/6) | 83 (5/6) | 50 (6/12) |
IgM=immunoglobin M. TGA=Treatment Group A. TGB=Treatment Group B.
For all patients, the median percent change in IgM from baseline to nadir was −39·8% (Figure 3; Table 3). For the 22 responders, median percent change in IgM from baseline to nadir was −64·0% (Table 3).
Figure 3. Percent change in IgM from baseline to nadir for patients in C1+RC.

Percent change in IgM from baseline to nadir for all patients (n=37). The median IgM percent change from baseline to nadir was −44% in TGA (n=15) and −39% in TGB (n=22).
C1=Cycle 1. IgM=immunoglobin M. RC=redosing cycle. TGA=Treatment Group A. TGB=Treatment Group B.
Table 3.
Clinical efficacy assessed by investigators
| TGA (1,000 mg) n=15 |
TGB (2,000 mg) n=22 |
Total N=37 |
|
|---|---|---|---|
|
| |||
| Overall response rate to C1* | |||
|
| |||
| PR, n (%) | 3 (20) | 9 (41) | 12 (32) |
| MR, n (%) | 2 (13) | 5 (23) | 7 (19) |
| Overall response rate (MR+PR), n (%) | 5 (33) | 14 (64) | 19 (51) |
| [95% CI] | [11.8–61.6] | [40.7–82.8] | [34.4–68.1] |
|
| |||
| Overall response rate to C1 + RC* | |||
|
| |||
| PR, n (%) | 4 (27) | 11 (50) | 15 (41) |
| MR, n (%) | 3 (20) | 4 (18) | 7 (19) |
| Overall response rate (MR+PR), n (%) | 7 (47) | 15 (68) | 22 (59) |
| [95% CI] | [21.3–73.4] | [45.1–86.1] | [42.1–75.2] |
|
| |||
| Change in IgM levels | |||
|
| |||
| Median IgM change from baseline to nadir (all patients [n=37]), % | −43·6 | −39·1 | −39·8 |
| Median time to IgM nadir (all patients [n=37]), days | 190 | 228 | 218 |
| Median IgM change from baseline to nadir (responders [n=22]), % | −61·0 | −72·2 | −64·0 |
| Median time to IgM nadir (responders [n=22]), days | 351 | 289 | 298 |
|
| |||
| Improvement in haemoglobin | |||
|
| |||
| Baseline Hgb <11·0 g/dL, n | 12 | 14 | 26 |
| ≥3·0 g/dL increase in Hgb, n (%) | 6 (50) | 9 (64) | 15 (58) |
| Normalization of Hgb†, n (%) | 6 (50) | 8 (57) | 14 (54) |
| Median time to reach normal Hgb†, weeks | 25·0 | 20·9 | 20·9 |
There were no CRs in this study.
Normal Hgb for men: 12·5 g/dL; normal Hgb for women: 11·5 g/dL.
C1=Cycle 1. CI=confidence interval. CR=complete response. Hgb=haemoglobin. IgM=immunoglobin M. MR=minor response. PR=partial response. RC=redosing cycle. TGA=Treatment Group A. TGB=Treatment Group B.
Thirteen patients entered C2. The median IgM at the time of C2 was 2·1 g/dL (TGA: 1·7 g/dL; TGB: 2·4 g/dL). The ORR after C2 was 77% (TGA: 4/5=80%, TGB: 6/8=75%), with six PRs and four MRs, and median time to response was 85 days for these 13 patients. Of the 13 patients entering C2, two patients had received re-dosing. The IgM levels at time of re-dosing were 1·9 g/dL (value at nadir was 1·0) and 1·7 g/dL (value at nadir was 0·27).
Of 7 patients who had an enlarged spleen at baseline, 5 had a normal spleen post-baseline, 1 remained enlarged and 1 did not have a post-baseline assessment. One patient had an enlarged liver at baseline, which was normal post-baseline.
Improvement in anaemia
Median haemoglobin was 9·9 g/dL at screening and improved to 11·5 g/dL at Month 3, 12·0 g/dL at Month 6, and 12·7 g/dL at Month 12. Among the 26 patients who had a baseline haemoglobin level of <11·0 g/dL, 54% (n=14) experienced normalization of haemoglobin after a median time of 20·9 weeks (range 4–48) (TGA: 6/12=50%; TGB: 8/14=57%) (Table 3). Of these 26 patients, 15 experienced a significant increase (≥3·0 g/dL) in haemoglobin levels, including one patient who experienced ≥3·0 g/dL improvement but without normalization of haemoglobin due to profound baseline anaemia. Of these 15 patients, ten achieved PR, two achieved MR, and three had SD.
Time-to-event analysis
The median PFS for all patients was 536 days (95% CI 424–654 days). The median PFS for patients in TGA was 558 days (18·3 months) compared with 536 days (17·6 months) in TGB (Figure 4). The median time to response for 22 responders was 78·5 days (95% CI 78–104 days; TGA: 78, TGB: 81). The median time for IgM nadir for 22 responders was 298 days (range 77–605; TGA: 351, TGB: 289) (Table 3). The median duration of response was 449 days in TGA and 455 days in TGB, with six of 15 (40%) patients, all in TGB, continuing in remission at the time of analysis.
Figure 4. Progression-free survival.

Kaplan–Meier survival curves of PFS for patients in TGA and TGB. The median PFS is 558 days (95% CI 353–666 days) for TGA and 536 days (95% CI 414–1093 days) for TGB. The median PFS for the total population is 536 days (95% CI 424–654 days) for the overall study population (n=37).
CI=confidence interval. PFS=progression-free survival. TGA=Treatment Group A. TGB=Treatment Group B.
Safety
All 37 patients experienced at least one adverse event (AE) (36 patients [97%] in C1; 11 patients [92%] in RC, and one patient [17%] in C2). The most frequent AEs were urticaria (35%), pruritus (35%), throat irritation (27%), and flushing (27%) (Table 4). Sixteen (43%) patients experienced Grade ≥3 AEs (32 Grade 3 and one Grade 4). The most common Grade 3/4 AEs were chest pain (5%) and haemolysis (5%). Eighteen (49%) patients had infections; most were Grade 1–2 upper respiratory infections. During C1, one patient experienced a Grade 3 urinary tract infection that resolved. Infusion-related reactions were defined as AEs occurring from the beginning of an ofatumumab infusion to 24 hours following the end of an infusion. Thirty (81%) patients developed an infusion-related AE following the first infusion, and 21 (57%) developed an infusion-related AE following the second infusion. Most infusion-related reactions were Grade 1, with Grade ≥3 occurring in four (11%) patients. No patients discontinued therapy due to infusion reactions.
Table 4.
Adverse events occurring in at least 10% of patients (any grade) or 5% of patients (grade 3/4) by preferred term.
| Adverse event, n (%) | TGA (1,000 mg) n=15 |
TGB (2,000 mg) n=22 |
Total N=37 |
|||
|---|---|---|---|---|---|---|
|
| ||||||
| All grade | Grade 3/4 | All grade | Grade 3/4 | All grade | Grade 3/4 | |
|
| ||||||
| Urticaria | 4 (27) | 0 | 9 (41) | 0 | 13 (35) | 0 |
| Pruritus | 8 (53) | 0 | 11 (50) | 0 | 19 (51) | 0 |
| Throat irritation | 7 (47) | 0 | 3 (14) | 0 | 10 (27) | 0 |
| Flushing | 6 (40) | 0 | 4 (18) | 0 | 10 (27) | 0 |
| Rash | 6 (40) | 1 (7) | 3 (14) | 0 | 9 (24) | 1 (3) |
| Pyrexia | 3 (20) | 0 | 6 (27) | 1 (5) | 9 (24) | 1 (3) |
| Upper respiratory tract infection | 7 (47) | 0 | 2 (9) | 0 | 9 (24) | 0 |
| Headache | 5 (33) | 1 (7) | 4 (18) | 0 | 9 (24) | 1 (3) |
| Fatigue | 4 (27) | 0 | 4 (18) | 1 (5) | 8 (22) | 1 (3) |
| Oropharyngeal pain | 2 (13) | 0 | 5 (23) | 0 | 7 (19) | 0 |
| Insomnia | 2 (13) | 0 | 4 (18) | 0 | 6 (16) | 0 |
| Cough | 4 (27) | 0 | 2 (9) | 0 | 6 (16) | 0 |
| Epistaxis | 3 (20) | 1 (7) | 3 (14) | 0 | 6 (16) | 1 (3) |
| Nasal congestion | 3 (20) | 0 | 3 (14) | 0 | 6 (16) | 0 |
| Chills | 1 (7) | 0 | 5 (23) | 0 | 6 (16) | 0 |
| Abdominal pain | 3 (20) | 0 | 2 (9) | 0 | 5 (14) | 0 |
| Diarrhoea | 2 (13) | 0 | 3 (14) | 0 | 5 (14) | 0 |
| Sinusitis | 2 (13) | 0 | 3 (14) | 0 | 5 (14) | 0 |
| Decreased appetite | 3 (20) | 0 | 2 (9) | 0 | 5 (14) | 0 |
| Muscle spasms | 4 (27) | 0 | 1 (5) | 0 | 5 (14) | 0 |
| Myalgia | 1 (7) | 0 | 4 (18) | 0 | 5 (14) | 0 |
| Infusion-related reactions* | 2 (13) | 0 | 3 (14) | 0 | 5 (14) | 0 |
| Constipation | 2 (13) | 0 | 2 (9) | 0 | 4 (11) | 0 |
| Urinary tract infection | 3 (20) | 0 | 1 (5) | 1 (5) | 4 (11) | 1 (3) |
| Paraesthesia | 1 (7) | 0 | 3 (14) | 0 | 4 (11) | 0 |
| Hyperglycaemia | 1 (7) | 0 | 3 (14) | 0 | 4 (11) | 0 |
| Arthralgia | 1 (7) | 0 | 3 (14) | 0 | 4 (11) | 0 |
| Haemolysis | 1 (7) | 1 (7) | 1 (5) | 1 (5) | 2 (5) | 2 (5) |
| Neutropenia | 1 (7) | 1 (7) | 1 (5) | 1 (5) | 2 (5) | 2 (5) |
| Chest pain | 1 (7) | 1 (7) | 3 (14) | 1 (5) | 4 (11) | 2 (5) |
Data are n (%) as reported by investigator.
Reported as preferred term and does not reflect the study defined criteria for infusion-related reactions.
TGA=Treatment Group A. TGB=Treatment Group B.
Six (16%) patients experienced a decrease in haemoglobin (two Grade 1, three Grade 3, one Grade 4), with four (11%) considered drug-related. Two (5%) patients experienced Grade 3 neutropenia, with one (3%) considered drug-related; there were no episodes of febrile neutropenia. One (2%) patient experienced Grade 3 Coombs-negative haemolysis, and one (2%) patient developed Grade 3 Coombs-positive haemolysis. No AEs due to other cytopenias were reported. Three patients discontinued treatment due to AEs (acute renal failure [n=1] and haemolysis [n=2]). No deaths had occurred by the end of this study.
IgM flare
Two of 22 (9%) responding patients, both in TGB, met the protocol definition of an IgM flare. In these patients (baseline IgM: 4·34 and 1·14 g/dL), the IgM rose by 79% and 240%, peaking at Day 42 and Day 37, before achieving a response at Day 356 and Day 93, respectively. One of these patients was rituximab-naïve while the second had received prior rituximab treatment.
Pharmacokinetics
In TGA, geometric mean clearance and half-life values were 27·9 mL/h and 10·9 days, compared with 13·5 mL/h and 23·9 days, respectively in TGB (Table 5).
Table 5.
Summary of ofatumumab pharmacokinetic parameter values in patients with Waldenström’s macroglobulinaemia
| Pharmacokinetic parameter | TGA (1,000 mg) | TGB (2,000 mg) | ||
|---|---|---|---|---|
|
| ||||
| n | Geometric mean (%CVb) |
n | Geometric mean (%CVb) |
|
|
| ||||
| CL*, mL/h | 15 | 27·9 (132) | 21 | 13·5 (122) |
| Vss*, L | 15 | 10·0 (21) | 21 | 10·7 (24) |
| t½*, days | 15 | 10·9 (103) | 21 | 23·9 (103) |
|
| ||||
| Course 1† | ||||
|
| ||||
| Cmax Dose 1, μg/mL | 14 | 68·3 (67) | 19 | 72·1 (50) |
| Cmax Dose 3, μg/mL | NE | 19 | 465 (40) | |
| Cmax Dose 4, μg/mL | 13 | 259 (50) | NE | |
| Cmax Dose 5, μg/mL | NA | 18 | 640 (42) | |
| Ctrough prior to Dose 2, μg/mL | 7 | 3·0 (1,725) | 12 | 8·0 (1,084) |
| Ctrough prior to Dose 3, μg/mL | 11 | 13·9 (5,018) | 19 | 121 (184) |
| Ctrough prior to Dose 4, μg/mL | 13 | 23·4 (5,252) | 21 | 181 (252) |
| Ctrough prior to Dose 5, μg/mL | NA | 18 | 249 (230) | |
|
| ||||
| Course 2† | ||||
|
| ||||
| Cmax Dose 1, μg/mL | 9 | 53·2 (68) | 11 | 64·8 (68) |
| Cmax Dose 3, μg/mL | 8 | 554 (34) | 12 | 577 (46) |
| Cmax Dose 5, μg/mL | 10 | 528 (69) | 12 | 803 (44) |
| Ctrough prior to Dose 2, μg/mL | 7 | 8·1 (777) | 10 | 20·4 (828) |
| Ctrough prior to Dose 3, μg/mL | 8 | 144 (122) | 12 | 169 (94) |
| Ctrough prior to Dose 4, μg/mL | 11 | 225 (144) | 12 | 310 (78) |
| Ctrough prior to Dose 5, μg/mL | 11 | 279 (108) | 12 | 384 (58) |
Based on post hoc parameter estimates.
Course 1 = first course of treatment (Cycle 1); Course 2 = second course of treatment (Redosing Cycle 1 or Cycle 2, depending upon the patient).
%CVb=between-patient coefficient of variation. CL=clearance. Cmax=maximum observed concentration. Ctrough= plasma concentration prior to the start of the next infusion. NA=not available. NE=not evaluated. t½=elimination half-life. TGA=Treatment Group A. TGB=Treatment Group B. Vss=volume of distribution at steady state.
Discussion
This is the first clinical trial investigating the clinical activity and safety of ofatumumab in WM. Our findings demonstrate that ofatumumab is well tolerated, with significant clinical activity in untreated and relapsed WM. As a single agent, ofatumumab’s activity in WM is highly promising, especially in high-tumour-burden patients (IgM ≥4 g/dL), where the ORR was 50%. Published results of rituximab in comparable patients reported an ORR of 18%.11 This finding can have a major clinical impact and warrants further evaluation, as the response rate and low risk of IgM flare extends potential non-chemotherapeutic treatment options for patients with high IgM levels where current practice typically requires chemotherapy to avoid IgM flares.
Improvement in haemoglobin levels is an important goal of treatment, as many WM patients exhibit significant anaemia, and baseline haemoglobin levels ≤11·5 g/dL correlate with a poor prognosis in WM.28 We noted that ofatumumab treatment improved haemoglobin levels, with some patients demonstrating a significant increase (≥3·0 g/dL) in haemoglobin (58%) or resolution of anaemia (54%). The prolonged median time to normalization of haemoglobin (20·9 weeks) and time to IgM response (11·2 weeks) in responders are noteworthy and indicate the need to provide adequate time before determining whether a patient’s disease has responded. Additionally, while 12 of the 15 patients with a haemoglobin increase of ≥3·0 g/dL achieved MR or PR, the three remaining patients all had SD, indicating that patients may benefit even if the IgM level does not decrease by more than 25%.
Based on the safety profile of the 1,000 mg dose in TGA, the approval and safety data of the 2,000 mg dose in CLL, and lower expression of CD20 seen in WM and the likely benefit of higher doses with lower CD20 expression, we revised the study to administer a higher dose of ofatumumab in TGB. Although no statistical comparisons between TGA and TGB can be made due to the limited sample size and non-randomized treatment assignment, this higher dose appeared to improve clinical outcomes. Prior therapy correlated with a lower ORR in TGA (5/12 [42%] vs 2/3 [67%]) but did not affect the probability of response in TGB (11/16 [69%] vs 4/6 [67%]). Similarly, prior rituximab exposure correlated with a lower ORR (4/11 [36%] vs 3/4 [75%]) in TGA but not in TGB (9/14 [64%] vs 6/8 [75%]). Additionally, the ORR in patients with an IgM ≥4 g/dL was 17% in TGA and 83% in TGB. These findings suggest that the 2,000 mg dose of ofatumumab may be more effective in WM patients and may negate adverse prognostic factors such as IgM ≥4 g/dL, prior therapy, and anaemia.
Patients in TGA had higher ofatumumab clearance and shorter half-life values than patients in TGB, although no statistical comparison can be made. Since binding to B cells is a clearance mechanism for ofatumumab, these observations suggest that the higher dosing regimen may have decreased the tumour cell burden more on average in TGB, which is consistent with the clinical results. The pharmacokinetic parameter values in TGB are similar to those in patients with CLL; combined data from three clinical trials in patients with CLL, geometric mean values of clearance and half-life were 12·9 mL/h and 15·6 days, respectively.29
The ORR following C2 was a secondary endpoint in this study. Ten of 13 (77%) patients who responded to ofatumumab and subsequently had progressive disease responded to retreatment with ofatumumab (six PRs, four MRs), suggesting that WM patients who respond to ofatumumab may derive clinical benefit from retreatment at subsequent progression.
Ofatumumab was well tolerated in this study, and the AE profile was consistent with observations from other ofatumumab studies in B-NHL and CLL. The most common AEs were Grade 1–2 infusion reactions and infections, none of which resulted in patient withdrawal. Three patients discontinued therapy due to serious AEs; one patient, with a baseline IgM of 6·6 g/dL, developed acute renal failure requiring plasmapheresis, and two patients experienced haemolysis. The incidence of IgM flare seen with ofatumumab (9%) was lower than the 40–50% incidence reported for rituximab; however, no direct comparisons can be made due to the non-randomized nature of this study and the lack of a standardized definition across studies. It should also be noted that the frequency of IgM monitoring as well as previous exposure to rituximab may also be factors for difference in rituximab vs ofatumumab flare rates.
In this study, the median time to response for C1+RC was 11·2 weeks; the median time to IgM nadir, or best response, was 42·6 weeks; and the median time to normalization of haemoglobin was 20·9 weeks. These findings indicate that response to ofatumumab in WM is a prolonged process, supporting the hypothesis that the therapy kills a small compartment of malignant cells and allows the remaining cells to die slowly.
In summary, single-agent ofatumumab demonstrated significant clinical benefit with an acceptable toxicity profile in patients with WM. A higher dose of ofatumumab may have contributed to a higher response rate in patients who had a high serum IgM or had received prior rituximab-based therapy. However, the small sample size and the use of the higher dosing regimen for RC and C2 in all patients preclude a definitive conclusion about the optimal ofatumumab dosing regimen in WM. In addition, due to limited follow-up, data are not available regarding whether dosing may impact response duration or PFS.
Immunotherapy offers the potential of clinical efficacy without the marrow toxicity of cytotoxic chemotherapy. Given that WM is an indolent lymphoma in which PFS is the most clinically meaningful endpoint, longer follow-up with updated data will further support the durability of responses and the clinical efficacy of ofatumumab in WM.
Supplementary Material
Research in context.
Evidence before this study
Until recently, no treatments were specifically approved for WM. In January 2015, the FDA approved ibrutinib for patients with WM; however, patients must continue to take tablets daily and it is unclear whether they will be required to do so for life. Alternative treatment options include alkylators and nucleoside analogues; however, these cause myelosuppression and long-term marrow failure. The chimeric anti-CD20 monoclonal antibody rituximab has shown clinical activity in WM, but 40–50% of patients treated with single-agent rituximab experience an IgM flare, which may result in significant morbidity and mortality. Thus, development of novel agents, especially non-chemotherapeutics, is needed in WM.
Added value of this study
Results of this open-label, single-arm study have shown that single-agent ofatumumab shows clinical activity in WM, especially in high-tumour-burden patients, and a manageable safety profile. Results compare favourably with those of rituximab and the incidence of IgM flare seen with ofatumumab (9%) was lower than has previously been reported for rituximab (40–50%). Retreating patients who had initially responded to ofatumumab but later progressed, resulted in responses in the majority of cases. We noted that ofatumumab treatment improved haemoglobin levels, with some patients demonstrating a significant increase (≥3·0 g/dL) in haemoglobin (58%) or resolution of anaemia (54%).
Implications of all the available evidence
Findings from this study may have a major clinical impact and warrant further evaluation. Immunotherapy offers the potential of clinical efficacy without the marrow toxicity of cytotoxic chemotherapy. The response rate and low risk of IgM flare seen with ofatumumab suggests that this therapy may offer a non-chemotherapeutic treatment option for patients with WM, particularly those with high IgM levels. Patients with WM who respond to ofatumumab may also derive clinical benefit from retreatment at subsequent progression.
Acknowledgments
Financial support for this study was provided by GlaxoSmithKline and Genmab. Zoe Crossman (Articulate Science) provided medical editorial assistance for this manuscript. Financial support for medical editorial assistance was provided by Novartis Pharmaceuticals.
Asher Chanan-Khan is a Leukemia and Lymphoma Society (LLS) Scholar in Clinical Research and is a recipient of the LLS and International Waldenstrom’s Macroglobulinemia Foundation (IWMF) grant for Waldenstrom’s Macroglobulinemia research.
Footnotes
Contributors
RRF contributed to the conception and design of the study, patient enrolment, reviewing and approving the manuscript for submission; HAE contributed to data interpretation, reviewing and approving the manuscript for submission; CGD contributed to data collection, data interpretation and analysis, reviewing and approval of the manuscript for submission; CCH contributed to patient enrolment, reviewing and approving the manuscript for submission; SRH contributed to patient enrolment, reviewing and approving the manuscript for submission; JPL contributed to data collection, interpretation and analysis, reviewing and approving the manuscript for submission; MC contributed to patient enrolment, reviewing and approving the manuscript for submission; RA contributed to patient enrolment, reviewing data, reviewing and approving the manuscript for submission; ACK contributed to patient enrolment, reviewing and approving the manuscript for submission; JS contributed to study design, data interpretation, reviewing and approving the manuscript for submission; QML contributed to the study design, statistical analysis, data interpretation, reviewing and approving the manuscript for submission; DS contributed data interpretation and analysis, reviewing and approving the manuscript for submission; RCJ contributed to the study design, data interpretation and analysis, reviewing and approving the manuscript for submission; SL contributed to the study design, data interpretation, reviewing and approving the manuscript for submission; TSL contributed to the study design, data interpretation and analysis, reviewing and approving the manuscript for submission.
Declaration of interests
CGD, JS, QML, DS, RCJ, and TSL were employees of and owned stock in GlaxoSmithKline during the time of study conduct and initial publication development. CGD now works for Pfizer, JS now works for Incyte and TSL now works for Janssen. SL is an employee of and owns stock in Genmab A/S. RRF served as a consultant and member of a speaker bureau for GlaxoSmithKline. JPL has served as a consultant for Novartis Pharmaceuticals. ACK, SRH, CCH, RA, HAE, MC have no conflict of interest to disclose.
References
- 1.Ghobrial IM, Gertz MA, Fonseca R. Waldenström macroglobulinaemia. Lancet Oncol. 2003;4:679–85. doi: 10.1016/s1470-2045(03)01246-4. [DOI] [PubMed] [Google Scholar]
- 2.Owen RG. Developing diagnostic criteria in Waldenstrom’s macroglobulinemia. Semin Oncol. 2003;30:196–200. doi: 10.1053/sonc.2003.50069. [DOI] [PubMed] [Google Scholar]
- 3.Pangalis GA, Kyrtsonis MC, Kontopidou FN, et al. Differential diagnosis of Waldenström’s macroglobulinemia and other B-cell disorders. Clin Lymphoma. 2005;5:235–40. doi: 10.3816/clm.2005.n.006. [DOI] [PubMed] [Google Scholar]
- 4.Leleu X, Soumerai J, Roccaro A, et al. Increased incidence of transformation and myelodysplasia/acute leukemia in patients with Waldenström macroglobulinemia treated with nucleoside analogs. J Clin Oncol. 2009;27:250–5. doi: 10.1200/JCO.2007.15.1530. [DOI] [PubMed] [Google Scholar]
- 5.Leleu X, Tamburini J, Roccaro A, et al. Balancing risk versus benefit in the treatment of Waldenström’s macroglobulinemia patients with nucleoside analogue-based therapy. Clin Lymphoma Myeloma. 2009;9:71–3. doi: 10.3816/CLM.2009.n.018. [DOI] [PubMed] [Google Scholar]
- 6.Treon SP. How I treat Waldenstrom macroglobulinemia. Blood. 2009;114:2375–85. doi: 10.1182/blood-2009-05-174359. [DOI] [PubMed] [Google Scholar]
- 7.Treon SP, Soumerai JD, Branagan AR, et al. Thalidomide and rituximab in Waldenstrom macroglobulinemia. Blood. 2008;112:4452–7. doi: 10.1182/blood-2008-04-150854. [DOI] [PMC free article] [PubMed] [Google Scholar]
- 8.Gertz MA. Waldenström macroglobulinemia: 2012 update on diagnosis, risk stratification, and management. Am J Hematol. 2012;87:503–10. doi: 10.1002/ajh.23192. [DOI] [PubMed] [Google Scholar]
- 9.Byrd JC, White CA, Link B, et al. Rituximab therapy in Waldenstrom’s macroglobulinemia: preliminary evidence of clinical activity. Ann Oncol. 1999;10:1525–7. doi: 10.1023/a:1008350208019. [DOI] [PubMed] [Google Scholar]
- 10.Dimopoulos MA, Zervas C, Zomas A, et al. Treatment of Waldenström’s macroglobulinemia with rituximab. J Clin Oncol. 2002;20:2327–33. doi: 10.1200/JCO.2002.09.039. [DOI] [PubMed] [Google Scholar]
- 11.Dimopoulos MA, Alexanian R, Gika D, et al. Treatment of Waldenstrom’s macroglobulinemia with rituximab: prognostic factors for response and progression. Leuk Lymphoma. 2004;45:2057–61. doi: 10.1080/10428190410001723287. [DOI] [PubMed] [Google Scholar]
- 12.Foran JM, Rohatiner AZ, Cunningham D, et al. European phase II study of rituximab (chimeric anti-CD20 monoclonal antibody) for patients with newly diagnosed mantle-cell lymphoma and previously treated mantle-cell lymphoma, immunocytoma, and small B-cell lymphocytic lymphoma. J Clin Oncol. 2000;18:317–24. doi: 10.1200/JCO.2000.18.2.317. [DOI] [PubMed] [Google Scholar]
- 13.Gertz MA, Rue M, Blood E, Kaminer LS, Vesole DH, Greipp PR. Multicenter phase 2 trial of rituximab for Waldenström macroglobulinemia (WM): an Eastern Cooperative Oncology Group Study (E3A98) Leuk Lymphoma. 2004;45:2047–55. doi: 10.1080/10428190410001714043. [DOI] [PubMed] [Google Scholar]
- 14.Ghobrial IM, Fonseca R, Greipp PR, et al. Initial immunoglobulin M ‘flare’ after rituximab therapy in patients diagnosed with Waldenstrom macroglobulinemia: an Eastern Cooperative Oncology Group Study. Cancer. 2004;101:2593–8. doi: 10.1002/cncr.20658. [DOI] [PubMed] [Google Scholar]
- 15.Treon SP, Branagan AR, Hunter Z, Santos D, Tournhilac O, Anderson KC. Paradoxical increases in serum IgM and viscosity levels following rituximab in Waldenstrom’s macroglobulinemia. Ann Oncol. 2004;15:1481–3. doi: 10.1093/annonc/mdh403. [DOI] [PubMed] [Google Scholar]
- 16.Teeling JL, Mackus WJ, Wiegman LJ, et al. The biological activity of human CD20 monoclonal antibodies is linked to unique epitopes on CD20. J Immunol. 2006;177:362–71. doi: 10.4049/jimmunol.177.1.362. [DOI] [PubMed] [Google Scholar]
- 17.Pawluczkowycz AW, Beurskens FJ, Beum PV, et al. Binding of submaximal C1q promotes complement-dependent cytotoxicity (CDC) of B cells opsonized with anti-CD20 mAbs ofatumumab (OFA) or rituximab (RTX): considerably higher levels of CDC are induced by OFA than by RTX. J Immunol. 2009;183:749–58. doi: 10.4049/jimmunol.0900632. [DOI] [PubMed] [Google Scholar]
- 18.Teeling JL, French RR, Cragg MS, et al. Characterization of new human CD20 monoclonal antibodies with potent cytolytic activity against non-Hodgkin lymphomas. Blood. 2004;104:1793–800. doi: 10.1182/blood-2004-01-0039. [DOI] [PubMed] [Google Scholar]
- 19.Wierda WG, Kipps TJ, Mayer J, et al. Ofatumumab as single-agent CD20 immunotherapy in fludarabine-refractory chronic lymphocytic leukemia. J Clin Oncol. 2010;28:1749–55. doi: 10.1200/JCO.2009.25.3187. [DOI] [PMC free article] [PubMed] [Google Scholar]
- 20.Österborg A, Jewell RC, Padmanabhan-Iyer S, et al. Ofatumumab monotherapy in fludarabine-refractory chronic lymphocytic leukemia: final results from a pivotal study. Haematologica. 2015;100:e311–4. doi: 10.3324/haematol.2014.121459. [DOI] [PMC free article] [PubMed] [Google Scholar]
- 21.Hillmen P, Robak T, Janssens A, et al. Chlorambucil plus ofatumumab versus chlorambucil alone in previously untreated patients with chronic lymphocytic leukaemia (COMPLEMENT 1): a randomised, multicentre, open-label phase 3 trial. Lancet. 2015;385:1873–83. doi: 10.1016/S0140-6736(15)60027-7. [DOI] [PubMed] [Google Scholar]
- 22.Czuczman MS, Kahanic S, Forero A, et al. Results of a phase II study of bendamustine and ofatumumab in untreated indolent B cell non-Hodgkin’s lymphoma. Ann Hematol. 2015;94:633–41. doi: 10.1007/s00277-014-2269-8. [DOI] [PubMed] [Google Scholar]
- 23.Gertz MA. Waldenström macroglobulinemia. Hematology. 2012;17(Suppl 1):S112–116. doi: 10.1179/102453312X13336169156212. [DOI] [PubMed] [Google Scholar]
- 24.Gertz MA, Anagnostopoulos A, Anderson K, et al. Treatment recommendations in Waldenstrom’s macroglobulinemia: consensus panel recommendations from the Second International Workshop on Waldenstrom’s Macroglobulinemia. Semin Oncol. 2003;30:121–6. doi: 10.1053/sonc.2003.50039. [DOI] [PubMed] [Google Scholar]
- 25.Kimby E, Treon SP, Anagnostopoulos A, et al. Update on recommendations for assessing response from the Third International Workshop on Waldenstrom’s Macroglobulinemia. Clin Lymphoma Myeloma. 2006;6:380–3. doi: 10.3816/CLM.2006.n.013. [DOI] [PubMed] [Google Scholar]
- 26.Weber D, Treon SP, Emmanouilides C, et al. Uniform Response Criteria in Waldenstrom’s Macroglobulinemia: Consensus Panel Recommendations From the Second International Workshop on Waldenstroms Macroglobulinemia. Semin Oncol. 2003;30:127–31. doi: 10.1053/sonc.2003.50037. [DOI] [PubMed] [Google Scholar]
- 27.Struemper H, Sale M, Patel BR, et al. Population pharmacokinetics of ofatumumab in patients with chronic lymphocytic leukemia, follicular lymphoma, and rheumatoid arthritis. J Clin Pharmacol. 2014;54:818–27. doi: 10.1002/jcph.268. [DOI] [PubMed] [Google Scholar]
- 28.Morel P, Duhamel A, Gobbi P, et al. International prognostic scoring system for Waldenström macroglobulinemia. Blood. 2009;113:4163–70. doi: 10.1182/blood-2008-08-174961. [DOI] [PubMed] [Google Scholar]
- 29.Arzerra® [prescribing information] Novartis Pharmaceuticals Corporation; East Hanover, NJ: Jan, 2016. http://www.pharma.us.novartis.com/product/pi/pdf/arzerra.pdf. (accessed Jan 2016) [Google Scholar]
Associated Data
This section collects any data citations, data availability statements, or supplementary materials included in this article.