Abstract
Background
Olfactory ensheathing cell transplantation is a promising treatment for spinal cord injury. Diffusion tensor imaging has been applied to assess various kinds of spinal cord injury. However, it has rarely been used to evaluate the beneficial effects of olfactory ensheathing cell transplantation. This study aimed to explore the feasibility of diffusion tensor imaging in the evaluation of functional recovery in rats with olfactory ensheathing cell transplantation after contusive spinal cord injury.
Material/Methods
Immunofluorescence staining was performed to determine the purity of olfactory ensheathing cells. Rats received cell transplantation at week 1 after injury. Basso, Beattie, and Bresnahan score was used to assess the functional recovery. Magnetic resonance imaging was applied weekly, including diffusion tensor imaging. Diffusion tensor tractography was reconstructed to visualize the repair process.
Results
The results showed that olfactory ensheathing cell transplantation increased the functional and histological recovery and restrained the secondary injury process after the initial spinal cord injury. The fractional anisotropy values in rats with cell transplantation were significantly higher than those in the control group, while the apparent diffusion coefficient values were significantly lower. Basso, Beattie, and Bresnahan score was positively and linearly correlated with fractional anisotropy value, and it was negatively and linearly correlated with apparent diffusion coefficient value.
Conclusions
These findings suggest that diffusion tensor imaging parameters are sensitive biomarker indices for olfactory ensheathing cell transplantation interventions, and diffusion tensor imaging scan can reflect the functional recovery promoted by the olfactory ensheathing cell transplantation after contusive spinal cord injury.
MeSH Keywords: Spinal Cord Injuries, Cell Transplantation, Diffusion Tensor Imaging, Magnetic Resonance Imaging
Background
Spinal cord injury (SCI) is a severe form of trauma in the central nerve system (CNS). In the search for treatments to promote recovery after SCI, cell-based therapies have been shown to be effective [1]. Among a series of candidate cell types, olfactory ensheathing cells (OECs), which are derived from olfactory bulb and nasal mucosa [2], have demonstrated beneficial effects in the functional recovery of SCI after transplantation [3–10].
Conventional magnetic resonance imaging (MRI) is a widely used noninvasive technique in the diagnosis of SCI. However, the morphological changes and the signal variations in the conventional MRI images after SCI are not reliable or accurate enough to assess the functional integrity of the injured spinal cord. Diffusion tensor imaging (DTI) is a novel quantitative imaging method based on the diffusion of water molecules in 3 dimensions [11]. DTI has been reported to be more sensitive than conventional MRI in detecting pathophysiology processes and predicting the severity of the injury after SCI [12–19]. Fractional anisotropy (FA), which reflects the anisotropy of the diffusion, and apparent diffusion coefficient (ADC), which reflects the magnitude of the diffusion, are 2 of the most commonly used DTI parameters [13,20]. DTI scans can be reconstructed to generate diffusion tensor tractography (DTT), also known as fiber tractography (FT). DTT is able to identify the injury epicenter, reveal the damaged fiber bundle, and discriminate the interrupted nerve fiber from the intact tracts after various types of SCI [21].
Due to their high sensitivity and accuracy, DTI and DTT have been applied to assess recovery after SCI, with results demonstrating that the DTI parameters are significantly correlated with Basso, Beattie, Bresnahan (BBB) scores [12,15,20]. DTT has been recommended to assess recovery of the injured spinal cord after various kinds of interventions [13]. Moreover, a recent study has demonstrated the morphological and functional changes induced by neural stem cells (NSCs) transplantation after SCI can be detected by DTI [22]. However, DTI and DTT have rarely been applied in the evaluation of OEC-based cell therapies for SCI.
Therefore, the present study was undertaken to explore the feasibility of DTI in the evaluation of functional recovery in rats with OECs transplantation after contusive SCI, especially their correlation with BBB score.
Material and Methods
OEC culture and characterization
Olfactory bulbs were aseptically removed from 2-day-old rats and the meninges and blood vessels were stripped off with fine forceps under a microscope. Tissues were then dissected into small pieces and enzymatically digested with 0.25% trypsin (Sigma) for 5 min at 37°C and 5% CO2. After the termination of digestion, cells were recovered by centrifugation and then placed into culture flasks (25 cm2, Nunclon, Thermo Scientific, Waltham, MA, USA) within the medium consisting of DF-12 medium (1: 1 mixture of DMEM and Ham’s F-12), 10% fetal bovine serum, and 1% penicillin-streptomycin (Sigma). The differential cell adhesion method was applied to purify the primary OECs [23]. OECs were cultured for 7 days, after which they were transplanted into the injured spinal cord. Immunofluorescence was applied to determine the purity of OECs. After purification and primary culture for 7 days, OECs were fixed in 4% paraformaldehyde (PFA) for 20 min. Non-specific protein binding was blocked by a 60-min incubation with 10% goat serum albumin (Sigma). After that, cells were incubated overnight at 4°C with primary antibody (a rabbit anti-rat P75NTR monoclonal antibody, 1: 50 Proteintech, Chicago, IL, USA), followed by incubation for 60 min at room temperature with the secondary antibody (a goat anti-rabbit DyLight 488 antibody, 1;500, Boster, China). DAPI (100 ng/mL) was added for 10 min at room temperature. Then, cells were mounted in 50% glycerol.
Establishment of contusive SCI model and cells transplantation
A total of 48 healthy adult male Sprague-Dawley rats, aged 8 weeks and weighing 250–300 g, were provided by the Experimental Animal Center of Xi’an Jiaotong University of China. The experiment was approved by the Medical Ethics Committee of Xi’an Jiaotong University. Rats were randomly chosen and separated into the control group (n=24) and the OECs group (n=24).
Rats were placed on an electrical heating pad to maintain the body temperature through the entire procedure of anesthesia and operation. Operations were performed under sodium pentobarbital anesthesia (40 mg/kg i.p.) and laminectomy was performed in T9–10 vertebra to expose the spinal cord. The contusive SCI was caused at the T10 segment by using the NYU weight-drop impactor (New York University, New York, USA) with a 10-g rod dropped from a height of 25.0 mm. Immediately after the contusion, hemorrhage and edema in the injured area appeared and rats exhibited tail wagging, hindlimb fluttering, and, eventually, flaccid paralysis. Afterwards, the muscles and skins were sutured in separate layers. Rats were maintained with free access to food and water and artificial urination was performed twice every day until normal function returned. Buprenorphine (0.01 mg/kg i.p.) and Gentamicin (5 mg/kg i.p.) were administered immediately after the surgery and then daily for 3 days and 7, days respectively.
One week after the injury, all the rats were anesthetized with 40 mg/kg i.p. sodium pentobarbital and the injury site was exposed. Rats in the OECs group (n=24) received the OECs transplantation. A total of 2 μl suspension containing 1×10⁶ OECs was injected into the epicenter of the contused area during a time course of 6 min using a 10-μl Hamilton syringe (Hamilton #701; Hamilton, Reno, NV, USA) with a glass pipette (100 μm diameter) held in a micromanipulator. The injection pipette was kept in place for an additional 3 min to avoid liquid withdraw. Rats in the control group (n=24) were injected with 2 μl culture medium. After the injection, the muscle layers and the skin were closed separately.
Hindlimb motor function assessment
Motor behavior during open-field walking was evaluated by 2 independent and blinded researchers at 2 h, day 3, week 1, week 2, week 3, week 4, week 5, week 6, week 7, and week 8 after injury according to the Basso, Beattie, and Bresnahan (BBB) scale [24], ranging from 0 (no movement) to 21 (normal movement).
MRI and DTI scan
A total of 12 rats (6 rats per group) were randomly chosen to undergo MRI and DTI scanning at week 2, week 4, week 6, week 8 after injury. An electrical heating pad was used to maintain the body temperature through the entire procedure of anesthesia, and all the scans were performed in the affiliated hospital with an air conditioning system. After the sodium pentobarbital anesthesia (40 mg/kg i.p.), rats were placed in supine position within a specialized coil, which was able to maintain the uniformity of the magnetic field and fix the rats to a settled place. All the scans were performed using a 3.0 Tesla MR scanner (Signa, GE Medical Systems, Milwaukee, WI, USA).
Conventional 3.0 T MRI scan
SE sequence was used to complete the conventional MRI scan, which includes T1-weighted and T2-weighted images (T1WI and T2WI). The total scan time of T1WI and T2WI for a rat was 5 min. The repetition time (TR) and echo time (TE) for T1WI were 560 ms and 11.3 ms, respectively. TR 2600 ms and TE 120 ms were applied for T2WI. The image matrix for both T1 WI and T2WI was 256×256, slice thickness was 1.5 mm, and contiguous slices=6.
3.0 T DTI scan
After the localization of the injury area by conventional MRI scanning, auto-prescan was conducted to accommodate the uniformity of the magnetic field at the scan region. Then, single-shot spin-echo planar imaging (EPI) sequence was applied to perform the 3.0 T DTI scan from 1 segment rostral of the injury site to 1 segment caudal of the injury site (3 segments in total). The total scan time of DTI for a rat was about 12 min. The relevant parameters for DTI scan were: TR=4000 ms, TE=88 ms, slice thickness=3 mm, b factor=1000 s/mm2, band width=200 kHz, 25 gradient encoding directions, acquisition matrix=64×64, and field of view=10×10 mm. All data were transferred to a separate workstation (Advantage Windows Workstation, version 4.2, GE Healthcare, Waukesha, WI, USA) to generate the quantitative DTI parameter (FA value and ADC value). DTT was reconstructed using the FACT algorithm implemented in Volume-One software with FA threshold <0.2 and stopping angle >25. The FA value and ADC value in the region of interest (spinal cord injury epicenter), which was selected by 2 independent researchers, were recorded to explore their correlations with BBB score.
Perfusion and tissue processing
Rats were randomly chosen and sacrificed at week 2, week 4, week 6, and week 8 after injury (n =6 for each group at each time point). After deep anesthesia by sodium pentobarbital (40 mg/kg, i.p.), rats were transcardially perfused with 0.9% saline followed by 4% paraformaldehyde. The spinal cord segment from 1 cm caudal to 1 cm rostral of the injury site was extracted from the vertebral column and then post-fixed in 4% paraformaldehyde overnight at 4°C. The spinal cord segments were dehydrated through an ascending series of ethanol solutions, cleared with xylene, and then embedded in paraffin. Afterwards, the paraffin blocks were cut into transverse serial sections of 7-μm thickness.
Hematoxylin-eosin staining
Sections were immersed in xylene, rehydrated by decreasing series of ethanol, and washed in PBS, then submerged in hematoxylin for 4 min. The sections were washed in water followed by 1% HCl in ethanol solution for 30 s. After staining with eosin for 6 min, sections were dehydrated through increasing concentrations of ethanol and xylene.
Statistical analysis
Injury areas on T1WI and T2WI were quantified and calculated using Image Pro Plus 6 (Media Cybernetics, USA). Statistical analysis was performed using SPSS 23.0 software (SPSS Inc, Chicago, IL, USA). Results are presented as mean ±SD with n representing the number of replicates. Student’s unpaired t-test was used to evaluate statistical significance between 2 groups at a certain time point and two-way ANOVA was used for multiple comparison. Pearson correlation analysis was applied to explore the correlation between FA, ADC, and BBB score. P<0.05 was considered as the criterion of statistical significance in all the comparisons.
Results
Characterization of olfactory ensheathing cells by immunofluorescence
Random areas (n=5) were photographed under 200× magnification using a fluorescence microscopy. The percentage of P75NTR-positive cells was calculated by comparing the number of DAPI-labeled nuclei with the number of P75NTR immunoreactive cells. Our data indicated 91±2.66% of cells were P75NTR-positive (Figure 1).
Figure 1.
Immunofluorescence staining of OECs. OECs in culture with immunostaining of nuclear (DAPI) and P75NTR (×200). Scale bar is 50 μm.
Hindlimb motor function recovery evaluated by BBB score
The BBB score was significantly decreased after contusive SCI and gradually increased with time (Figure 2). There were significant differences between the 2 groups over time (two-way ANOVA, P<0.05). At day 3 and week 1 after injury, there were no significant differences between the control group and the OECs group. However, at week 2 after injury (1 week after the OECs transplantation), the BBB score of the OECs group was significantly higher than in the control group (P<0.05) and the significant difference was retained to week 8 after injury (P<0.05).
Figure 2.
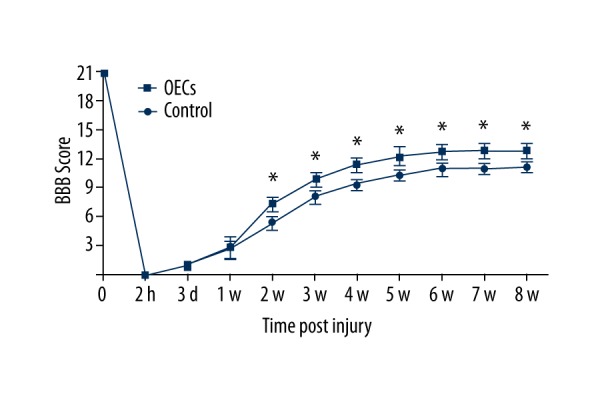
BBB score of rats after contusive spinal cord injury. The number of rats (n) for each group at each time point is 24. Data are represented as mean ±SD. The result indicated significant differences between 2 groups after OECs transplantation (two-way ANOVA, P<0.05). Student’s unpaired t-test was performed between 2 groups at each time point. * P<0.05 OECs group vs. time-matched control group.
Effective effects of the transplanted OECs visualized by MRI and DTT images
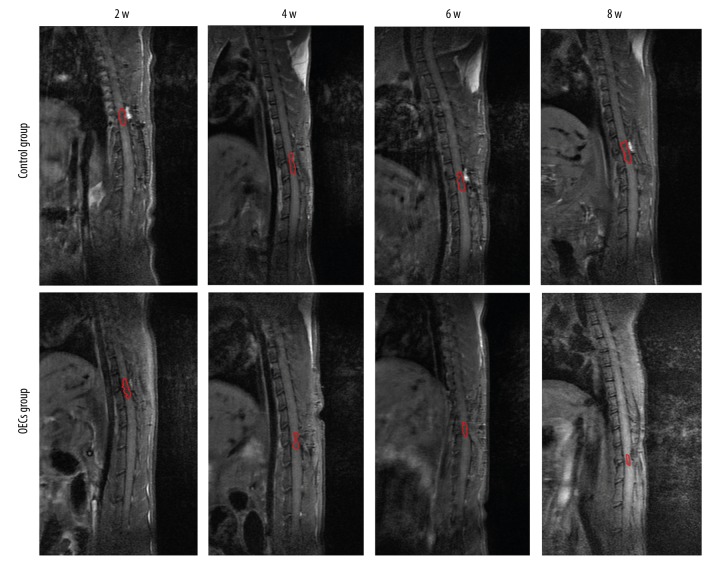
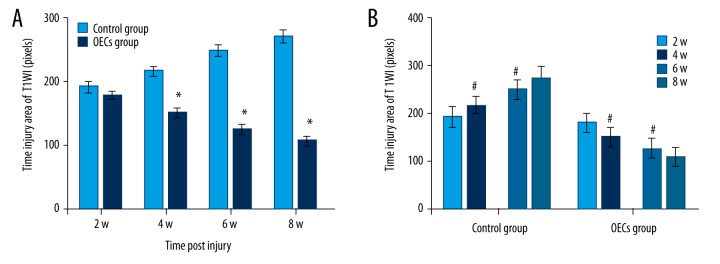
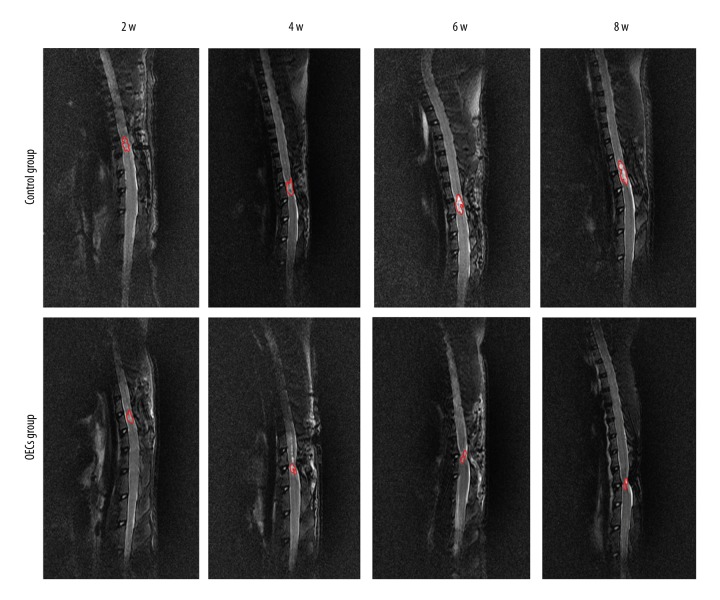
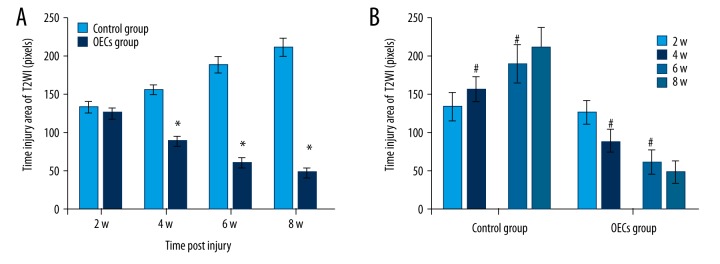
Conventional MRI showed the injury area, which was represented as the hypointense region in the T1WI (Figure 3). Compared to the OECs group, the injury area in the control group was significantly larger at week 4, week 6 and week 8 after injury (P<0.05) (Figure 4A). The injury area increased significantly in the control group (P<0.05) and decreased significantly in the OECs group (P<0.05) at week 4 and week 6 (Figure 4B). Conventional MRI T2WI clearly revealed the repair process after SCI and also the difference between the 2 groups (Figure 5). After the injury, a hyperintense region, which indicated the injury area, was seen in both groups. The injury area in the OECs group was significantly smaller than in the time-matched control group at week 4 to week 8 (P<0.05) (Figure 6A). Moreover, the injury region in the OECs group depicted a significant shrinkage at week 4 and week 6 (P<0.05) (Figure 6B). However, the injury region in the control group extended significantly from the injury site at week 4 and week 6 (P<0.05).
Figure 3.
T1-weighted images (T1WI) of the spinal cord after contusive spinal cord injury. T1WI showed that the signals at the injury site were decreased after contusive spinal cord injury. Red circles refer to the spinal cord injury site.
Figure 4.
The injury area of T1WI after contusive spinal cord injury. Data of rats for each group (n=6) at each time point after injury were analyzed and are presented as mean ±SD. (A) The injury area of T1WI between 2 groups were compared at week 2, week 4, week 6, and week 8 after injury. (B) Comparisons were performed between 2 adjacent time points in each group. * P<0.05 OECs group vs. time-matched control group. # P<0.05 current time point vs. previous time point.
Figure 5.
T2-weighted images (T2WI) of the spinal cord after contusive spinal cord injury. T2WI revealed a hyperintense region at the injury area after contusive spinal cord injury. Red circles represent the spinal cord injury site.
Figure 6.
The injury area of T2WI after contusive spinal cord injury. The injury area of T2WI in each group (n=6) at each time point were calculated and data are presented as mean ±SD. (A) Comparisons of the injury area between 2 groups at each time after injury were conducted. (B) The injury areas of 2 consecutive time points in each group were analyzed. * P<0.05 OECs group vs. time-matched control group. # P<0.05 current time point vs. previous time point.
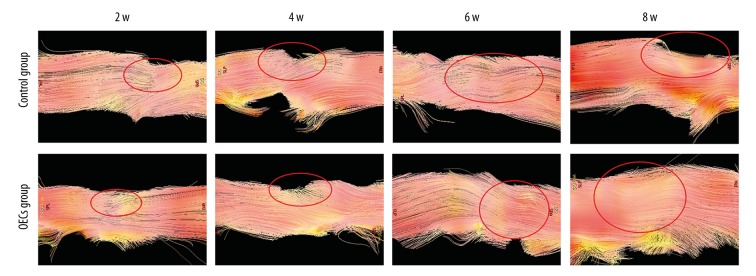
Spinal cord structure was clearly detected by DTT (Figure 7). At week 2 after surgery, DTT of both groups showed the interruption of nerve fibers. At week 4 after injury, besides the irregularity of the nerve fiber, depression at the injured site of the spinal cord appeared. At week 6 and week 8 after injury, the disruption of the fiber tracks and the depression at the injury site were still obvious. Compared to the OECs group, the spinal cord depression at week 6 and week 8 after injury in the control group seemed to be more severe.
Figure 7.
Diffusion tensor tractography (DTT) images of the spinal cord after contusive spinal cord injury. DTT depicted the overall shape of the injury area. Spinal cord nerve fibers were interrupted and the injury sites are marked by red circles.
Changes of FA and ADC values after OECs transplantation determined by DTI
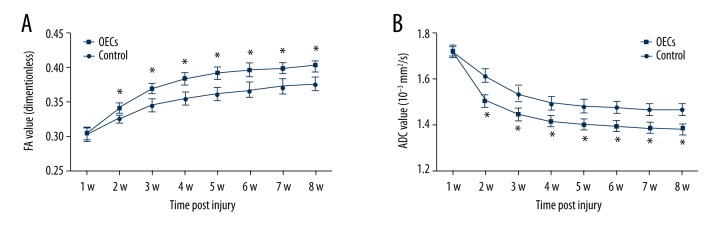
FA values increased gradually while ADC value decreased gradually (Figure 8). There were significant differences between the 2 groups after the OECs transplantation in both FA and ADC values (two-way ANOVA, P<0.05). From 1 week after the OECs transplantation (week 2 after injury to week 8 after injury), FA values in the OECs group were significantly higher than in the control group (P<0.05) (Figure 8A), while ADC values in the OECs group were significantly lower than in the control group (P<0.05) (Figure 8B).
Figure 8.
The fractional anisotropy (FA) value and apparent diffusion coefficient (ADC) (10−3 mm2/s) at the lesion segment after contusive spinal cord injury. Data of rats (n=6) for each group at each time point are represented as mean ±SD. (A) FA values increased gradually after SCI and there were significant differences between the 2 groups after OECs transplantation (two-way ANOVA, P<0.05). (B) ADC values gradually decreased after SCI and there were significant differences between the 2 groups after OECs transplantation (two-way ANOVA, P<0.05). Student’s unpaired t-test was performed to compare 2 groups at each time point. * P<0.05 OECs group vs. time-matched control group.
Correlation between DTI parameters and hindlimb function score after contusive spinal cord injury
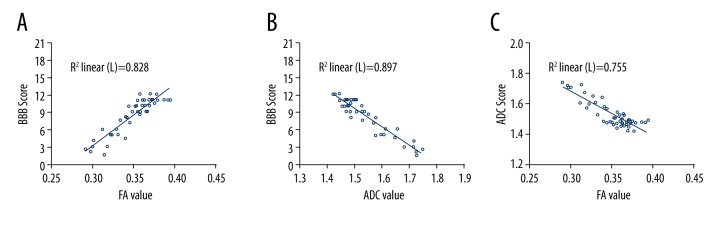
Pearson correlation analysis indicated that in the control group, FA values had a positive and linear correlation with BBB scores (r=0.910, P<0.01; Figure 9A). ADC values were negatively correlated with BBB scores and the correlation was linear (r=−0.947, P<0.01; Figure 9B). FA values and ADC values were negatively and linearly correlated (r=−0.869, P<0.01; Figure 9C).
Figure 9.
Correlation between DTI parameters and BBB score in the control group (Pearson correlation analysis). (A) FA values in the control group were positively correlated with BBB scores and the correlation was linear (r=0.910, P<0.01). (B) ADC values had a negative and linear correlation with BBB scores (r=−0.947, P<0.01). (C) FA values and ADC values were negatively and linearly correlated (r=−0.869, P<0.01).
Correlation between DTI parameters and hindlimb function score after OECs transplantation
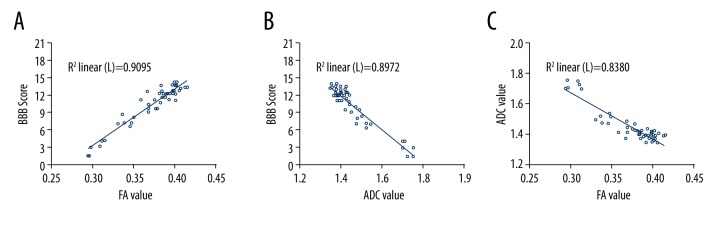
FA values of the OECs group were positively and linearly correlated with BBB score (r=0.954, P<0.01; Figure 10A), while ADC values were negatively and linearly correlated with BBB score (r=−0.947, P<0.01; Figure 10B). FA values and ADC values of the OECs group were negatively and linearly correlated (r=−0.915, P<0.01; Figure 10C).
Figure 10.
Correlation between DTI parameters and BBB score in the OECs group (Pearson correlation analysis). (A) The correlation between FA values and BBB scores in the OECs group were positive and linear (r=0.954, P<0.01). (B) ADC values were negatively and linearly correlated with BBB scores (r=−0.947, P<0.01). (C) FA values and ADC values had a negative and linear correlation in the OECs group (r=−0.915, P<0.01).
Histological changes of the injury site revealed by hematoxylin and eosin (HE) staining
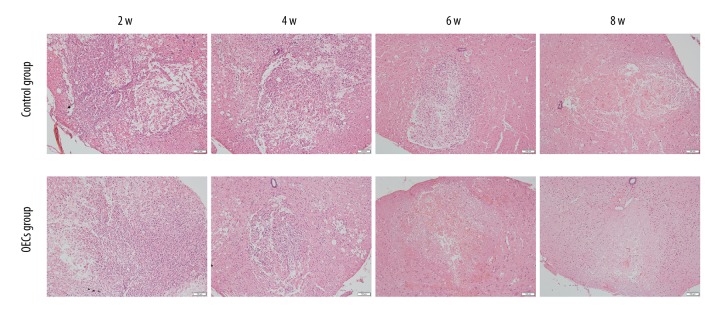
HE staining revealed the histological changes at the injury epicenter under 100× magnification (Figure 11). At week 2 and week 4 after injury, disorganization of the injured spinal cord, infiltration of the inflammatory cells, and the formation of the cavity were confirmed in both groups, and the differences of the histological changes between the control group and OECs group were not apparent. However, at week 6 after injury, compared to the control group, the infiltration of the inflammatory cells was clearly alleviated in the OECs group. At week 6 and week 8 after injury, the scar formation in the OECs group was more obvious than in the control group.
Figure 11.
Hematoxylin and eosin (HE) staining of lesion site. HE staining revealed the histological changes at the injury area after contusive spinal cord injury. All cell nuclei were stained dark purple. Cytoplasm was stained pink. Scale bar is 200 μm.
Discussion
Cell-based therapy has been considered as a promising candidate for the treatment of SCI [1]. The therapeutic effects of the grafted cells are mainly assessed by hindlimb function scores and histopathological findings. Radiological exams, which are noninvasive and commonly used in the clinical diagnosis of SCI, have rarely been applied in the evaluation of cell-based therapies for SCI. Due to the higher sensitivity and accuracy than conventional MRI, DTI has been used to detect functional recovery after various kinds of SCI [12,16,20,21] and the beneficial effects of NSCs transplantation after SCI have also been confirmed by DTI scan [22]. In the present study, DTI scan and its parameters (FA and ADC values) at the lesion epicenter were used to assess hindlimb functional recovery of contusive SCI after OECs transplantation. The results of this study indicate that DTI scan is sensitive to the therapeutic effects of OECs transplantation. The functional recovery promoted by the cell transplantation was accompanied by higher FA values and lower ADC values in the OECs group than in the control group. The correlations between DTI parameters and BBB score, DTT, which is reconstructed by the DTI scan, clearly identified the injury site and discriminated the interrupted nerve fiber from the intact tracts. To the best of our knowledge, this is the first study performed to assess the feasibility of DTI scan in the evaluation of functional recovery after OECs transplantation.
The therapeutic outcomes of OECs transplantation are significantly affected by the culture method and timing of transplantation. It has been recommended that short-term cultured OECs purified with the method of differential cell adhesion could have better therapeutic effects [25–27]. Therefore, in the present study, OECs were purified by the differential cell adhesion method and cultured for 7 days before transplantation. The purity of OECs at day 7 in culture was verified to be 91±2.66% by P75NTR immunofluorescence staining. Due to the severe inflammatory response, which is hostile to the transplanted cells at the acute stage of SCI, 1 week after initial trauma has been widely used as a delayed transplantation time point [6,28,29]. The BBB score indicated all the rats were paralysed at 2 h after the surgery, which affirmed the successful modeling of contusive SCI. Functional recovery of rats in the 2 groups was demonstrated by the gradual increase of BBB scores. Moreover, the therapeutic effect of the grafted OECs in promoting hindlimb functional recovery was confirmed by the higher BBB scores in the OECs group. However, due to the laminectomy without stabilization at the injury segment, lordosis occurred in all rats and hampered the plantar stepping and limited the functional recovery to a certain extent.
Conventional MRI is considered as the criterion standard radiological method in the clinical diagnosis of SCI. In the present study, the spinal cord injury region in T1WI and T2WI of the control group extended significantly at both rostral and caudal directions at week 4 and week 6 after injury. This extension demonstrated the pathological changes after SCI and indicated the secondary injury process after the initial spinal cord trauma [30–32]. However, the injury area in T1WI and T2WI of the OECs group was significantly smaller than in the time-matched control group. Moreover, the statistical analysis revealed a significant shrinkage over time of the injury region in T1WI and T2WI of the OECs group. The smaller injury area, along with its shrinkage, verified the therapeutic effects of OECs transplantation to limit secondary spinal cord injury. Corresponding to the signal changes in conventional MRI scans, the alleviation of the inflammatory cells and the acceleration of the repair process revealed by our HE staining results confirmed the histological recovery promoted by the OECs transplantation. DTT was applied in this study to provide additional information that conventional MRI cannot offer. Our DTT results revealed the overall shape of the injury epicenter and presented the axonal integrity and depression of the spinal cord. Due to the edema after cell transplantation, the depression was not obvious at week 2. However, the interrupted nerve fibers after SCI and the depression of the injured spinal cord at week 4 to week 8 after injury indicated that DTT has superiority over conventional MRI in visualizing spinal cord fibers.
Compared to the conventional MRI, DTI scanning demonstrated the superiority as its parameters provide quantitative information about tissue microstructure and DTT visualized the injury epicenter and depicted the interrupted spinal cord tracts. It has been reported that axonal structure can limit the diffusion resistance and diffusion displacement of water molecules, which makes DTI parameters correlated with nerve degeneration and axonal loss [33,34]. Studies have demonstrated a significant decrease of FA values and an increase of ACD values at the injury site right after the injury [13,16,35]. The change patterns of DTI parameters are mainly caused by the disintegration of myelin and axonal degeneration. In addition, the increased blood-spinal cord barrier (BSCB) permeability, efflux of the intracellular ions, and the microperfusion disturbances are also related to the variations of DTI parameters immediately after SCI [36]. In the recovery progression of SCI, FA values gradually increase and ADC values gradually decrease due to the axonal regeneration, ion flux across axons, and glia scar formation, which reduce the diffusion of water molecules [20,21]. Results of the present study confirmed the changed patterns of DTI parameters after SCI, and the higher FA values and lower ADC values in the OECs group after SCI demonstrated the DTI parameters were sensitive to the beneficial effects of OECs transplantation.
BBB scores in this study were verified to be correlated with the FA values and ADC values. DTI results can be affected by inflammation after SCI because the myelin disintegration and axonal degeneration are related to the inflammatory response after the initial spinal cord trauma. Functional measurements are also affected by inflammatory pathology because the spared axons and the influx of phagocytic cells probably mediate the early recovery of locomotor function [37]. Therefore, the correlation between DTI parameters and BBB scores was probably mediated by the inflammatory pathology. Our results indicate that DTI parameters can be used to assess the functional recovery after OECs transplantation in rats with SCI.
Our study has some limitations. First, the beneficial effects of OECs transplantation were confirmed by the promotion of functional recovery, signal changes of MRI, variation of DTI and DTT, and the histological results of HE staining. More research is needed to explore the therapeutic effects of grafted cells. Second, axon staining, myelin staining, and neuron staining should be performed to further explore the correlation between DTI and neural regeneration after OECs transplantation.
Conclusions
The present study demonstrates the DTI parameters are useful biomarker indices for OECs transplantation interventions after SCI, and DTI scan can be used as a sensitive and quantitative measurement in the evaluation of functional recovery after OECs transplantation. This study is an initial step toward the application of DTI scan in the assessment of OECs transplantation. Our results are encouraging and warrant further research.
Acknowledgements
The authors thank Jialin Zhu and Zhijian Cheng for technical help. The laboratory was kindly provided by Professor Jinghong Chen, from the local Disease Research Institute.
Footnotes
Conflict of interest
All of the authors claim that there are no conflicts of interest.
Source of support: This research was financially supported by the National Natural Science Foundation of China (No. 81571209 and No. 81601081) and the Project of Science and Technology Plan in Xi’an in 2016 (No. 2016048sf/yx)
References
- 1.Tetzlaff W, Okon EB, Karimi-Abdolrezaee S, et al. A Systematic review of cellular transplantation therapies for spinal cord injury. J Neurotrauma. 2011;28:1611–82. doi: 10.1089/neu.2009.1177. [DOI] [PMC free article] [PubMed] [Google Scholar]
- 2.Franssen EHP, de Bree FM, Verhaagen J. Olfactory ensheathing glia: Their contribution to primary olfactory nervous system regeneration and their regenerative potential following transplantation into the injured spinal cord. Brain Res Rev. 2007;56:236–58. doi: 10.1016/j.brainresrev.2007.07.013. [DOI] [PubMed] [Google Scholar]
- 3.Li Y, Field PM, Raisman G. Regeneration of adult rat corticospinal axons induced by transplanted olfactory ensheathing cells. J Neurosci. 1998;18:10514–24. doi: 10.1523/JNEUROSCI.18-24-10514.1998. [DOI] [PMC free article] [PubMed] [Google Scholar]
- 4.Lopez-Vales R, Fores J, Verdu E, Navarro X. Acute and delayed transplantation of olfactory ensheathing cells promote partial recovery after complete transection of the spinal cord. Neurobiol Dis. 2006;21:57–68. doi: 10.1016/j.nbd.2005.06.011. [DOI] [PubMed] [Google Scholar]
- 5.Lu J, Feron F, Mackay-Sim A, Waite PME. Olfactory ensheathing cells promote locomotor recovery after delayed transplantation into transected spinal cord. Brain. 2002;125:14–21. doi: 10.1093/brain/awf014. [DOI] [PubMed] [Google Scholar]
- 6.Pearse DD, Sanchez AR, Pereira FC, et al. Transplantation of Schwann cells and/or olfactory ensheathing glia into the contused spinal cord: Survival, migration, axon association, and functional recovery. Glia. 2007;55:976–1000. doi: 10.1002/glia.20490. [DOI] [PubMed] [Google Scholar]
- 7.Plant GW, Christensen CL, Oudega M, Bunge MB. Delayed transplantation of olfactory ensheathing glia promotes sparing/regeneration of supraspinal axons in the contused adult rat spinal cord. J Neurotrauma. 2003;20:1–16. doi: 10.1089/08977150360517146. [DOI] [PubMed] [Google Scholar]
- 8.Ramer LM, Au E, Richter MW, et al. Peripheral olfactory ensheathing cells reduce scar and cavity formation and promote regeneration after spinal cord injury. J Comp Neurol. 2004;473:1–15. doi: 10.1002/cne.20049. [DOI] [PubMed] [Google Scholar]
- 9.Sasaki M, Lankford KL, Zemedkun M, Kocsis JD. Identified olfactory ensheathing cells transplanted into the transected dorsal funiculus bridge the lesion and form myelin. J Neurosci. 2004;24:8485–93. doi: 10.1523/JNEUROSCI.1998-04.2004. [DOI] [PMC free article] [PubMed] [Google Scholar]
- 10.Ziegler MD, Hsu D, Takeoka A, et al. Further evidence of olfactory ensheathing glia facilitating axonal regeneration after a complete spinal cord transection. Exp Neurol. 2011;229:109–19. doi: 10.1016/j.expneurol.2011.01.007. [DOI] [PMC free article] [PubMed] [Google Scholar]
- 11.Basser PJ. Inferring microstructural features and the physiological state of tissues from diffusion-weighted images. NMR Biomed. 1995;8:333–44. doi: 10.1002/nbm.1940080707. [DOI] [PubMed] [Google Scholar]
- 12.Kelley BJ, Harel NY, Kim CY, et al. Diffusion tensor imaging as a predictor of locomotor function after experimental spinal cord injury and recovery. J Neurotrauma. 2014;31:1362–73. doi: 10.1089/neu.2013.3238. [DOI] [PMC free article] [PubMed] [Google Scholar]
- 13.Konomi T, Fujiyoshi K, Hikishima K, et al. Conditions for quantitative evaluation of injured spinal cord by in vivo diffusion tensor imaging and tractography: Preclinical longitudinal study in common marmosets. Neuroimage. 2012;63:1841–53. doi: 10.1016/j.neuroimage.2012.08.040. [DOI] [PubMed] [Google Scholar]
- 14.Loy DN, Kim JH, Xie M, et al. Diffusion tensor Imaging predicts hyperacute spinal cord injury severity. J Neurotrauma. 2007;24:979–90. doi: 10.1089/neu.2006.0253. [DOI] [PubMed] [Google Scholar]
- 15.Patel SP, Smith TD, VanRooyen JL, et al. Serial diffusion tensor imaging in vivo predicts long-term functional recovery and histopathology in rats following different severities of spinal cord injury. J Neurotrauma. 2016;33:917–28. doi: 10.1089/neu.2015.4185. [DOI] [PMC free article] [PubMed] [Google Scholar]
- 16.Li XH, Li JB, He XJ, et al. Timing of diffusion tensor imaging in the acute spinal cord injury of rats. Sci Rep. 2015;5:12639. doi: 10.1038/srep12639. [DOI] [PMC free article] [PubMed] [Google Scholar]
- 17.Chang Y, Jung TD, Yoo DS, Hyun JK. Diffusion tensor imaging and fiber tractography of patients with cervical spinal cord injury. J Neurotrauma. 2010;27:2033–40. doi: 10.1089/neu.2009.1265. [DOI] [PubMed] [Google Scholar]
- 18.Mulcahey MJ, Samdani A, Gaughan J, et al. Diffusion tensor imaging in pediatric spinal cord injury preliminary examination of reliability and clinical correlation. Spine. 2012;37:E797–803. doi: 10.1097/BRS.0b013e3182470a08. [DOI] [PubMed] [Google Scholar]
- 19.Song T, Chen WJ, Yang B, et al. Diffusion tensor imaging in the cervical spinal cord. Eur Spine J. 2011;20:422–28. doi: 10.1007/s00586-010-1587-3. [DOI] [PMC free article] [PubMed] [Google Scholar]
- 20.Zhang D, Li XH, Zhai X, He XJ. Feasibility of 3.0 T diffusion-weighted nuclear magnetic resonance imaging in the evaluation of functional recovery of rats with complete spinal cord injury. Neural Regen Res. 2015;10:412–18. doi: 10.4103/1673-5374.153689. [DOI] [PMC free article] [PubMed] [Google Scholar]
- 21.Wang F, Huang SL, He XJ, Li XH. Determination of the ideal rat model for spinal cord injury by diffusion tensor imaging. Neuroreport. 2014;25:1386–92. doi: 10.1097/WNR.0000000000000278. [DOI] [PMC free article] [PubMed] [Google Scholar]
- 22.Jirjis MB, Valdez C, Vedantam A, et al. Diffusion tensor imaging as a biomarker for assessing neuronal stem cell treatments affecting areas distal to the site of spinal cord injury. J Neurosurg Spine. :2016. doi: 10.3171/2016.5.SPINE151319. [Epub ahead of print] [DOI] [PubMed] [Google Scholar]
- 23.Nash HH, Borke RC, Anders JJ. New method of purification for establishing primary cultures of ensheathing cells fom the adult olfactory bulb. Glia. 2001;34:81–87. doi: 10.1002/glia.1043. [DOI] [PubMed] [Google Scholar]
- 24.Basso DM, Beattie MS, Bresnahan JC. A sensitive and reliable locomotor rating-scale for open-field testing in rats. J Neurotrauma. 1995;12:1–21. doi: 10.1089/neu.1995.12.1. [DOI] [PubMed] [Google Scholar]
- 25.Au E, Richter MW, Vincent AJ, et al. SPARC from olfactory ensheathing cells stimulates Schwann cells to promote neurite outgrowth and enhances spinal cord repair. J Neurosci. 2007;27:7208–21. doi: 10.1523/JNEUROSCI.0509-07.2007. [DOI] [PMC free article] [PubMed] [Google Scholar]
- 26.Pastrana E, Moreno-Flores MT, Gurzov EN, et al. Genes associated with adult axon regeneration promoted by olfactory ensheathing cells: A new role for matrix metalloproteinase 2. J Neurosci. 2006;26:5347–59. doi: 10.1523/JNEUROSCI.1111-06.2006. [DOI] [PMC free article] [PubMed] [Google Scholar]
- 27.Radtke C, Lankford KL, Wewetzer K, et al. Impaired spinal cord remyelination by long-term cultured adult porcine olfactory ensheathing cells correlates with altered in vitro phenotypic properties. Xenotransplantation. 2010;17:71–80. doi: 10.1111/j.1399-3089.2009.00562.x. [DOI] [PubMed] [Google Scholar]
- 28.Torres-Espin A, Redondo-Castro E, Hernandez J, Navarro X. Bone marrow mesenchymal stromal cells and olfactory ensheathing cells transplantation after spinal cord injury – a morphological and functional comparison in rats. Eur J Neurosci. 2014;39:1704–17. doi: 10.1111/ejn.12542. [DOI] [PubMed] [Google Scholar]
- 29.Pearse DD, Marcillo AE, Oudega M, et al. Transplantation of Schwann cells and olfactory ensheathing glia after spinal cord injury: Does pretreatment with methylprednisolone and interleukin-10 enhance recovery? J Neurotrauma. 2004;21:1223–39. doi: 10.1089/neu.2004.21.1223. [DOI] [PubMed] [Google Scholar]
- 30.Ambrozaitis KV, Kontautas E, Spakauskas B, Vaitkaitis D. [Pathophysiology of acute spinal cord injury]. Medicina (Kaunas) 2006;42:255–61. [PubMed] [Google Scholar]
- 31.Dumont RJ, Okonkwo DO, Verma RS, et al. Acute spinal cord injury, part I: Pathophysiologic mechanisms. Clinical Neuropharmacology. 2001;24:254–64. doi: 10.1097/00002826-200109000-00002. [DOI] [PubMed] [Google Scholar]
- 32.Popovich PG, Wei P, Stokes BT. Cellular inflammatory response after spinal cord injury in Sprague-Dawley and Lewis rats. J Comp Neurol. 1997;377:443–64. doi: 10.1002/(sici)1096-9861(19970120)377:3<443::aid-cne10>3.0.co;2-s. [DOI] [PubMed] [Google Scholar]
- 33.Deboy CA, Zhang J, Dike S, et al. High resolution diffusion tensor imaging of axonal damage in focal inflammatory and demyelinating lesions in rat spinal cord. Brain. 2007;130:2199–210. doi: 10.1093/brain/awm122. [DOI] [PubMed] [Google Scholar]
- 34.Mukherjee P. Diffusion tensor imaging and fiber tractography in acute stroke. Neuroimag Clin N Am. 2005;15:655–65. xii. doi: 10.1016/j.nic.2005.08.010. [DOI] [PubMed] [Google Scholar]
- 35.Rajasekaran S, Kanna RM, Shetty AP, Ilayaraja V. Efficacy of diffusion tensor anisotropy indices and tractography in assessing the extent of severity of spinal cord injury: An in vitro analytical study in calf spinal cords. Spine J. 2012;12:1147–53. doi: 10.1016/j.spinee.2012.10.032. [DOI] [PubMed] [Google Scholar]
- 36.Kim JH, Loy DN, Liang HF, et al. Noninvasive diffusion tensor imaging of evolving white matter pathology in a mouse model of acute spinal cord injury. Magn Reson Med. 2007;58:253–60. doi: 10.1002/mrm.21316. [DOI] [PubMed] [Google Scholar]
- 37.Brustein E, Rossignol S. Recovery of locomotion after ventral and ventrolateral spinal lesions in the cat. I. Deficits and adaptive mechanisms. J Neurophysiol. 1998;80:1245–67. doi: 10.1152/jn.1998.80.3.1245. [DOI] [PubMed] [Google Scholar]


