

Abstract
Ruthenium coordination complexes have the potential to serve as novel theranostic agents for cancer. However, a major limitation in their clinical implementation is effective tumor accumulation. In this study, we have developed a liposome-based theranostic nanodelivery system for [Ru(phen)2dppz](ClO4)2 (Lipo-Ru). This ruthenium polypyridine complex emits a strong fluorescent signal when incorporated in the hydrophobic lipid bilayer of the delivery vehicle or in the DNA helix, enabling visualization of the therapeutic agent in tumor tissues. Incubation of MDA-MB-231 breast cancer cells with Lipo-Ru induced double-strand DNA breaks and triggered apoptosis. In a mouse model of triple-negative breast cancer, treatment with Lipo-Ru dramatically reduced tumor growth. Biodistribution studies of Lipo-Ru revealed that more than 20% of the injected dose accumulated in the tumor. These results suggest that Lipo-Ru could serve as a promising theranostic platform for cancer.
Keywords: Liposome, nanoplatform, ruthenium polypyridine complex, theranostic, triple-negative breast cancer
TOC
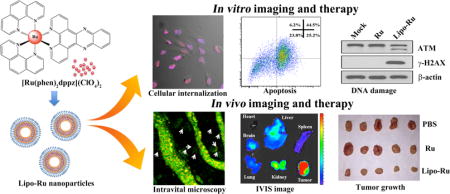
A theranostic liposome-based nanodelivery platform for the ruthenium polypyridyl complex [Ru(phen)2dppz](ClO4)2 (Lipo-Ru) was designed for the treatment and imaging of triple-negative breast cancer. ATM, ataxia telangiectasia mutated; IVIS, in vivo preclinical imaging system.
Metal-based anticancer agents prevent cancer cell division and trigger cancer cell apoptosis by inducing DNA damage and disrupting DNA repair processes such as ligand substitutions.1, 2 The most well-known metal-based chemotherapy drug is cisplatin, which was approved by the United States Food and Drug Administration (FDA) in 1978.3 However, this platinum-based drug has several adverse side effects, such as renal toxicity, myelosuppression, nausea, vomiting, and totoxicity, which frequently limit its use in the clinic.4, 5 Compared to cisplatin, ruthenium (Ru)-based complexes have limited side effects.6 Notably, Ru has a range of unique oxidation states (II, III, and IV) that contribute to the anticancer activity of this compound.1,7,8 Moreover, some ruthenium agents display higher therapeutic efficacy against cancer metastases compared to primary tumors.9 Although Ru complexes have not yet been approved for clinical application, they provide an attractive alternative to platinum-based therapeutics. To date, two Ru-based anticancer drugs, NAMI-A and KP1019, are currently undergoing clinical investigation. NAMI-A is a potent inhibitor of cancer metastasis, while KP1019 prevents the growth of primary tumors.10
Besides exhibiting anticancer activity, Ru complexes also display the potential to be used as imaging agents.8 Ru compounds can act as probes by binding to DNA through non-covalent interactions, such as electrostatic, groove, interactive, and partial binding.11 For example, the well-studied “light switch” compound [Ru(phen)2dppz](ClO4)2 generates fluorescence when nitrogen atoms in dipyridophenazine (dppz) are exposed to the hydrophobic environment of the DNA helix.12, 13 In contrast, when this Ru complex is surrounded by water molecules, hydrogen-bonding causes an excited-state proton transfer that quenches light emission.14
Previous reports on Ru-based theranostic compounds have largely involved the use of small molecule agents that have been evaluated in vitro.8, 11–14 In this study, we have encapsulated [Ru(phen)2dppz](ClO4)2 in liposomes (Lipo-Ru) in order to improve the biodistribution and pharmacokinetic properties of the Ru compound in vivo. The hydrophobic bilayer of liposomes also enables the development of a nanoplatform that exploits the emission properties of Ru in a unique manner. Specifically, the lipid bilayer provides a hydrophobic environment that causes Ru to continuously emit fluorescence light, thereby enabling nanoparticle tracking inside the body. Notably, once the drug is released from the liposomes, it continuous to generate florescence by binding to DNA. Therefore, DNA binding and delivery of Ru-complexes in a hydrophobic formulation can be monitored through fluorescent emission. Accordingly, the Lipo-Ru platform can be used as both a therapeutic and imaging agent. The liposomes that consisted of dipalmitoylphosphatidylcholine (DPPC) and cholesterol were functionalized with polyethylene glycol (PEG) to increase hydrophilicity, decrease immunological recognition, reduce phagocytic uptake by macrophages, and prolong the circulation half-life.15–18 The anticancer activity and imaging capability of Lipo-Ru was evaluated in human triple-negative breast cancer (TNBC) cells and in an orthotopic MDA-MB-231 breast cancer model. The ability of Lipo-Ru to serve as an imaging probe was assessed by confocal microscopy, intravital microscopy, and an in vivo preclinical imaging system (IVIS). Although some previous studies on Ru-based nanoparticles have been reported, this study is the first to demonstrate the theranostic potential of Ru nanocarriers. For instance, while Rodrigues et al. showed that ruthenium nitrosyl complex liposomes display anticancer efficacy in cell culture, these nanoparticles were not used as imaging probes.19 Likewise, Boeuf and coworkers demonstrated that polymeric Ru nanoparticles can be used for photodynamic therapy (PDT) in vitro, but did nor explore imaging applications.20 In conclusion, this study has confirmed the potential of Lipo-Ru to serve as an efficient theranostic platform and the results suggest that this system could have broad applicability across a variety of solid tumors.
Results and Discussion
Design and synthesis of Lipo-Ru
The preparation process for Lipo-Ru is illustrated in Scheme 1. Briefly, dppz and cis-[Ru(phen)2Cl2] · 2H2O were synthesized as previously reported.13, 21, 22 These two compounds were then mixed together to form [Ru(phen)2dppz](ClO4)2. Results from proton nuclear magnetic resonance (1H-NMR) and electrospray ionization mass spectrometry (ESI-MS) revealed that the synthesis process was successfully carried out (Figure S1 and S2). The Ru-complex was then encapsulated in liposomes consisting of DPPC, cholesterol, and distearoyl phosphatidylethanolamine (DSPE)-PEG. Lipo-Ru was purified by centrifugation and washed in water to remove unencapsulated Ru. Inductively coupled plasma atomic emission spectrometer (ICP-AES) measurements demonstrated that the loading capacity was 4% (1 mg Ru/25 mg liposomes).
Scheme 1.
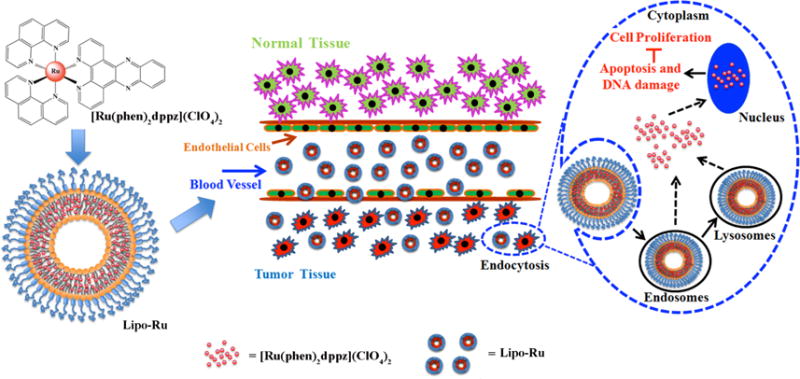
Schematic representation of [Ru(phen)2dppz](ClO4)2 (Ru) polypyridyl-containing liposomes (Lipo-Ru). Ru was encapsulated in the bilayer of liposomes. The Lipo-Ru system is designed as a theranostic platform for triple-negative breast cancer (TNBC).
Characterization of Lipo-Ru
The ability of Ru to emit fluorescence when intercalated with DNA was assessed by mixing Ru with plasmid DNA. The results demonstrated that a dose-dependent increase in fluorescence intensity occurred (Figure 1a). The addition of DNase to the mixture exposed Ru to a hydrophilic environment that caused the fluorescence signal to be quenched (Figure 2b), indicating that DNA binding was essential for light emission. The morphology, size, and zeta potential of Lipo-Ru was evaluated with transmission electron microscopy (TEM) and a Nano-ZS Zetasizer. TEM image and dynamic light scattering revealed a bilayer conformation (Figure 1c) with an average nanoparticle size of 82.53±2.66 nm (Figure 1d and Figure S3c). Compared to empty liposomes, Lipo-Ru was marginally smaller in size and the zeta potential was slightly elevated (Figure S3). Absorbance measurements of Lipo-Ru did not detect a wavelength shift and the metal-to-ligand charge transfer (MLCT) peak was preserved upon liposomal encapsulation (Figure 1e). The non-fluorescent Ru-complex became fluorescent when encapsulated in the lipid bilayer (Figure 1f) and the fluorescence intensity decreased in a time-dependent manner when Lipo-Ru was incubated with Triton X-100, which destroys the bilayer structure (Figure 1g). Previously, kinetic studies of liposome exposure to Triton X-100 have demonstrated that lipid bilayer solubilization can occur gradually over time.23 Confocal microscopy demonstrated the presence of distinct fluorescent spots corresponding to Lipo-Ru nanoparticles (Figure 1h), while a fluorescence signal was not observed with Ru or empty liposomes (Figure S4). Additionally, the spectral properties of free Ru were determined in the presence and absence of serum (Figure S5). Serum incubation caused a red shift of the ~280 nm peak (305 nm) and hypochromism was observed with increasing concentrations of fetal bovine serum (FBS) (Figure S5a). Moreover, the emission spectrum revealed an FBS-induced increase in fluorescence (Figure S5b). Furthermore, Lipo-Ru was stable under physiological conditions, as the liposome size remained unchanged for 100 h upon incubation with 50% FBS in phosphate buffered saline (PBS) (Figure 1i). The release profile of Ru from Lipo-Ru was also assessed (Figure S6). In the first 72 h, a slow release was observed with approximately 20% of Ru released, indicating that the pegylated bilayer protects Lipo-Ru from biomolecular interactions that reduce nanoparticle stability.
Figure 1.

Characterization of Ru and Lipo-Ru. a) Fluorescence spectra of Ru (2 × 10⁻⁴ M) in Tris-HCl buffer at 298 K in the absence and presence of a DNA plasmid (0–3.2 μg). Inset I) Plot showing the change in fluorescence intensity with increasing concentrations of DNA. I0, absence of DNA; I, presence of DNA. Inset II) Image of the Ru/DNA plasmid mixture obtained with an in vivo preclinical imaging system (IVIS-200). Increasing DNA concentration from left to right. b) Fluorescence quenching induced by DNase (10 μg) at various times points. Inset I) Plot showing the change in fluorescence intensity over time. I0, 0 min; I, 0–60 min. Inset II) Image of the Ru/DNA plasmid mixture with DNase obtained with IVIS-200. Increasing time periods from left to right. c) Transmission electron microscopy (TEM) image of Lipo-Ru. d) Size distribution of Lipo-Ru measured with dynamic light scattering. e) Ultraviolet-visible (UV-Vis) spectra of Ru and Lipo-Ru in Tris-HCl buffer. f) Fluorescence emission spectra of Ru (5 μM) and Lipo-Ru (5 μM Ru) in Tris-HCl buffer (Ex 488 nm/Em 600–620 nm). Inset I) Plot showing the difference in fluorescence intensity between Ru (I0) and Lipo-Ru (I). Inset II) Image of Ru (left) and Lipo-Ru (right) obtained with IVIS-200. g) Fluorescent quenching of Lipo-Ru by Triton X-100 (3%) at various times points. Inset I) Plot showing the change in fluorescence intensity over time. I0, 0 min; I, 0–25 min. Inset II) Image of the Ru/DNA plasmid mixture with Triton X-100 obtained with IVIS-200. Increasing time periods from left to right. h) Confocal microscopy images of Lipo-Ru (5 μM Ru). The red fluorescence originates from Ru in the lipid bilayer (Ex 488 nm/Em 600–620 nm). i) Size of Lipo-Ru in 50% fetal bovine serum (FBS) at various time points. Results are presented as the mean ± s.d. of three measurements.
Figure 2.

Cellular uptake and internalization of Ru and Lipo-Ru. The Ru dose used in these studies was 5 μM. a) Confocal microscopy images of MDA-MB-231 breast cancer cells incubated with Ru or Lipo-Ru for 6 h. Nuclei were stained in blue with DAPI. b) Quantitative evaluation of cellular uptake based on confocal microscopy imaging. Fluorescent intensity was normalized to the total number of nuclei in each image. Results are representative of twenty randomly selected images from each well, and are presented as the mean ± standard deviation. c) Quantitative flow cytometry analysis of cells incubated with Ru and Lipo-Ru for 6 h. d) Inductively coupled plasma atomic emission spectrometer (ICP-AES) elemental analysis of MDA-MB-231 breast cancer cells incubated with Ru or Lipo-Ru for 0.5 h or 6 h.
Cellular internalization of Lipo-Ru
Numerous biological applications have been explored for transition metal complexes, and these agents have shown promise for therapeutic and diagnostic use.24–26 A key factor for achieving therapeutic success is effective delivery of metal-based drugs to target tissues. Since these compounds display therapeutic efficacy through interactions with DNA, they must cross the cellular membrane. Previously, low levels of Ru internalization in cancer cells has been reported.27 Here, confocal microscopy was used to monitor cellular uptake of Lipo-Ru in MDA-MB-231 human breast cancer cells. A stronger fluorescent signal was detected in the nuclei upon exposure to Lipo-Ru than free Ru at the 6 h time point (Figure 2a). These uptake results were confirmed with fluorescence intensity measurements (Figure 2b). In contrast, there was no difference between the cellular uptake of free Ru and Lipo-Ru at the 0.5 h time point (Figure 2b). It is likely that the time required to activate the endocytic machinery causes the nanodelivery system to display similar uptake levels as the free drug after short incubation periods. Furthermore, the initial delay in liposome uptake could be due to the pegylation layer that causes reduced interactions with cells. Flow cytometry was also performed to analyze cellular uptake levels. After 6 h, cells treated with Lipo-Ru and Ru were 65.6% and 9.15% positive for the fluorescent dye, respectively (Figure 2c and Table S1). Likewise, ICP-AES results demonstrated that the intracellular accumulation of Lipo-Ru after 6 h was 15-fold higher than that of Ru (Figure 2d). Taken together, these results demonstrate that cellular internalization is substantially improved as a result of liposomal delivery.
Cancer cell death and acute immunotoxicity from Lipo-Ru in vitro
A major consideration in the clinical implementation of novel therapeutics is biocompatibility.28–31 Here, the cytotoxicity of free liposomes in MDA-MB-231 cells was evaluated using an MTT assay. After 72 h of incubation, the cell viability was > 95% and > 90% at liposome concentrations of 0–500 μg/mL and 625 μg/mL, respectively (Figure 3a). These results are supported by previous studies, which demonstrate that liposomes of similar composition do not cause toxicity.32–34 The in vitro anticancer activity of Lipo-Ru in MDA-MB-231 cells after 24 h, 48 h, and 72 h was also determined with an MTT assay. The results reveal a dramatic difference in the ability of Ru and Lipo-Ru to reduce cell viability. At all three time points, the half maximal inhibitory concentration (IC50) was > 200 μM and < 4 μM for Ru and Lipo-Ru, respectively (Figure 3b, Figure S7 and Table S2). A similar Lipo-Ru-induced reduction in cell viability was observed in three other TNBC cell lines, including SUM 159, MDA-MB-468, and BT-549 (Figure S8).
Figure 3.
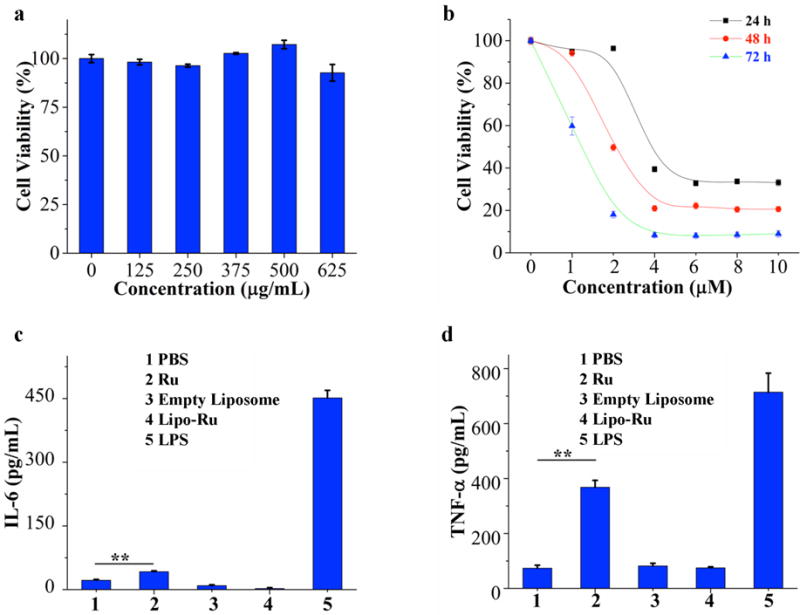
Evaluation of cell viability (MTT) and subacute immunotoxicity in vitro. a) Viability of MDA-MB-231 breast cancer cells incubated with various concentrations of empty liposomes for 72 h. b) Viability of MDA-MB-231 breast cancer cells incubated with various concentrations of Lipo-Ru for 24 h, 48 h, or 72 h. c) and d) Enzyme-linked immunosorbent assay (ELISA) measurements of interleukin 6 (IL-6) and tumor necrosis factor alpha (TNF-α) in cell culture media from Raw-264.7 mouse macrophages exposed to phosphate buffered saline (PBS, negative control), empty liposomes (625 μg/ml), Ru (2 μM), Lipo-Ru (2 μM Ru), or lipopolysaccharide (LPS, 0.5 μg/mL, positive control) for 24 h. Results are presented as the mean ± s.d. of triplicates. **, P < 0.01.
Nanoparticles and small molecule drugs can in certain cases evoke adverse immune reactions that are accompanied by the production of key inflammatory cytokines, such as interleukin 6 (IL-6) and tumor necrosis factor alpha (TNF-α).28, 31, 35 In this study, the levels of IL-6 and TNF-α were measured in Raw 264.7 murine macrophages and DC2.4 murine dendritic cells exposed to empty liposomes, Ru, or Lipo-Ru. Lipopolysaccharide (LPS) served as a positive control, as its ability to induce an immune response has been well documented.31 Treatment with LPS or Ru triggered a surge in both TNF-α and IL-6 levels; in contrast, treatment with empty liposomes or Lipo-Ru did not cause any changes in the levels of these cytokines compared to untreated cells (Figure 3c, 3d and Figure S9). These results demonstrate that liposomal encapsulation of Ru prevents immunotoxicity.
Evaluation of DNA damage, cell cycle arrest, and apoptosis from Lipo-Ru
To evaluate the anticancer activity of Lipo-Ru, MDA-MB-231 cells were co-incubated with Lipo-Ru and cell lysates were analyzed by Western blot to detect proteins and phospho-proteins associated with DNA damage and apoptosis. MDA-MB-231 orthotopic breast cancer tumors from athymic nude mice treated with Lipo-Ru were also analyzed to assess treatment-induced DNA damage in vivo. The results demonstrated that Lipo-Ru increased the levels of γ-H2AX (Figure 4a and 4b), a marker for DNA double-strand breaks.36, 37 Confocal microscopy analysis also revealed increased levels of γ-H2AX in response to Lipo-Ru treatment (Figure 4c and 4d). In addition, Lipo-Ru induced degradation and dephosphorylation of ataxia telangiectasia mutated (ATM) (Figure 4a and 4b), a key protein in DNA repair.38, 39 It has previously been shown that ATM inactivation is triggered by cellular apoptosis.40, 41 Accordingly, DNA damage caused by metal-based drugs typically disrupts normal DNA function, consequently inducing cell cycle arrest and triggering apoptosis.4, 42 In this study, the effect of Ru and Lipo-Ru (5 μM) on the cell cycle and apoptosis was assessed in MDA-MB-231 cells with flow cytometry. Ru caused a negligible increase in cell cycle arrest, while 54% of cells treated with Lipo-Ru were in the G2/M phase (Figure 5a and 5c). In addition, 75.9% of cells were apoptotic following exposure to Lipo-Ru for 12 h, while less than 5% displayed signs of apoptosis in Ru-treated cells and control cells (Figure 5b and 5d). To further assess cell apoptosis, protein levels of key regulators in intrinsic and extrinsic apoptotic pathways43 were analyzed by Western blot. Cells treated with Lipo-Ru displayed cleaved forms of poly (ADP-ribose) polymerase (PARP), caspase-3, caspase-8, and caspase-9 (Figure 5e). Taken together, these results indicate that DNA damage caused by Lipo-Ru can trigger cell cycle arrest and induce apoptosis.
Figure 4.

Evaluation of DNA damage in response to Lipo-Ru treatment. a) Western blot analysis of ataxia telangiectasia mutated (ATM) and γ-H2AX protein levels in MDA-MB-231 cells exposed to PBS (mock), Ru (3 μM), or Lipo-Ru (3 μM Ru) for 12 h. β-actin was used as a loading control. b) Western blot analysis of ATM and γ-H2AX protein levels in orthotopic MDA-MB-231 breast cancer tumors from mice treated with PBS (mock), Ru, or Lipo-Ru (Ru: 5 mg/kg/week i.v. for four weeks). c) Confocal microscopy images of MDA-MB-231 cells exposed to PBS (mock), Ru (3 μM), or Lipo-Ru (3 μM Ru) for 12 h. DNA double-strand breaks and nuclei were stained with γ-H2AX (in red) and DAPI (in blue), respectively. d) Quantitative evaluation of DNA-double strand breaks in confocal microscopy images. The γ-H2AX staining index was determined by calculating the percentage of γ-H2AX-positive cells in each image. Results are representative of twenty randomly selected images from each tumor.
Figure 5.
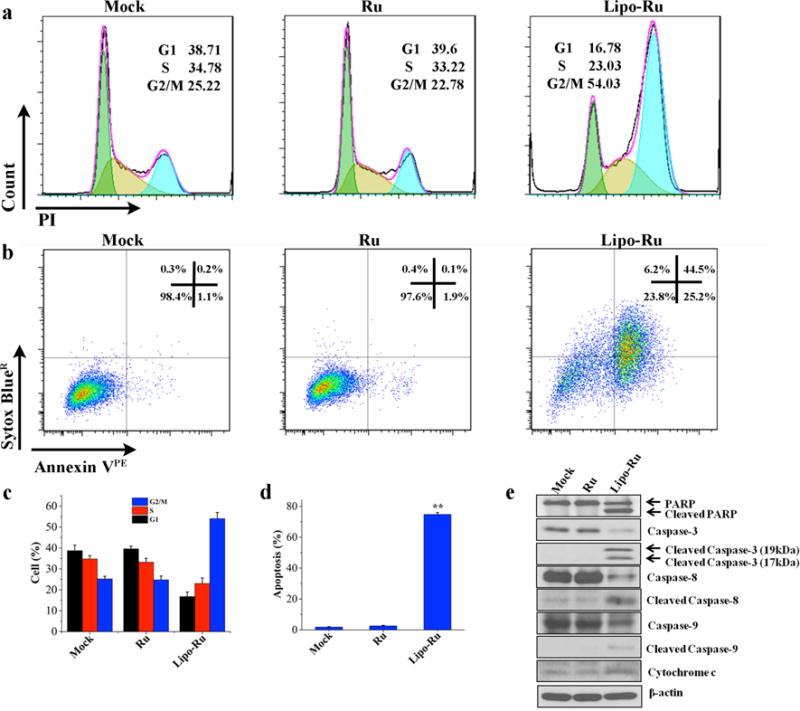
Cell cycle and cellular apoptosis analysis in MDA-MB-231 cells in response to PBS (mock), Ru, and Lipo-Ru. The Ru dose used in these studies was 5 μM. a) Flow cytometry of PI-labeled cells incubated with PBS, Ru, or Lipo-Ru for 12 h. b) Flow cytometry of annexin VPE and Sytox BlueR labeled cells exposed to PBS, Ru, or Lipo-Ru for 12 h. c) and d) Quantitative flow cytometry analysis of cell cycle ratios and apoptotic cells. Results are presented as mean + s.d. of triplicates. **, P < 0.01. e) Western blot analysis of cells exposed to PBS, Ru, or Lipo-Ru for 12 h. The levels of various proteins involved in apoptosis were measured. β-actin was used as a loading control.
Biodistribution of Lipo-Ru in vivo
An orthotopic murine model of MDA-MB-231 human breast cancer was applied to evaluate whether Lipo-Ru could effectively accumulate in tumor tissue upon intravenous administration. Whole body images of mice acquired with the IVIS-200 system revealed that the tumor signal was dramatically enhanced in the Lipo-Ru group compared to the Ru group (Figure S10). Additionally, the tumor vasculature was delineated using a FITC-labeled dextran dye and intravital microscopy analysis was used to monitor the tumor accumulation of Lipo-Ru (Figure 6a). The results revealed that most of the particles had entered the tumor interstitium and many of them were stationary within the tumor after 0.5 h (Figure 6a, Video S1). Fluorescent spots were clearly visible in tumor tissue sections obtained 2 h after administration of Lipo-Ru (Figure 6b, Figure S11, Video S2 and S3). The IVIS-200 imaging system was also applied to visualize Lipo-Ru accumulation in the heart, spleen, kidneys, liver, lungs, and tumor 2 h post-injection. The Lipo-Ru particles accumulated primarily in the liver (34% of injected dose) and in the tumor (30% of injected dose) (Figure 6c and 6e). Additionally, ICP-AES was used to compare the biodistribution of free Ru and Lipo-Ru. As shown in figure S12, intratumoral deposition of Ru was substantially increased in the liposome group. Enhanced accumulation of Lipo-Ru particles in tumor tissue is likely due to the enhanced permeability and retention (EPR) effect, which is a consequence of the unique characteristics of tumor vasculature. Namely, tumor blood vessels are highly disorganized, proliferate rapidly, and form a discontinuous barrier, resulting in the formation of fenestrations (<600 nm) that enable nanoparticle entry.44–46 In addition, the PEG chains of Lipo-Ru reduce uptake by macrophages, thereby decreasing liposome accumulation in the mononuclear phagocyte system.
Figure 6.

Evaluation of Lipo-Ru tumor accumulation and biodistribution in athymic nude mice bearing orthotopic MDA-MB-231 breast cancer tumors. Lipo-Ru was administered intravenously at a Ru-equivalent dose of 5 mg/kg (n = 3). a) Intravital microscopy images were captured 0.5 h post-injection of Lipo-Ru. Lipo-Ru particles are shown in red and tumor blood vessels in green (FITC-dextran). White arrows point to select particles that have left the tumor vasculature. b) Confocal microscopy images of tumors 2 h post-injection of Lipo-Ru. Lipo-Ru particles are shown in red and highlighted with white arrows. Nuclei are stained in blue with DAPI. (c-e) Biodistribution of Lipo-Ru in tumor tissue and major organs (c) Images of organs obtained with IVIS-200. (d) Quantitative analysis of fluorescent images obtained with IVIS-200. Values are presented as the percentage of total fluorescence intensity/organ and e) the percentage of total fluorescent intensity/g tissue.
Therapeutic efficacy evaluation of Lipo-Ru in vivo
The orthotopic MDA-MB-231 tumor model was also applied to evaluate the therapeutic efficacy of Lipo-Ru. Tumor growth was dramatically suppressed in the Lipo-Ru treatment group compared to the PBS or Ru-treatment control groups (Figure 7a). Notably, the average tumor weights were 0.992 g, 0.981 g, and 0.342 g in the PBS, Ru, and Lipo-Ru groups, respectively (Figure 7b). Immunofluorescent imaging of tumor tissues revealed that the Ki-67 staining index was 58.6%, 50.2%, and 4.8% in mice treated with PBS, Ru, or Lipo-Ru, respectively (Figure 7c and 7d), indicating that cancer cell proliferation was dramatically suppressed in response to Lipo-Ru. The TUNEL assay demonstrated that tumors from the Lipo-Ru group displayed much higher levels of apoptosis than the control groups (Figure 7e and f). Likewise, Western blot analysis of tumor samples revealed that Lipo-Ru treatment altered the expression levels of proteins involved in intrinsic and extrinsic apoptotic pathways (Figure 7g).
Figure 7.

Evaluation of Lipo-Ru anticancer activity in athymic nude mice bearing orthotopic MDA-MB-231 breast tumors. Mice were intravenously injected once a week for four weeks with PBS, Ru (5 mg/kg/week), or Lipo-Ru (Ru: 5 mg/kg/week) (n = 5). a) Tumor images at the end of the treatment period. b) Tumor weight measurements at the end of the treatment period. c) Confocal microscopy images of tumor sections stained with Ki-67. d) The Ki-67 staining index was obtained from confocal microscopy images. The index was determined by calculating the percentage of Ki-67-positive cells in each image. Results are representative of twenty randomly selected images from each tumor. e) Confocal microscopy images of tumor sections stained with TUNEL. Apoptotic nuclei are shown in green and normal nuclei in blue (DAPI). f) The apoptotic ratio was obtained from confocal microscopy images. The ratio was determined by calculating the percentage of apoptotic cells in each image. Results are representative of twenty randomly selected images from each tumor. g) Western blot analysis of tumor cells. The levels of various proteins involved in apoptosis were assessed. β-actin was used as a loading control. **, P < 0.01 versus PBS or Ru.
The potential damage to normal organs from Lipo-Ru exposure was also evaluated. Histological examination demonstrated that repeated injections of Lipo-Ru in tumor-free mice did not cause any apparent morphological changes (Figure S13), as was evident from hematoxylin and eosin (H&E) staining.
Conclusion
In conclusion, the data presented herein indicates that the proposed strategy for liposomal encapsulation of a polypyridine Ru complex is a promising theranostic approach for cancer. The Ru complex is capable of causing DNA damage, which arrests cells in the G2/M phase and triggers pathways that ultimately induce cancer cell apoptosis. Lipo-Ru displayed high levels of uptake in MDA-MB-231 cancer cells and accumulated in high amounts in tumor tissue upon intravenous administration, which enabled efficient tumor imaging and cancer therapy. In particular, this study demonstrates effective delivery and therapeutic efficacy of systemically injected Lipo-Ru in a TNBC model. Approximately 15% of breast cancers in the United States are classified as triple-negative, which is a highly aggressive form of breast cancer that lacks expression of the estrogen receptor (ER), progesterone receptor (PR), and Her2/neu.47–51 Therapeutic options are limited for TNBC patients, as hormonal and targeted therapies cannot be exploited. Although it is common for TNBC patients to initially respond to chemotherapy, most patients relapse with highly metastatic and drug-resistant tumors, leading to high mortality rates.50, 52 Accordingly, there is an urgent need to develop new therapeutic agents against TNBC. Here, administration of Lipo-Ru resulted in a dramatic reduction in the growth of TNBC tumors. Liposomal encapsulation of the active compound [Ru(phen)2dppz](ClO4)2 in the lipid bilayer also enabled fluorescence imaging of cancer cells and tumor tissue. In particular, confocal microscopy, intravital microscopy, and an in vivo preclinical imaging system (IVIS) were used to visualize Lipo-Ru in cells and organs. Moreover, Lipo-Ru did not cause any signs of acute immunotoxicity or morphological changes in major organs, suggesting that the platform could be used as a biocompatible theranostic tool for cancer.
Supplementary Material
Acknowledgments
This work was partially supported by the National Institute of Health grant 1R01CA193880-01A1 (to HS), National Natural Science Foundation of China grants 21231007 and 21572282, the 973 Program grants 2014CB845604 and 2015CB856301 (to ZM), the Ministry of Education of China grant IRT1298 (to ZM), and funding from Guangdong Provincial Department of Human Resources, Social Security, and Technology, and the Fundamental Research Funds for Central Universities (to ZM).
Footnotes
Associated Content
Supporting Information Available: [Methods section. Intravital microscopy videos. 1H NMR, ESI-MS, zeta potential, Ru release, and H&E staining results. Additional flow cytometry, IC50, size distribution, UV-Vis spectra, fluorescence spectra, confocal microscopy, cell viability, TNF-α and IL6 enzyme-linked immunosorbent assay (ELISA), IVIS, intravital microscopy, and biodistribution results]. This material is available free of charge via the internet at http://pubs.acs.org
Author contributions
J.S. and H.C.K contributed equally to this work.
Notes
The authors declare no competing financial interest.
References
- 1.Bruijnincx PC, Sadler PJ. Curr Opin Chem Biol. 2008;12:197–206. doi: 10.1016/j.cbpa.2007.11.013. [DOI] [PMC free article] [PubMed] [Google Scholar]
- 2.Tan CP, Lu YY, Ji LN, Mao ZW. Metallomics. 2014;6:978–995. doi: 10.1039/c3mt00225j. [DOI] [PubMed] [Google Scholar]
- 3.Arnesano F, Natile G. Coord Chem Rev. 2009;253:2070–2081. [Google Scholar]
- 4.Florea A-M, Büsselberg D. Cancers. 2011;3:1351–1371. doi: 10.3390/cancers3011351. [DOI] [PMC free article] [PubMed] [Google Scholar]
- 5.Rajeswaran A, Trojan A, Burnand B, Giannelli M. Lung Cancer. 2008;59:1–11. doi: 10.1016/j.lungcan.2007.07.012. [DOI] [PubMed] [Google Scholar]
- 6.Brabec V, Nováková O. Drug Resist Updat. 2006;9:111–122. doi: 10.1016/j.drup.2006.05.002. [DOI] [PubMed] [Google Scholar]
- 7.Han Ang W, Dyson PJ. Eur J Inorg Chem. 2006;2006:4003–4018. [Google Scholar]
- 8.Gill MR, Thomas JA. Chem Soc Rev. 2012;41:3179–3192. doi: 10.1039/c2cs15299a. [DOI] [PubMed] [Google Scholar]
- 9.Antonarakis ES, Emadi A. Cancer Chemother Pharmacol. 2010;66:1–9. doi: 10.1007/s00280-010-1293-1. [DOI] [PMC free article] [PubMed] [Google Scholar]
- 10.Clarke MJ, Zhu F, Frasca DR. Chem Rev. 1999;99:2511–2534. doi: 10.1021/cr9804238. [DOI] [PubMed] [Google Scholar]
- 11.Tan L, Shen J, Liu J, Zeng L, Jin L, Weng C. Dalton Trans. 2012;41:4575–4587. doi: 10.1039/c2dt12402e. [DOI] [PubMed] [Google Scholar]
- 12.Yao JL, Gao X, Sun W, Fan X-Z, Shi S, Yao TM. Inorg Chem. 2012;51:12591–12593. doi: 10.1021/ic301305q. [DOI] [PubMed] [Google Scholar]
- 13.Olson E, Hu D, Hörmann A, Jonkman A, Arkin M, Stemp E, Barton J, Barbara P. J Am Chem Soc. 1997;119:11458–11467. [Google Scholar]
- 14.Gill MR, Garcia-Lara J, Foster SJ, Smythe C, Battaglia G, Thomas JA. Nat Chem. 2009;1:662–667. doi: 10.1038/nchem.406. [DOI] [PubMed] [Google Scholar]
- 15.Wolfram J, Suri K, Yang Y, Shen J, Celia C, Fresta M, Zhao Y, Shen H, Ferrari M. Colloids Surf B: Biointerfaces. 2014;114:294–300. doi: 10.1016/j.colsurfb.2013.10.009. [DOI] [PMC free article] [PubMed] [Google Scholar]
- 16.Harris JM, Chess RB. Nat Rev Drug Discov. 2003;2:214–221. doi: 10.1038/nrd1033. [DOI] [PubMed] [Google Scholar]
- 17.Torchilin VP. Nat Rev Drug Discov. 2005;4:145–160. doi: 10.1038/nrd1632. [DOI] [PubMed] [Google Scholar]
- 18.Khalid A, Persano S, Shen H, Zhao Y, Blanco E, Ferrari M, Wolfram J. Expert Opin Drug Deliv. 2016:1–13. doi: 10.1080/17425247.2017.1243527. [DOI] [PMC free article] [PubMed] [Google Scholar]
- 19.Rodrigues FP, Carneiro ZA, Mascharak P, Curti C, da Silva RS. Coord Chem Rev. 2016;306:701–707. [Google Scholar]
- 20.Boeuf G, Roullin GV, Moreau J, Van Gulick L, Terryn C, Ploton D, Andry MC, Chuburu F, Dukic S, Molinari M, Lemercier G. ChemPlusChem. 2014;79:171–180. doi: 10.1002/cplu.201300242. [DOI] [PubMed] [Google Scholar]
- 21.Sullivan B, Salmon D, Meyer T. Inorg Chem. 1978;17:3334–3341. [Google Scholar]
- 22.Dickeson J, Summers L. Aust J Chem. 1970;23:1023–1027. [Google Scholar]
- 23.de la Maza A, Parra JL. Colloid Polym Sci. 1995;274:866–874. [Google Scholar]
- 24.Keene FR, Smith JA, Collins JG. Coord Chem Rev. 2009;253:2021–2035. [Google Scholar]
- 25.Puckett CA, Ernst RJ, Barton JK. Dalton Trans. 2010;39:1159–1170. doi: 10.1039/b922209j. [DOI] [PMC free article] [PubMed] [Google Scholar]
- 26.Rafique S, Idrees M, Nasim A, Akbar H, Athar A. Biotechnol Mol Biol Rev. 2010;5:38–45. [Google Scholar]
- 27.Puckett CA, Barton JK. J Am Chem Soc. 2007;129:46–47. doi: 10.1021/ja0677564. [DOI] [PMC free article] [PubMed] [Google Scholar]
- 28.Shen J, Kim H-C, Mu C, Gentile E, Mai J, Wolfram J, Ji L-N, Ferrari M, Mao Z-W, Shen H. Adv Healthc Mater. 2014;3:1629–1637. doi: 10.1002/adhm.201400103. [DOI] [PMC free article] [PubMed] [Google Scholar]
- 29.Shen J, Kim H-C, Su H, Wang F, Wolfram J, Kirui DMai J, Mu C, Mao Z-W, Shen H. Theranostics. 2014;4:487–497. doi: 10.7150/thno.8263. [DOI] [PMC free article] [PubMed] [Google Scholar]
- 30.Wolfram J, Zhu M, Yang Y, Shen J, Gentile E, Paolino D, Fresta M, Nie G, Chen C, Shen H, Ferrari M, Zhao Y. Curr Drug Targets. 2015;16:1671–1681. doi: 10.2174/1389450115666140804124808. [DOI] [PMC free article] [PubMed] [Google Scholar]
- 31.Shen J, Xu R, Mai J, Kim H-C, Guo X, Qin G, Yang Y, Wolfram J, Mu C, Xia X, Gu J, Liu X, Mao Z-W, Ferrari M, Shen H. ACS Nano. 2013;7:9867–9880. doi: 10.1021/nn4035316. [DOI] [PMC free article] [PubMed] [Google Scholar]
- 32.Wolfram J, Scott B, Boom K, Shen J, Borsoi C, Suri K, Grande R, Fresta M, Celia C, Zhao Y, Shen H, Ferrari M. Curr Drug Deliv. 2016;13:711–719. doi: 10.2174/1567201812666151027142412. [DOI] [PMC free article] [PubMed] [Google Scholar]
- 33.Pasut G, Paolino D, Celia C, Mero A, Joseph AS, Wolfram J, Cosco D, Schiavon O, Shen H, Fresta M. J Control Release. 2015;199:106–113. doi: 10.1016/j.jconrel.2014.12.008. [DOI] [PubMed] [Google Scholar]
- 34.Paolino D, Cosco D, Gaspari M, Celano M, Wolfram J, Voce P, Puxeddu E, Filetti S, Celia C, Ferrari M, Russo D, Fresta M. Biomaterials. 2014;35:7101–7109. doi: 10.1016/j.biomaterials.2014.04.088. [DOI] [PubMed] [Google Scholar]
- 35.Dobrovolskaia MA, Germolec DR, Weaver JL. Nat Nanotechnol. 2009;4:411–414. doi: 10.1038/nnano.2009.175. [DOI] [PubMed] [Google Scholar]
- 36.Celeste A, Fernandez-Capetillo O, Kruhlak MJ, Pilch DR, Staudt DW, Lee A, Bonner RF, Bonner WM, Nussenzweig A. Nat Cell Biol. 2003;5:675–679. doi: 10.1038/ncb1004. [DOI] [PubMed] [Google Scholar]
- 37.Jazayeri A, Falck J, Lukas C, Bartek J, Smith GC, Lukas J, Jackson SP. Nat Cell Biol. 2006;8:37–45. doi: 10.1038/ncb1337. [DOI] [PubMed] [Google Scholar]
- 38.Berkovich E, Monnat RJ, Kastan MB. Nat Cell Biol. 2007;9:683–690. doi: 10.1038/ncb1599. [DOI] [PubMed] [Google Scholar]
- 39.Kurz EU, Lees-Miller SP. DNA repair. 2004;3:889–900. doi: 10.1016/j.dnarep.2004.03.029. [DOI] [PubMed] [Google Scholar]
- 40.Smith GC, d’Adda di Fagagna F, Lakin ND, Jackson SP. Mol Cell Biol. 1999;19:6076–6084. doi: 10.1128/mcb.19.9.6076. [DOI] [PMC free article] [PubMed] [Google Scholar]
- 41.Wang J, Pabla N, Wang CY, Wang W, Schoenlein PV, Dong Z. Am J Physiol Renal Physiol. 2006;291:F1300–F1307. doi: 10.1152/ajprenal.00509.2005. [DOI] [PubMed] [Google Scholar]
- 42.Ramakrishnan S, Rajendiran V, Palaniandavar M, Periasamy VS, Srinag BS, Krishnamurthy H, Akbarsha MA. Inorg Chem. 2009;48:1309–1322. doi: 10.1021/ic801144x. [DOI] [PubMed] [Google Scholar]
- 43.Fulda S, Debatin K. Oncogene. 2006;25:4798–4811. doi: 10.1038/sj.onc.1209608. [DOI] [PubMed] [Google Scholar]
- 44.Fang J, Nakamura H, Maeda H. Adv Drug Deliv Rev. 2011;63:136–151. doi: 10.1016/j.addr.2010.04.009. [DOI] [PubMed] [Google Scholar]
- 45.Maeda H. J Control Release. 2012;164:138–144. doi: 10.1016/j.jconrel.2012.04.038. [DOI] [PubMed] [Google Scholar]
- 46.Maeda H, Wu J, Sawa T, Matsumura Y, Hori K. J Control Release. 2000;65:271–284. doi: 10.1016/s0168-3659(99)00248-5. [DOI] [PubMed] [Google Scholar]
- 47.O’Toole SA, Beith JM, Millar EK, West R, McLean A, Cazet A, Swarbrick A, Oakes SR. J Clin Pathol. 2013;66:530–542. doi: 10.1136/jclinpath-2012-201361. [DOI] [PubMed] [Google Scholar]
- 48.Engebraaten O, Vollan HK, Borresen-Dale AL. Am J Pathol. 2013;183:1064–1074. doi: 10.1016/j.ajpath.2013.05.033. [DOI] [PubMed] [Google Scholar]
- 49.Teng YH, Thike AA, Wong NS, Tan PH. Recent Pat Anticancer Drug Discov. 2011;6:196–209. doi: 10.2174/157489211795328521. [DOI] [PubMed] [Google Scholar]
- 50.Parvani JG, Gujrati MD, Mack MA, Schiemann WP, Lu Z-R. Cancer Res. 2015;75:2316–2325. doi: 10.1158/0008-5472.CAN-14-3485. [DOI] [PMC free article] [PubMed] [Google Scholar]
- 51.Metzger-Filho O, Tutt A, de Azambuja E, Saini KS, Viale G, Loi S, Bradbury I, Bliss JM, Azim HA, Ellis P. J Clin Oncol. 2012;30:1879–1887. doi: 10.1200/JCO.2011.38.2010. [DOI] [PubMed] [Google Scholar]
- 52.Duffy MJ, McGowan PM, Crown J. Int J Cancer. 2012;131:2471–2477. doi: 10.1002/ijc.27632. [DOI] [PubMed] [Google Scholar]
Associated Data
This section collects any data citations, data availability statements, or supplementary materials included in this article.