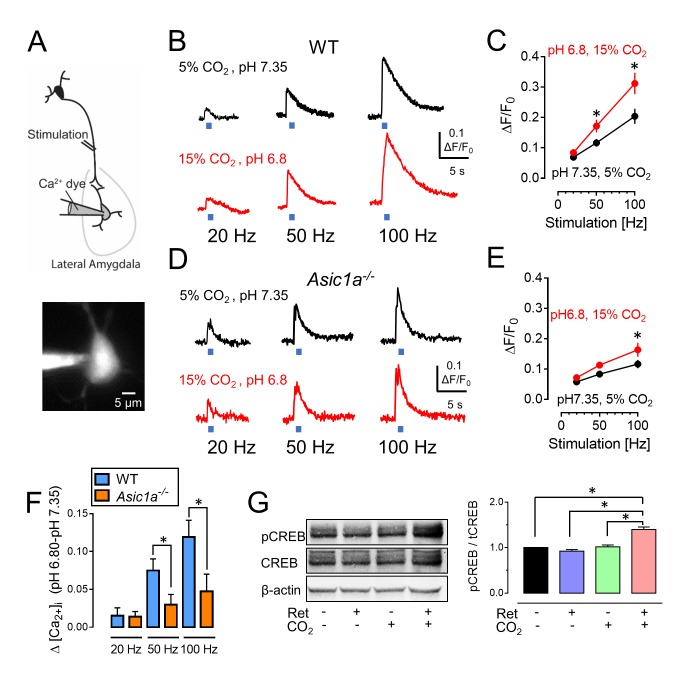
Figure 6. CO2-induced acidosis increases stimulation-dependent postsynaptic [Ca2+]i in amygdala slices and increases CREB phosphorylation after retrieval.
(A) Schematic for measuring changes in post-synaptic [Ca2+]i. Brain slices were prepared, and lateral amygdala pyramidal neurons were loaded with the fluorescent Ca2+ indicator Oregon Green 488 BAPTA-6F (100 μM) via a patch pipet. Changes in postsynaptic [Ca2+]i induced by presynaptic stimulation at 20, 50, and 100 Hz were assayed when the ACSF was saturated with either 5% CO2 (pH 7.35) or 15% CO2 (pH 6.8). (B) Examples of changes in [Ca2+]i signal with stimulation of wild-type neurons. (C) Mean±SEM of changes in [Ca2+]i signal. *p<0.05 by Student’s t-test. n = 14. p=0.0336 at 50 Hz; p=0.0189 at 100 Hz. (D,E) Data as in panels B and C except in Asic1a−/− mice. *p<0.05 by Student’s t-test. n = 24. p=0.0215 at 100 Hz. (F) Change in [Ca2+]i signal between pH 7.35 and 6.80 from panels C and E. (G) The procedure was the same as that shown in Figure 3A except that mice were euthanized 30 min after retrieval. Left, example of western blot with antibodies to CREB phosphorylated on Ser133, total CREB, and -actin. Right, mean±SEM of ratio of Ser133 phosphorylated CREB to total CREB. n = 6 sets of lateral amygdala tissue (each set contained lateral amygdala from the brains of 4 mice). * indicates p<0.05 by ANOVA with Tukey’s post hoc multiple comparison. No ret vs Ret, p=0.4683; No ret vs No ret + CO2, p=0.9819; No ret vs Ret + CO2, p<0.0001; Ret vs No ret + CO2, p=0.2845; Ret vs Ret + CO2, p<0.0001; No ret + CO2 vs Ret + CO2, p<0.0001.

