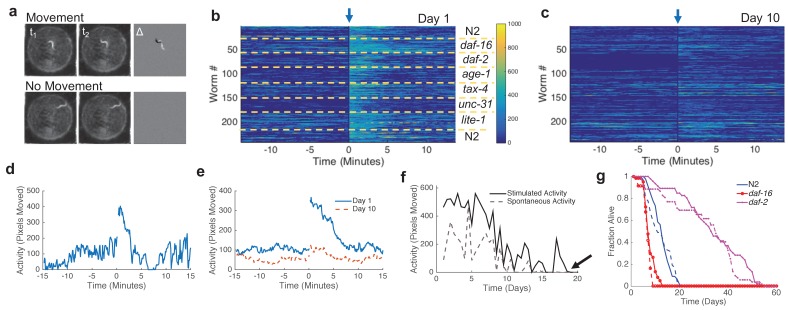
Figure 2. Image processing, automated lifespan calculation, and manual validation.
(a) Activity calculation. Delta image (right image) is calculated by pixel-by-pixel subtraction of images taken at time t1 from images taken at time t2. Examples are shown in which a worm moves (top) and does not move (bottom). (b) Activity, shown as a heat map, of young adult (day one) animals during a 30-min imaging epoch. Arrow indicates 10-s blue light stimulation. Color bar indicates the number of pixels changed over a 60-s interval. (c) Activity of adult C. elegans on day 10. Colorbar uses same scale as panel (b). (d) Activity trace from one wild-type animal. Blue light was applied at time zero. (e) Average wild-type population behavior on day 1 (solid curve) and day 10 (dashed curve) (n = 30). (f) Single animal trace of maximum spontaneous (dashed) or stimulated (solid) activity across entire lifespan. Arrow indicates time of death. (g) Lifespan of animals grown on the WorMotel (solid curves) or standard plates (dashed curves).

