

ABSTRACT
The molecular mechanisms of intervertebral disc degeneration (IDD) remain elusive. We found that miR‐155 is down‐regulated in degenerative nucleus pulposus (NP), and more severe degeneration is correlated with higher matrix metallopeptidase 16 (MMP‐16) expression. MMP‐16 also degraded matrix aggrecan. Here, we addressed the in vivo miR‐155‐mediated pathological impact on IDD using a classic puncture mouse model. Lentiviral upregulated‐miR‐155 or downregulated‐miR‐155 was transduced into the discs of C57 mice, which was validated by real‐time polymerase chain reaction (real‐time PCR) and in situ hybridization. Immunohistochemistry and western blotting revealed that up‐regulation of miR‐155 resulted in down‐regulation of MMP‐16 and an increase in aggrecan and collagen type II in mouse NP; whereas, down‐regulation of miR‐155 resulted in up‐regulation of MMP‐16 and a decrease in aggrecan in mouse NP. Radiographic and histological analysis showed that the up‐regulation of miR‐155 attenuated IDD, while down‐regulation of miR‐155 resulted in the deterioration of IDD. These findings indicate that decreased miR‐155 contributed to the up‐regulation of MMP‐16 in vivo, and MMP‐16 further degraded aggrecan and collagen type II, leading to the dehydration and degeneration of discs. Our findings revealed a therapeutic role for miR‐155 in IDD. © 2017 The Authors. Journal of Orthopaedic Research Published by Wiley Periodicals, Inc. on behalf of Orthopaedic Research Society. J Orthop Res 35:1323–1334, 2017.
Keywords: aggrecan, disc degeneration, MMP‐16, miR‐155, nucleus pulposus
Low back pain (LBP) affects 60–80% of the population and is described as the “twentieth century health care enigma.”1 Treatments for LBP cost 90 billion dollars in the United States and 12 billion pounds in the United Kingdom every year2 and, thus, impose a severe, global health‐care and socioeconomic burden.3 Intervertebral disc degeneration (IDD) is the main cause of low back pain. IDD begins at the inner region of the intervertebral disc, the nucleus pulposus (NP), and is characterized by extracellular matrix (ECM) alterations.4
The ECM of the NP is mainly comprised of collagen type II and proteoglycans (mainly aggrecan). Collagen type II composes 20% of the dry weight of the NP and provides tensile strength to the disc.5 Aggrecan composes 50% of the wet weight in the NP and functions to maintain tissue hydration.6 As the disc degenerates, collagen type II and aggrecan degrade, and this results in NP tissue resorption and dehydration that leads to intradisc clefts and tears. These are the major pathological hallmarks of IDD.
MMPs can be categorized into four groups7: Collagenases (MMP‐1, ‐8, ‐13, and ‐18); gelatinases (MMP‐2 and ‐9); stromelysins (MMP‐3, ‐10, and ‐11); and membrane‐type MMPs (MT‐MMPs) (MMP‐14, ‐16, ‐17, and ‐18). Besides directly causing the degradation of a variety of ECM components, including aggrecan,8 MMP‐16 is reported to participate in the activation of MMP‐2.9 MMP‐2, also known as Gelatinase A, can degrade denatured collagen molecules and basement membrane aggrecan.10 The up‐regulation of MMP‐2 is strongly correlated with IDD.11, 12 MMP‐2 plays a major role in matrix degradation, collagen remodeling, and cleft formation which occurs in degenerated discs.7, 13 However, there is a paucity of information addressing the regulatory mechanism of MMP‐16 in human IDD.
Ribonucleic acid (RNA) is a long chain molecule, and its main function is the expression of genetic information in proteins, including transfer RNA (tRNA), micro RNAs (miRNAs), messenger RNAs (mRNAs), small nuclear RNA (snRNA), and small cytoplasmic RNA (scRNA). miRNAs are a family of small non‐coding RNA regulators. Newly defined miRNAs are reported to play important roles in cell proliferation, differentiation, apoptosis, organ development, and inflammatory diseases.14, 15 By binding to 3′UTRs of target mRNAs, miRNAs induce either translation, repression, or RNA degradation.16 Recently, we reported that a number of miRNAs are differentially expressed between normal and degenerated NP.17 miR‐155 was among the 29 differentially expressed miRNAs and was down‐regulated by 0.41‐fold (p < 0.01) in degenerated NP.17 Bioinformatics target prediction (Target Scan 5.1, miRDB) indicated that the binding sites of miR‐155 may be harbored in the 3′UTRs of MMP‐16 mRNA. Given that increased MMPs can lead to IDD by degrading aggrecan,7 we speculated that miR‐155 may be involved in the pathogenesis of IDD by directly targeting MMP‐16 and, subsequently, contributing to the degradation of aggrecan.
Accordingly, the aims of the present study were to identify the role of miR‐155 in IDD and to further unravel the mechanisms underlying IDD.
MATERIALS AND METHODS
Ethics Statement
The institutional Ethics Review Board of Xijing Hospital approved the study (No. 20111103‐7). Moreover, we obtained written informed consent for the experimental use of the disc from the relatives of cadavers, each patients, and animals.
Samples Collection
From September 2011 to September 2012, we collected samples from patients who were treated at the Department of Orthopedics, Xijing Hospital and donated cadavers in Xijing Hospital. The normal human NP samples were collected from cadavers as non‐degenerated group (n = 5, average age 43.4 [range 28–65] years). According to Pfirrmann grades of IDD, we collected the samples of patients with IDD, Pfirrmann IV grade group (n = 10, average age 44.7 [range 21–63] years).
pFL‐MMP‐16 3′‐UTR Vector Construction and Luciferase Reporter Assay
The 3′‐UTRs segments of mus musculus‐ MMP‐ 16 (mmu‐ MMP‐ 16) mRNA containing the putative miR‐155 binding sequence were inserted into pGL3‐control (Promega, Madison, WI), respectively. HEK 293 cells (the cell bank of Chinese academy of sciences, catalog No. GNHu18) were cotransfected with 0.8 µg firefly luciferase reporter vector containing the target site, 100 nM miR‐155 double stranded mimics or miR‐control (Ambion, Austin, TX), and 0.04 µg Renilla luciferase control vector (pRL‐TK, Promega), using Lipofectamine 2000 (Invitrogen, Waltham, MA). Assays were performed 48 h after transfection, using the dual luciferase reporter assay system (Promega). Firefly luciferase activity was normalized to Renilla luciferase activity. The mutations on miR‐155 binding sites in human MMP‐16 3′‐UTRs were generated using the Quick Change XL Site‐Directed Mutagenesis kit (Stratagene, La Jolla, CA). Each mutation consisted of replacing four consecutive base pairs at the 3′ region of the site.
Preparation of the Lentivirus Vector
The lentiviral vector (Genechem, Shanghai, China) labeled with green fluorescent protein (GFP) encoding mmu‐pre‐miR‐155 or reverse complement sequence of mmu‐pre‐miR‐155 was employed for mmu‐pre‐miR‐155 up‐regulation and mmu‐pre‐miR‐155 knockdown. Blank lentiviral vector labelled with GFP was employed as negative control. The infectious titer of lentiviral was determined to be 5 × 10⁹ TU/ml.
Surgical Procedures and In Vivo Transduction
A total of 90 C57 mice aged 10–12 weeks were obtained from the Laboratory Animal Center of the Fourth Military Medical University, and the use of animals was reviewed and approved by the Institutional Ethical Committee of Xijing Hospital, the Fourth Military Medical University. The mice were anesthetized by intraperitoneal injection of hypnorm (0.5 ml/kg) and dormicum (0.5 ml/kg).18 These mice were divided into three groups: Up‐regulated miR‐155, down‐regulated miR‐155, and operation. The tail skin was incised longitudinally, and then the subcutaneous connective tissue and musculature were separated. In the up‐regulated miR‐155 group, the discs C3–C4 were punctured using a 31 gauge needle (BD Biosciences, San Jose, CA) through the annulus fibrosus to the depth of the needle bevel (1 mm) and injected the up‐regulation of lentivirus‐mediated miR‐155 to serve as the miR‐up group. The adjacent C4–C5 disc was punctured and injected the negative control virus to serve as the miR‐up vector group. In the down‐regulated miR‐155 group, the discs C3–C4 were punctured and injected the down‐regulation of lentivirus to serve as the miR‐down group and the adjacent C4–C5 disc was punctured and injected the negative control virus to serve as miR‐down vector group. The puncture group, the C3–C4 disc levels were exposed but not punctured to serve as controls or the sham group, and the adjacent C4–C5 puncture without lentivirus to serve as the puncture group. After the operation, the subcutaneous muscle and skin were sutured, and mice were allowed free in activity in their cages. All mice were sacrificed by injection of sodium. We monitored the health of the experimental animals every day, we did not find a case of unexpected death of animals in the whole process of the experiment.
Radiographic Analyses
Radiographs were taken at pre‐op and weeks 3, 6, and 12 after the puncture. Extreme care was taken to maintain a consistent level of anesthesia during radiography of each animal at each time point to obtain a similar degree of muscle relaxation, which may affect the disc height. Therefore, the preoperative radiograph was always used as a baseline measurement. All radiographic images were independently analyzed by using a custom program for MATLAB software (Natick, MA) by three orthopedic researchers who were blinded to the treatment groups. Data were reported as the IVD height expressed as intervertebral disc height/adjacent vertebral body height, disc‐height index (DHI).19 Changes of the DHI were expressed as %DHI (postoperative DHI/preoperative DHI).19
Histological Staining and Grading Using a Scoring System
Ten mice were sacrificed at pre‐op and week 3, 6, and 12 post‐puncture, and discs (treated and control) were harvested and sectioned as described,20 intervertebral disc specimens obtained after 4% poly formaldehyde fixed 24 h, placed in 30% DEPC—sucrose water sink to the bottom, successive sections using a frozen section machine, thickness of 16 µm, number in sequence, histological and pathological changes were observed by continuous adjacent slice staining. Before sectioning, the center portion of in the outer annulus of the disc was labeled to indicate the disc midline. The sections were deparaffinized, rehydrated in xylene, and graded ethanol stained with Hematoxylin and Eosin. Safranin O staining was performed to visualize newly synthesized cartilaginous extracellular matrix glycosaminoglycan. Briefly, sections were stained with 0.1% Safranin O and 0.05% fast green was used as counter stain. The stained sections were dehydrated, cleared, and mounted using resinous medium. A modified grading system (Table 1) was used to assess the degree of degeneration, based on the grading system of the rabbits and human beings.21, 22 The grading scores ranged from 1 to 4 for both annulus fibrosus (AF) and NP. The scores of both AF and NP were summed to evaluate the degree of degeneration.
Table 1.
Definition of the Modified Histological Grading Scale
| Loss of bounds between NP and AF | |
| 0 | Clear bounds |
| 1 | Limited loss of bounds |
| 2 | Substantial loss of bounds |
| 3 | Complete loss of bounds |
| Morphology of AF | |
| 0 | Discrete and well‐arranged lamellae |
| 1 | Moderately serpentine with rupture |
| 2 | Severely serpentine with rupture |
| 3 | Clefts formed; fragmentation of lamellae |
| Presence and extent of fissures | |
| 0 | No fissures |
| 1 | Fissures present within NP |
| 2 | Fissures extending to junction of NP and AF |
| 3 | Fissures extending to within AF |
| Cell cluster formation | |
| 0 | No cell clusters |
| 1 | ≤25% cells formed into clusters |
| 2 | 25–75% cells formed into clusters |
| 3 | ≥75% cells formed into clusters |
Immunohistochemistry (IHC)
Immunohistochemistry was performed as follows. After rehydration, mid‐sagittal sections were blocked by goat serum, treated with 0.8% hyaluronidase for 20 min at 37°C, and then incubated with rabbit anti‐mouse aggrecan antibodies (Abcam Ltd, Cambridge, MA) at 10 μg/ml for 60 min. After being rinsed in PBS, biotinylated secondary anti‐rabbit antibody (Rabbit Kit, Vector Labs) was applied for 30 min, followed by being washed in PSB and treated with avidin–biotin complex reagents. Immunoreactivity was developed using 3,3′‐diaminobenzendine (DAB) reagents (Vector Labs) and the sections were counter‐stained with hematoxylin. Keeping the settings of the microscope constant, images were captured. Sections were imaged and analyzed using Image J Software. We use fluorescence intensity for statistical analysis.
In Situ Hybridization (ISH)
To detect and localize miR‐155, we exploited the higher specificity and hybridization efficiency of locked nucleic acid (LNA) probes in frozen human NP tissues.23, 24 LNA hybridization probes labeled with digoxigenin (DIG) complementary to human mature miR‐155 and negative controls (scramble probes) were purchased from Exiqon (Copenhagen, Denmark). The miR‐155 sequences are given at http://www.microrna.org. In situ hybridization (ISH) reactions were performed as described previously.23, 25 In brief, slides were subjected to proteinase‐K digestion for 10 min and subsequently prehybridization buffer for 4 h. LNA probe (2 pM/μl) was denatured at 80°C for 5 min and then hybridized over night at 55°C. The slides were then washed in 0.2× SSC for 5 min at 57°C and then incubated in blocking buffer for 1 h at room temperature, and then in sheep Anti‐DIG Fab fragments, POD conjugated (Roche, Strasbourg, France) at room temperature overnight. Subsequently, the sections were managed with TSA(TM) Biotin System (PerkinElmer) for 30 min followed by cy3‐avidin (CST) for 2 h. 4′, 6‐Diamidino‐2‐phenylindole (DAPI) staining was used as the final step in the fluorescent staining procedure to label the cell nuclei. The semi‐quantitative analysis method of the ISH results and immunohistochemical analysis method is the same.
Gene Expression Analysis Using Real‐Time PCR
Total RNA was extracted from the NP cell using Trizol reagent (Invitrogen) according to manufacturer's instructions and quantified spectrophotometrically at 260 nm with acceptable optical density260/280 ratios between 1.8 and 2.0. The RNA quality was also determined by 1% agarose gel electrophoresis, and stained with 1 µg/ml ethidium bromide. Residual genomic DNA was removed by incubating RNA with RNase‐free DNase (Promega). Total RNA was reverse transcribed using a reverse‐transcription kit (Takara, Japan) according to the manufacturer's protocols. Real‐time PCR was performed on an ABI Prism 7900HT Fast System (Applied Biosystems) using SYBR Premix Ex TaqTM II (Takara). Amplifications were carried out in a total volume of 20 µl and cycled 40 times after initial denaturation (95°C for 30 s) with the following parameters: 95°C for 5 s and 60°C for 30 s. Primer sequences are listed in Table 2, and β‐actin was used as an internal control. The relative mRNA expression was quantified by a comparison of the cycle threshold (Ct) values. The experimental data were processed using the 2−ΔΔCt method: ΔΔCt = (Ct target − Ct internal control) experimental group‐(Ct target − Ct internal control) normal control group. Each experiment was repeated three times.26
Table 2.
Primer Sequences Used in Real‐Time PCR Experiments
| Gene | Primer sequence 5′‐3′ |
|---|---|
| mmu‐miR‐155 | F: GTGCTGCAAACCAGGAAGG |
| R: CTGGTTGAATCATTGAAGATGG | |
| has‐miR‐155 | F: GGGGTTAATGCTAATCGTGA |
| R: CAGTGCGTGTCGTGGAGT | |
| mmu‐MMP‐16 | F: AGAAGGTTGGATTTCGTGCAT |
| R: TCCGCAGACTGTAGCACATAA | |
| has‐MMP‐16 | F: AGCACTGGAAGACGGTTGG |
| R: CTCCGTTCCGCAGACTGTA | |
| β‐actin | F:GACAGGATGCAGAAGGAGATTACT |
| R: TGATCCACATCTGCTGGAAGGT |
Western Blotting
Total protein was harvested from the discs of the mice that were sacrificed at pre‐op and weeks 3, 6, and 12 post‐puncture. Equal amounts of the protein were loaded per lane (40 μg). The primary antibodies were used at a concentration of 1:1,000 for MMP‐16 and aggrecan (rabbit anti‐mouse IgG for MMP‐16 and aggrecan, Sigma–Aldrich Co.). After incubation for 2 h at room temperature and washing with PBS‐T, the membrane was incubated with horseradish peroxidase‐conjugated secondary antibodies (goat anti‐rabbit IgG for MMP‐16 and aggrecan, Sigma–Aldrich Co.) at room temperature for 1 h. Finally, the membrane was detected by the standard chemical luminescence method (ECL, Santa Cruz Biotechnology).
Statistical Analyses
All data were expressed as mean ± standard deviation. One‐way analysis of variance (ANOVA) was used to compare mean values using SPSS 13.0 software package (SPSS Inc., Chicago, IL). If there was a significant overall difference among groups, then Tukey's post hoc test was used to make pair‐wise comparisons. p‐values <0.05 were considered statistically significant.
RESULTS
Clinical Relationship Between MiR‐155, MMP‐16, MMP‐2, and IDD
We selected normal NP cells and NP cells from Pfirrmann IV patients and determined the expression of miR‐155, MMP‐2, and MMP‐16 by real‐time PCR and western blotting. Following the analysis of 10 patients and 5 cadavers, the expression of miR‐155 in patients with IDD was lower than that in the non‐degenerated cadavers (Fig. 1A). In contrast, we found that the expression of MMP‐16 mRNA and MMP‐16 protein in patients with IDD was greater than that in the non‐degenerated cadavers, and MMP‐2 was the same as MMP‐16 (Fig. 1B–E).
Figure 1.
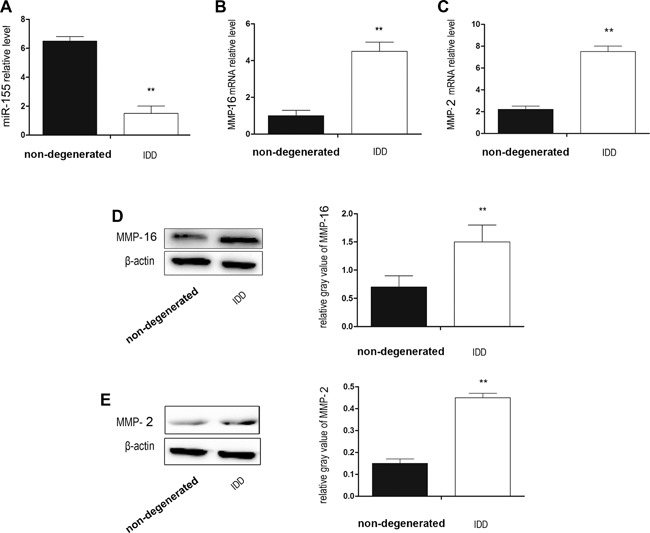
Clinical relationship between miR‐155, MMP‐16, MMP‐2, and IDD. (A) miR‐155 relative expression by real time‐PCR. Expression of miR‐155 in the IDD group was obviously lower than that in the non‐degenerated group. (B) MMP‐16 mRNA relative expression by real time‐PCR. MMP‐16 mRNA expression in the IDD group was obviously higher than that in the non‐degenerated group. (C) MMP‐2 mRNA relative expression by real time‐PCR. MMP‐2 mRNA expression in the IDD group was obviously higher than that in the non‐degenerated group. (D) Western blotting analysis of MMP‐16. The expression of MMP‐16 proteins in the IDD group was obviously higher than that in the non‐degenerated group. (E) Western blotting analysis of MMP‐2. The expression of MMP‐2 proteins in the IDD group was obviously higher than that in the non‐degenerated group. The difference between the groups was statistically significant. n = 5 in the non‐degenerated group, n = 10 in the IDD group. Data are means ± SD. **p < 0.01.
miR‐155 Inhibits MMP‐16 Expression by Directly Targeting Its 3′‐UTRs
To determine whether MMP‐16 is a direct target of miR‐155, we performed a luciferase reporter assay. Given that there was a potential binding site in the 3′‐UTR of mmuMMP‐16 with miR‐155, we validated the two binding sites separately. Consequently, the relative luciferase activity of MMP‐16 site 1 (3,055–3,062 bp), rather than MMP‐16 site 2 (3,907–3,913 bp), was markedly diminished (p < 0.01) in cells co‐transfected with miR‐155 double‐stranded mimics. In addition, mutation with four consecutive base pairs of the miR‐155 binding sites of MMP‐16 site 1 markedly abolished the suppression of luciferase activity due to miR‐155 over‐expression. These findings clearly showed that miR‐155 inhibits MMP‐16 expression by directly targeting its 3′‐UTRs (Fig. 2).
Figure 2.
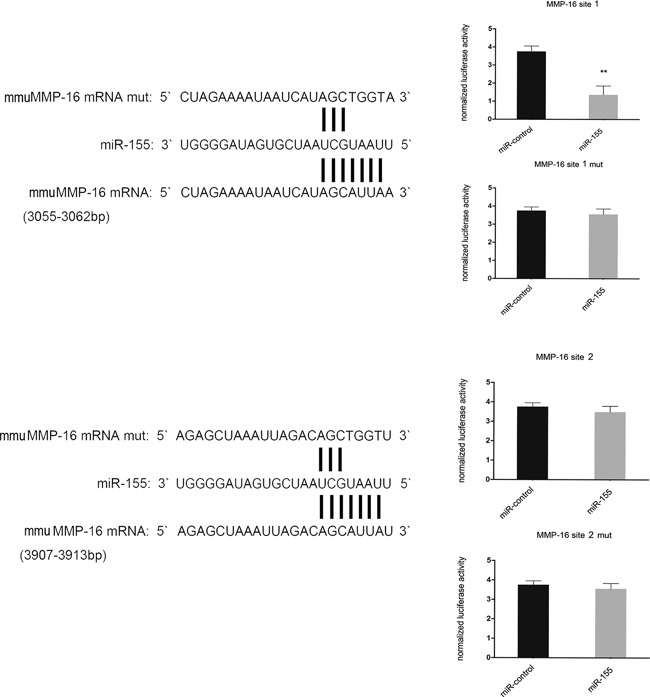
miR‐155 can inhibit MMP‐16 by directly targeting its 3′‐UTRs. Complementarity was observed between miR‐155 and the putative mmuMMP‐16 3′‐UTR target site. mmuMMP‐16 mut indicates the MMP‐16 mRNA 3′‐UTRs with four consecutive mutation sites in miR‐155 binding sites. The relative luciferase activities show the mmuMMP‐16 3′‐UTR 3,055–3,062 bp site, rather than the mmuMMP‐16 3′‐UTR 3,907–3,913 bp site, and is the binding site of miR‐155. n = 3 per group. Data are means ± SD. **p < 0.01.
Effect of Lentivirus‐Mediated miR‐155 on MMP‐16
We determined the expression and distribution of miR‐155 in NP cells using ISH. miR‐155 was distributed around the nucleus of NP, and the expression of miR‐155 in the miR‐up group was significantly higher than that in the miR‐down group (Fig. 3A). The expression of MMP‐16 and MMP‐2 was determined by western blotting. MMP‐16 and MMP‐2 expression was significantly increased in the miR‐down group, while MMP‐16 and MMP‐2 expression was significantly decreased in the miR‐up group (Fig. 3E and F). We verified the MMP‐16 mRNA, MMP‐2 mRNA, and miR‐155 results using real‐time PCR, and the results were found to be consistent with those of ISH and western blotting (Fig. 3B–D). Therefore, we ensured that lentivirus‐mediated miR‐155 was stably transfected into C57 mice NP cells with the infectious titer of 5 × 10⁹ TU/ml. We also found that lentivirus‐mediated miR‐155 could both up‐regulate and down‐regulate the expression of miR‐155. Up‐regulated miR‐155 decreased MMP‐16 and down‐regulated miR‐155 increased MMP‐16.
Figure 3.
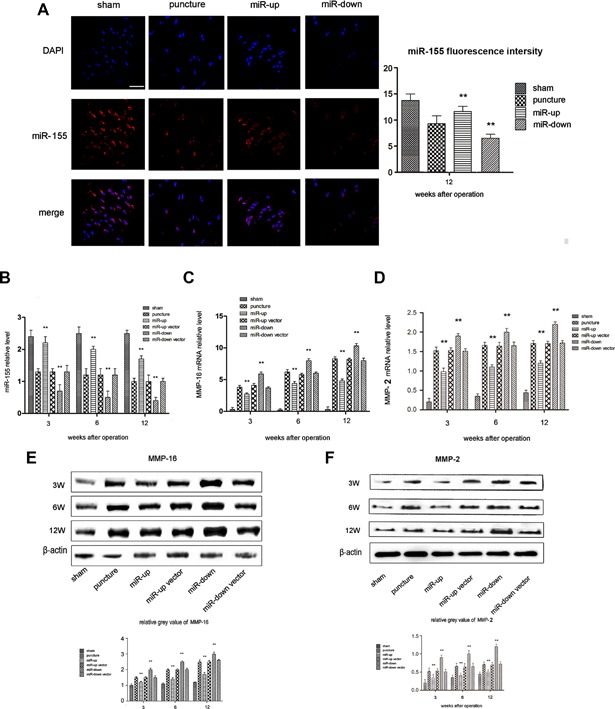
Effect of lentivirus‐mediated miR‐155 on MMP‐16. (A) ISH of mouse discs after 12 weeks. Fluorescence intensity of miR‐155 in the miR‐up group was higher than that in the sham group; the fluorescence intensity of miR‐155 in the miR‐down group was lower than that in the sham group. Scale bars, 40 µm, n = 5 per group. Data are means ± SD. **p < 0.01. (B) miR‐155 relative expression by real time‐PCR. The expression of miR‐155 in the miR‐down group was obviously lower than that in the miR‐up group. n = 5 per group. Data are means ± SD. **p < 0.01. (C) MMP‐16 mRNA relative expression by real time‐PCR. MMP‐16 mRNA expression in the miR‐down group was obviously higher than that in the miR‐up group. n = 5 per group. Data are means ± SD. **p < 0.01. (D) MMP‐2 mRNA relative expression by real time‐PCR. MMP‐2 mRNA expression in the miR‐down group was obviously higher than that in the miR‐up group. n = 5 per group. Data are means ± SD. **p < 0.01. (E) Western blotting analysis of MMP‐16. The MMP‐16 protein content in the miR‐down group was higher than that in the miR‐up group at each time point. The difference between the groups was statistically significant. n = 5 per group. Data are means ± SD. **p < 0.01. (F) Western blotting analysis of MMP‐2. The MMP‐2 protein content in the miR‐down group was higher than that in the miR‐up group at each time point. The difference between the groups was statistically significant. n = 5 per group. Data are means ± SD. **p < 0.01.
Assessment of the Impact on Disc Height
The effects of lentivirus‐mediated miR‐155 were determined by assessing changes to the %DHI compared with pre‐operation values (Fig. 4). After puncture, the %DHIs of discs that had been injected with either lentivirus‐mediated miR‐155 or negative control virus were markedly decreased (p < 0.05). The miR‐up vector and miR‐down vector groups, compared with the puncture group, showed statistically significant differences (p < 0.05). The downward trend in the miR‐down group was more obvious than the up‐regulation of lentivirus‐mediated miR‐155 (p < 0.05).
Figure 4.
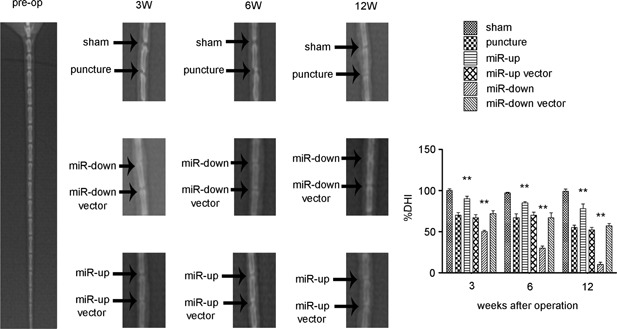
Assessment of the impact on disc height. Changes in X‐ray radiographs at pre‐operation, 3, 6, and 12 weeks after surgery. A significant decrease in DHI% in each punctured disc, compared with the sham group, was noted at 3, 6, and 12 weeks after operation. The %DHI in the miR‐up group was significantly (3 and 6 weeks p < 0.01, 12 weeks p < 0.01) higher than that in the puncture group at 3, 6, and 12 weeks, while the %DHI in the miR‐down group was significantly (3 and 6 weeks p < 0.01; 12 weeks p < 0.01) lower. No statistical differences in %DHI were noted between the puncture group, miR‐up vector group and miR‐down vector group at 3, 6, and 12 weeks after operation. n = 5 per group. Data are means ± SD. **p < 0.01.
Assessment of the Impact on Histological Score
Disc degeneration was studied histologically using HE staining and Safranin‐O staining (Fig. 5A and B). We found that discs injected with lentivirus‐mediated miR‐155 and negative control virus had lost the majority of the NP by weeks 3, 6, and 12 after the operation. We used a scoring system to assess the grading of IDD. The up‐regulated miR‐155, down‐regulated miR‐155 and puncture groups, compared with the sham group, showed statistically significant differences (p < 0.01). In addition, aggrecan was decreased at each time point, an effect that was more pronounced in the miR‐down than in the miR‐up group (p < 0.01). Compared with the puncture group, the miR‐up vector group and miR‐down vector group did not show statistically significant differences (p > 0.05). Safranin‐O staining showed that the expression of proteoglycan in the miR‐up group was significantly stronger than that in the miR‐down group.
Figure 5.
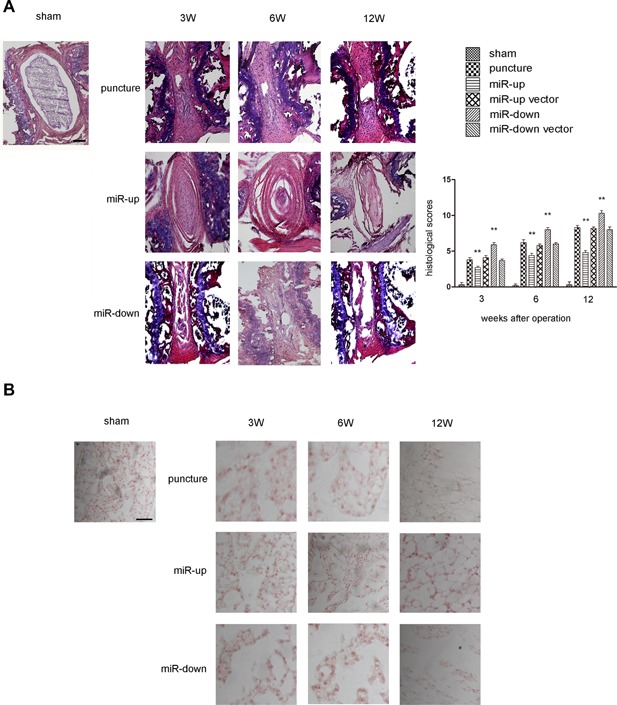
Assessment of the impact on histological score. (A) Histological images of HE staining and histological scores for operated discs in C57 mice. The histological scores for the puncture group, miR‐up group, and miR‐down group continued to increase with time at 3, 6, and 12 weeks after surgery. The histological score in the miR‐up group was significantly lower than that in the miR‐down group at 3, 6, and 12 weeks. No statistical differences in histological score were noted between the puncture group, miR‐up vector group and miR‐down vector group at 3, 6, and 12 weeks after surgery. n = 5 per group. Data are means ± SD. Scale bars, 200 µm. (B) Safranin‐O staining. The expression of proteoglycan in the puncture group, miR‐up group and miR‐down group continued to increase with time at 3, 6, 12 weeks after surgery. The expression of proteoglycan in the miR‐up group was significantly lower than that in the miR‐down group at 3, 6, and 12 weeks. No statistical differences in expression of proteoglycan were noted between the puncture group, miR‐up vector group and miR‐down vector group at 3, 6, and 12 weeks after surgery. n = 5 per group. Data are means ± SD. Scale bars, 200 µm.
Assessment of the Impact on Aggrecan
There is ample evidence to indicate that the loss of aggrecan synthesis contributes to the pathogenesis of IDD.22 IHC indicated that aggrecan staining was localized only in normal NP cells, but not in AF. We used IHC and western blotting to analyze mouse intervertebral discs. Compared with the sham group, aggrecan expression decreased significantly after puncture (p < 0.01). The amount of aggrecan staining in the miR‐down group was greater than that in the miR‐up group (p < 0.05, Fig. 6A). No statistical significance was found among the miR‐up vector group, miR‐down vector group and puncture group (p > 0.05). These findings were confirmed by western blotting (Fig. 6B).
Figure 6.
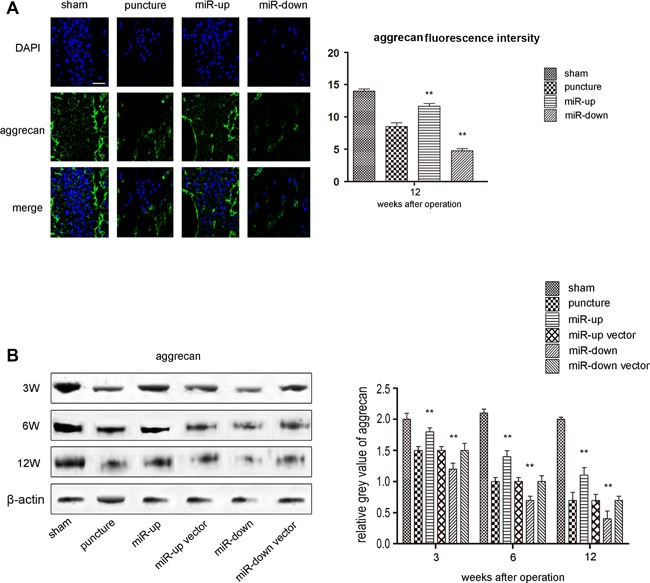
Assessment of the impact on aggrecan. (A) IHC for aggrecan in each group shows the up‐regulation of miR‐155 can enhance the expression of aggrecan while the down‐regulation of miR‐155 can inhibit the expression at 12 weeks after surgery. Scale bars, 40 µm. n = 5 per group. Data are means ± SD. **p < 0.01. (B) Western blot analysis shows that the expression of aggrecan in each punctured group continued to decrease with time at 3, 6, and 12 weeks after surgery compared with the sham group. The signal of aggrecan in the miR‐up group was higher than that in the puncture group at 3, 6, and 12 weeks, while the signal in the miR‐down group was lower. The signals in the puncture group, miR‐up vector group, and miR‐down vector group were at the same level. n = 5 per group. Data are means ± SD. **p < 0.01.
Assessment of the Impact on Collagen Type II
Using IHC, we found that collagen type II was predominantly distributed in the extracellular matrix of NP cells. Collagen type II in the puncture group was reduced compared with the sham group. Furthermore, the decrease in collagen II in the miR‐down group was greater than that in the miR‐up group (p < 0.05 Fig. 7A). No statistically significant differences were found between the miR‐up vector group, miR‐down vector group, and puncture group (p > 0.05). These results were subsequently confirmed by western blotting (Fig. 7B).
Figure 7.
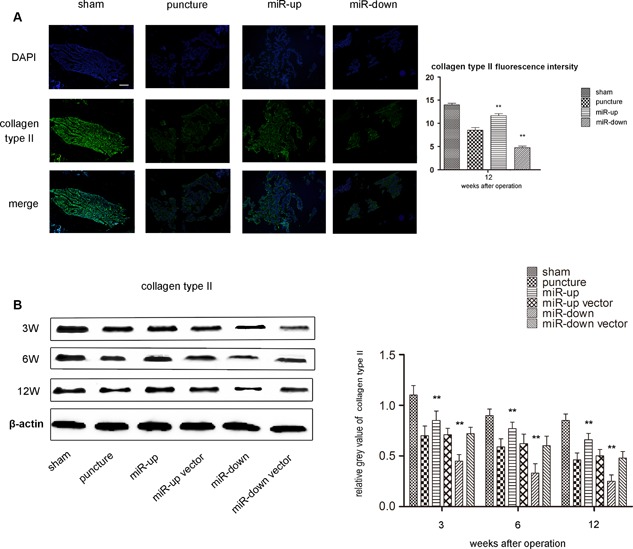
Assessment of the impact on collagen type II. (A) IHC of collagen type II in each group shows that the up‐regulation of miR‐155 can enhance the expression of collagen type II, while the down‐regulation of miR‐155 can inhibit the expression at 12 weeks after surgery. Scale bars, 40 µm. n = 5 per group. Data are means ± SD. **p < 0.01. (B) Western blot analysis shows that the expression of collagen type II in each puncture group continued to decrease with time at 3, 6, 12 weeks after surgery compared with the sham group. The signal of aggrecan in the miR‐up group was higher than that in the puncture group at 3, 6, and 12 weeks, while the signal in the miR‐down group was lower. The signals in the puncture group, miR‐up vector group, and miR‐down vector group were at the same level. n = 5 per group. Data are means ± SD. **p < 0.01.
DISCUSSION
Using the mouse annular puncture model, we determined the function of miR‐155 in IDD. The following major results were observed: (i) More severe degeneration correlated with lower miR‐155 expression. (ii) More severe degeneration correlated with higher MMP‐16 expression. (iii) miR‐155 inhibits MMP‐16 expression by directly targeting its 3′‐UTRs. (iv) Lentivirus expressing miR‐155 could be stably transfected into NP cells in C57 mice. (v) Up‐regulation of miR‐155, using a lentivirus vector, led to the down‐regulation of MMP‐16 at both the mRNA and protein levels, and down‐regulation of miR‐155 resulted in the up‐regulation of MMP‐16 at both levels. (vi) Lentiviral‐pre‐miR‐155 may attenuate IDD and, thus, miR‐155 is a potential in vivo therapeutic target. (vii) There was a correlation between MMP‐16 and MMP‐2.
In our study, we used the mouse annular puncture model. Mouse discs are reported to closely represent the geometry of human lumbar discs.27 Moreover, the mouse is more suitable as a gene therapy animal model than the rat, pig, dog, or other species. From this point of view, we applied the annular needle‐puncture to establish the IDD model in mouse tails.28 This model replicates the pathological changes occurring in human lumbar IDD.29, 30
Targets of miR‐155 have been reported in several studies.31 The direct targets of miR‐155 can be categorized into transcriptional regulatory genes, protein receptors, kinases, nuclear proteins, and binding proteins within specific cells.31 We found a correlation between miR‐155, MMP‐16, and IDD in clinical cases, and showed that miR‐155 and MMP‐16 can be combined in the luciferase report gene. This process has been proved in animal models. The present study demonstrated, for the first time, that miR‐155 regulates IDD by targeting MMP‐16 and elucidated the pathway in an animal model of disc degeneration.
Disc degeneration is characterized by matrix degradation and decreased cellularity.32 This study focused on the degradation of the extracellular matrix, and the role of MMP‐16 in degradation of the extracellular matrix was defined. However, this did not involve the death of NP cells, as our previous work found a relationship between miR‐155 and NP cell apoptosis,17 and deregulated miR‐155 promotes Fas‐mediated apoptosis in human IDD by targeting FADD and caspase‐3. The results of this study are a strong addition to our previous work, a more comprehensive explanation of the mechanism of IDD. During the present study, the role of miR‐155 in the pathological process of IDD was clarified.
Aggrecan and collagen type II are the main components that maintain the viscoelasticity of the NP structure. Collagen type II provides tensile strength to the disc and anchors the tissue to the bone.4 Aggrecan is reported to play an important role in IDD.33 The reduction of aggrecan directly results in a decrease in NP osmotic pressure, and the NP is unable to maintain hydration when under load.4 Loss of tensile strength and hydration in discs leads to the loss of disc height, formation of fissures, rupture of lamellae, and loss of bounds between the annulus fibrosus (AF) and NP. Bearing this in mind, we chose the disk height index (DHI) and histological grade as the main assessments for IDD.
Lentivirus can be stably and efficiently transfected into various mammalian cell lines and primary cells in culture.34, 35 Therefore, lentiviral vectors became an ideal vehicle to achieve efficient gene transfer. Lentiviral vectors delivered to animals also show a high level of transgene expression, strong survival ability and high replication rates without any significant side effects.36 In accordance with the advances in recombinant lentiviral vectors, we selected the lentivirus‐mediated miR‐155 annular needle‐puncture mouse model. Our ISH and real time‐PCR data validated the high transfection efficiency of the miR‐155 lentivirus in vivo.
Disc height and histological score are relatively objective evaluations of the degree of IDD. When miR‐155 expression was altered, we found corresponding changes in the degree of IDD. Our study elucidated the complete regulatory mechanism of miR‐155 in IDD. Under IDD conditions, down‐regulation of miR‐155 directly up‐regulates MMP‐16, and MMP‐16 further degrades aggrecan. These steps lead to the dehydration and degeneration of the disc. Moreover, the restoration of down‐regulated miR‐155 in degenerated NP can alleviate IDD.
There have been numerous reports on the role of MMPs in the process of IDD.37, 38, 39 In the 1990s, Malfait40 investigated an MMP inhibitor for the prevention of disc degeneration and achieved positive results. However, MMP inhibitors have not been applied in clinical research due to side effects. The present study is the first to determine that MMP‐16 is involved in the pathological process of IDD. Our experimental results showed that MMP‐16 is likely to affect the pathological process of IDD by regulating the expression of MMP‐2. This provides a new direction for the study of IDD.
Although the relationship between miR‐155, MMP‐16, and disc degeneration was clearly defined in our experiments, there are still many problems in this study that have not been resolved, such as the differences between humans and mice, cervical/thoracic/lumbar disc level, and coccygeal disc level, spontaneous/aging/smoking degeneration pathologies, and stabbing trauma degeneration pathologies. Intervertebral disc degeneration is a complicated process and involves many factors. The pathological mechanism of IDD requires further research.
In conclusion, our results suggest that deregulated miR‐155 may promote a decrease in aggrecan levels in human IDD by targeting MMP‐16. These results suggest that miR‐155 plays an essential role in the etiology of IDD. Moreover, miR‐155 might potentially be a therapeutic target for IDD that could be administered through a miR‐155 lentivirus.
AUTHORS’ CONTRIBUTIONS
All the authors participated in conducting, drafting, or revising the manuscript. All the authors approved the final version of the manuscript for submission. Z‐JL and M‐WY had full access to all of the data in the study and take responsibility for the integrity of the data and the accuracy of the data analysis. Study conception and supervision: Z‐JL and M‐WY. Sample collection and tissue preparation: W‐LZ, Y‐FC, J‐JD, and H‐ZM. Morphological staining of NP tissue: W‐LZ, Y‐FC, G‐NL, H‐QW, H‐ZM. Analysis and interpretation of data from cell biology and molecular biology: W‐LZ, Y‐FC, H‐ZM. Animal model establishing: W‐LZ, J‐JD, Y‐FC, H‐QW, and H‐ZM. Analysis and interpretation of data from X‐ray, HE and IHC‐ISH staining of mouse disc. W‐LZ, H‐ZM, Y‐FC, J‐JD. Analysis and interpretation of data from western blotting and real time‐PCR: G‐NL, Y‐FC, H‐QW, W‐LZ. Literature searching and statistics analysis: G‐NL.
ACKNOWLEDGMENTS
We would like to thank Y‐Z Nie for his technical support on the manuscript, L‐F Lan for her technical support on cell cultures and in vitro experiments, Y‐B Li and L Yang for their technical support on radiographic data collection; L‐B Cui for his technical support on western blotting analysis; X‐K Li for his technical support on sample collection.
Wei‐Lin Zhang, Yu‐Fei Chen, Hong‐Zheng Meng, Jun‐Jie Du, Guan‐Nan Luan, and Hai‐Qiang Wang contributed equally to this work.
Conflicts of interest: The authors have declared that no competing interest exists.
Contributor Information
Mao‐Wei Yang, Email: ymw69@sohu.com.
Zhuo‐Jing Luo, Email: luozhuojing@sohu.com.
REFERENCES
- 1. Waddell G. 1996. Low back pain: a twentieth century health care enigma. Spine 21:2820–2825. [DOI] [PubMed] [Google Scholar]
- 2. Maniadakis N, Gray A. 2000. The economic burden of back pain in the UK. Pain 84:95–103. [DOI] [PubMed] [Google Scholar]
- 3. Andersson GB. 1999. Epidemiological features of chronic low‐back pain. Lancet 354:581–585. [DOI] [PubMed] [Google Scholar]
- 4. Urban JP, Roberts S. 2003. Degeneration of the intervertebral disc. Arthritis Res Ther 5:120–130. [DOI] [PMC free article] [PubMed] [Google Scholar]
- 5. Eyre DR, Muir H. 1977. Quantitative analysis of types I and II collagens in human intervertebral discs at various ages. Biochim Biophys Acta 492:29–42. [DOI] [PubMed] [Google Scholar]
- 6. Urban JP, Maroudas A, Bayliss MT, et al. 1979. Swelling pressures of proteoglycans at the concentrations found in cartilaginous tissues. Biorheology 16:447–464. [DOI] [PubMed] [Google Scholar]
- 7. Weiler C, Nerlich AG, Zipperer J, et al. 2002. 2002 SSE award competition in basic science: expression of major matrix metalloproteinases is associated with intervertebral disc degradation and resorption. Eur Spine J 11:308–320. [DOI] [PMC free article] [PubMed] [Google Scholar]
- 8. d'Ortho MP, Will H, Atkinson S, et al. 1997. Membrane‐type matrix metalloproteinases 1 and 2 exhibit broad‐spectrum proteolytic capacities comparable to many matrix metalloproteinases. Eur J Biochem 250:751–757. [DOI] [PubMed] [Google Scholar]
- 9. Jung JC, Wang PX, Zhang G, et al. 2009. Collagen fibril growth during chicken tendon development: matrix metalloproteinase‐2 and its activation. Cell Tissue Res 336:79–89. [DOI] [PMC free article] [PubMed] [Google Scholar]
- 10. Roberts S, Caterson B, Menage J, et al. 2000. Matrix metalloproteinases and aggrecanase: their role in disorders of the human intervertebral disc. Spine 25:3005–3013. [DOI] [PubMed] [Google Scholar]
- 11. Rutges JP, Kummer JA, Oner FC, et al. 2008. Increased MMP‐2 activity during intervertebral disc degeneration is correlated to MMP‐14 levels. J Pathol 214:523–530. [DOI] [PubMed] [Google Scholar]
- 12. Yurube T, Takada T, Suzuki T, et al. 2012. Rat tail static compression model mimics extracellular matrix metabolic imbalances of matrix metalloproteinases, aggrecanases, and tissue inhibitors of metalloproteinases in intervertebral disc degeneration. Arthritis Res Ther 14:R51. [DOI] [PMC free article] [PubMed] [Google Scholar]
- 13. Rastogi A, Kim H, Twomey JD, et al. 2013. MMP‐2 mediates local degradation and remodeling of collagen by annulus fibrosus cells of the intervertebral disc. Arthritis Res Ther 15:R57. [DOI] [PMC free article] [PubMed] [Google Scholar]
- 14. Worm J, Stenvang J, Petri A, et al. 2009. Silencing of microRNA‐155 in mice during acute inflammatory response leads to derepression of c/ebp Beta and down‐regulation of G‐CSF. Nucl Acids Res 37:5784–5792. [DOI] [PMC free article] [PubMed] [Google Scholar]
- 15. Teng G, Papavasiliou FN. 2009. Shhh! Silencing by microRNA‐155. Philos Trans R Soc Lond B Biol Sci 364:631–637. [DOI] [PMC free article] [PubMed] [Google Scholar]
- 16. Bartel DP. 2004. MicroRNAs: genomics, biogenesis, mechanism, and function. Cell 116:281–297. [DOI] [PubMed] [Google Scholar]
- 17. Wang HQ, Yu XD, Liu ZH, et al. 2011. Deregulated miR‐155 promotes Fas‐mediated apoptosis in human intervertebral disc degeneration by targeting FADD and caspase‐3. J Pathol 225:232–242. [DOI] [PubMed] [Google Scholar]
- 18. Clowry GJ, Flecknell PA. 2000. The successful use of fentanyl/fluanisone (‘Hypnorm’) as an anaesthetic for intracranial surgery in neonatal rats. Lab Anim 34:260–264. [DOI] [PubMed] [Google Scholar]
- 19. Masuda K, Imai Y, Okuma M, et al. 2006. Osteogenic protein‐1 injection into a degenerated disc induces the restoration of disc height and structural changes in the rabbit anular puncture model. Spine 31:742–754. [DOI] [PubMed] [Google Scholar]
- 20. Walsh AJ, Bradford DS, Lotz JC. 2004. In vivo growth factor treatment of degenerated intervertebral discs. Spine 29:156–163. [DOI] [PubMed] [Google Scholar]
- 21. Nomura T, Mochida J, Okuma M, et al. 2001. Nucleus pulposus allograft retards intervertebral disc degeneration. Clin Orthop Relat Res 389:94–101. [DOI] [PubMed] [Google Scholar]
- 22. Sive JI, Baird P, Jeziorsk M, et al. 2002. Expression of chondrocyte markers by cells of normal and degenerate intervertebral discs. Mol Pathol 55:91–97. [DOI] [PMC free article] [PubMed] [Google Scholar]
- 23. Obernosterer G, Martinez J, Alenius M. 2007. Locked nucleic acid‐based in situ detection of microRNAs in mouse tissue sections. Nat Protoc 2:1508–1514. [DOI] [PubMed] [Google Scholar]
- 24. Silahtaroglu AN, Nolting D, Dyrskjot L, et al. 2007. Detection of microRNAs in frozen tissue sections by fluorescence in situ hybridization using locked nucleic acid probes and tyramide signal amplification. Nat Protoc 2:2520–2528. [DOI] [PubMed] [Google Scholar]
- 25. Nuovo GJ, Elton TS, Nana‐Sinkam P, et al. 2009. A methodology for the combined in situ analyses of the precursor and mature forms of microRNAs and correlation with their putative targets. Nat Protoc 4:107–115. [DOI] [PMC free article] [PubMed] [Google Scholar]
- 26. Meng HZ, Zhang WL, Liu F, et al. 2015. Advanced glycation end products affect osteoblast proliferation and function by modulating autophagy via the receptor of advanced glycation end products/Raf protein/mitogen‐activated protein kinase/extracellular signal‐regulated kinase kinase/extracellular signal‐regulated kinase (RAGE/Raf/MEK/ERK) pathway. J Biol Chem 290:28189–28199. [DOI] [PMC free article] [PubMed] [Google Scholar]
- 27. Lotz JC, Colliou OK, Chin JR, et al. 1998. Compression‐induced degeneration of the intervertebral disc: an in vivo mouse model and finite‐element study. Spine 23:2493–2506. [DOI] [PubMed] [Google Scholar]
- 28. Yang F, Leung VY, Luk KD, et al. 2009. Injury‐induced sequential transformation of notochordal nucleus pulposus to chondrogenic and fibrocartilaginous phenotype in the mouse. J Pathol 218:113–121. [DOI] [PubMed] [Google Scholar]
- 29. Haughton V. 2004. Medical imaging of intervertebral disc degeneration: current status of imaging. Spine 29:2751–2756. [DOI] [PubMed] [Google Scholar]
- 30. Freemont AJ, Watkins A, Le Maitre C, et al. 2002. Current understanding of cellular and molecular events in intervertebral disc degeneration: implications for therapy. J Pathol 196:374–379. [DOI] [PubMed] [Google Scholar]
- 31. Bail S, Swerdel M, Liu H, et al. 2010. Differential regulation of microRNA stability. RNA 16:1032–1039. [DOI] [PMC free article] [PubMed] [Google Scholar]
- 32. Raj PP. 2008. Intervertebral disc: anatomy‐physiology‐pathophysiology‐treatment. Pain Pract 8:18–44. [DOI] [PubMed] [Google Scholar]
- 33. Eser O, Eser B, Cosar M, et al. 2011. Short aggrecan gene repetitive alleles associated with lumbar degenerative disc disease in Turkish patients. Genet Mol Res 10:1923–1930. [DOI] [PubMed] [Google Scholar]
- 34. Lu X, Humeau L, Slepushkin V, et al. 2004. Safe two‐plasmid production for the first clinical lentivirus vector that achieves >99% transduction in primary cells using a one‐step protocol. J Gene Med 6:963–973. [DOI] [PubMed] [Google Scholar]
- 35. Davis BM, Humeau L, Slepushkin V, et al. 2004. ABC transporter inhibitors that are substrates enhance lentiviral vector transduction into primitive hematopoietic progenitor cells. Blood 104:364–373. [DOI] [PubMed] [Google Scholar]
- 36. Reichenbach M, Lim T, Reichenbach HD, et al. 2010. Germ‐line transmission of lentiviral PGK‐EGFP integrants in transgenic cattle: new perspectives for experimental embryology. Transgenic Res 19:549–556. [DOI] [PubMed] [Google Scholar]
- 37. Deng B, Ren JZ, Meng XQ, et al. 2015. Expression profiles of MMP‐1 and TIMP‐1 in lumbar intervertebral disc degeneration. Genet Mol Res 14:19080–19086. [DOI] [PubMed] [Google Scholar]
- 38. Vo NV, Hartman RA, Yurube T, et al. 2013. Expression and regulation of metalloproteinases and their inhibitors in intervertebral disc aging and degeneration. Spine J 13:331–341. [DOI] [PMC free article] [PubMed] [Google Scholar]
- 39. David G, Ciurea AV, Mitrica M, et al. 2011. Impact of changes in extracellular matrix in the lumbar degenerative disc. J Med Life 4:269–274. [PMC free article] [PubMed] [Google Scholar]
- 40. Malfait AM, Liu RQ, Ijiri K, et al. 2002. Inhibition of ADAM‐TS4 and ADAM‐TS5 prevents aggrecan degradation in osteoarthritic cartilage. J Biol Chem 277:22201–22208. [DOI] [PubMed] [Google Scholar]