

Abstract
Aims
To investigate variables at the demographic and primary care practice levels that influence the uptake of diabetic retinopathy screening.
Methods
Data were extracted from the management software of one screening programme for 21 797 people registered with 79 general practices. Uptake was examined by gender, age group, modality of screening (mobile unit at general practice versus high‐street optometrist), and by general practice. A telephone survey of high‐street optometrists provided information on the availability of screening appointments.
Results
Uptake was 82.4% during the study period, and was higher for men (83.2%) than for women (81.5%) (P = 0.001). Uptake varied by age group (P < 0.001), being lowest in those aged 12–39 years (67%). Uptake was higher for people invited to a general practice for screening by a mobile unit (83.5%) than for those invited for screening by a high‐street optometrist (82%) (P = 0.006). After adjusting for these factors and for socio‐economic deprivation score at the location of the general practice, heterogeneity in uptake rate was still observed between some practices. Our survey of optometrists indicated wide variation in the availability of time slots for screening during the week and of screening appointment provision.
Conclusions
Diabetic retinopathy screening services do not achieve high uptake among the youngest or oldest age groups. Practices in the least deprived areas had the highest uptake. Variation in uptake between general practices after adjustment for individual‐level variables and deprivation suggests that practice‐level factors may have an important role in determining rates of screening attendance.
What is new?
Uptake for diabetic retinopathy screening was higher for registered people invited for screening by a mobile unit at a general practice than for those invited for screening by a high‐street optometrist in univariate analysis.
This effect disappeared in a generalized linear mixed models analysis that included indices of socio‐economic deprivation at general practice location. These effects have not been demonstrated previously because other programmes do not typically deliver screening through both modalities.
Heterogeneity in screening uptake exists between general practices using either modality of screening.
Introduction
Diabetes mellitus is an increasing public health concern that is estimated to affect 4.5 million people in the UK 1. Diabetic eye disease is an important microvascular complication of both Type 1 and Type 2 diabetes, and may lead to visual loss if untreated 2. Although its incidence may be reduced through improved blood pressure 3 and glycaemic control 4, 5, diabetic retinopathy remains the leading cause of preventable sight loss for people of working age in the UK 6.
Non‐attendance at diabetic retinopathy screening is a major risk factor for sight‐threatening retinopathy 7, 8. The Diabetic Eye Screening Programme defines 70% as the minimum acceptable level of uptake for the current Quality Assurance Standard, with 80% considered achievable 9. A recent revision to the Quality Assurance Standard, due to come into effect in April 2017, has increased these rates to 75% and 85%, respectively 10. Although uptake across England reached 81% in 2011–2012 11, rates vary between local screening programmes 11 and between primary care practices within the same area 12. Modifiable and non‐modifiable risk factors for non‐attendance at diabetic retinopathy screening are incompletely understood and research has focused on the effects of demographic factors at the level of the person with diabetes invited for screening. Uptake has been found to be inversely related to socio‐economic deprivation with lower screening attendance rates and higher prevalence of sight‐threatening retinopathy among more deprived groups 12. Those people least likely to attend screening appointments are at greater risk of sight‐threatening retinopathy because they are more likely to have other risk factors, including poor glycaemic and blood pressure control 8. Poor awareness of the importance of retinopathy screening, psychological factors such as guilt due to poor diabetic control and fear of laser treatment, and practical barriers to attendance have also been identified as factors reducing uptake 13.
Less evidence exists on the effects of factors occurring at the level of general practices and optometrists on screening uptake. A recent qualitative case‐based study indicated that general practices with high levels of social deprivation and poorer access to screening location are less likely to achieve higher uptake 14. Further research into practice‐level factors influencing uptake is required to inform improvements in retinopathy screening services.
The Oxfordshire Diabetic Eye Screening Programme is unusual in delivering retinopathy screening through both optometrist practices and mobile screening units. Mobile units with digital retinal cameras provide screening sessions at 22 of the 79 general practices throughout Oxfordshire, and registered people are invited to make appointments for screening at those practices. Those at the remaining general practices are invited to make appointments at any one of 16 local optometrist practices. The allocation of general practices to either modality of screening is influenced by the capacity of individual practices to host a mobile screening unit, and by location, with rural general practices more likely to offer screening through mobile units. The modality of screening is the same for all registered people within each town. Combined service delivery provides an opportunity to compare retinopathy screening services delivered through mobile units and optometrist practices.
In this study, we aim to investigate demographic and primary care practice level variables that influence retinopathy screening uptake. Variance in uptake between general practices using either modality of screening is analysed to examine for unexplained heterogeneity. Data on retinopathy screening services at optometrist practices is collected to further understand practice‐level factors that may account for variance in uptake.
Participants and methods
Analyses were performed using data extracted from the Oxfordshire Diabetic Eye Screening Programme management software (OptoMize®, Emis Group PLC). The analysis was restricted to the first date of invitation for each registered person from 1 April 2012 until the end of April 2013, and includes those newly referred to the screening programme and those who had been invited in previous years. This 13‐month period was chosen so as to include one invitation for each person because the screening cycle takes just over 12 months. Data on gender, age at first invitation for screening, name and town of registered general practice, date of invitation and date of screening were collected for each person. Decile of Index of Multiple Deprivation (IMD) for the postcode of each general practice address was obtained from the Department for Communities and Local Government 15.
Data were analysed using SAS® 9.4 (SAS Institute Inc., Cary, NC, USA). Individual‐level factors contributing to uptake of retinopathy screening were examined with independent chi‐squared tests comparing uptake for registered people stratified by gender, age group and modality of screening (mobile unit at general practice versus optometrist practice).
Generalized linear mixed models (GLMM; SAS Proc GLIMMIX) were used to examine the effect of these variables on uptake along with IMD decile for each general practice. General practices were fitted as random effects, and age, gender, modality of screening and IMD group were fitted as fixed effects. Using deciles of IMD was complicated by the numbers of variables and levels in the model and, because Oxfordshire is one of the least deprived areas of England, there were very few practices in deprived areas. Deprivation at general practice address was therefore recorded as follows: IMD Group 1 incorporated deciles 1–5 (most deprived), IMD Group 2 incorporated deciles 6 and 7, IMD Group 3 incorporated decile 8, IMD Group 4 incorporated decile 9, and IMD Group 5 incorporated decile 10 (least deprived).
Screening uptake at each of the 79 general practices was determined. A funnel plot of uptake as a function of the number of people invited for routine annual screening from each general practice was performed to demonstrate heterogeneity between practices (Fig. 1).
Figure 1.
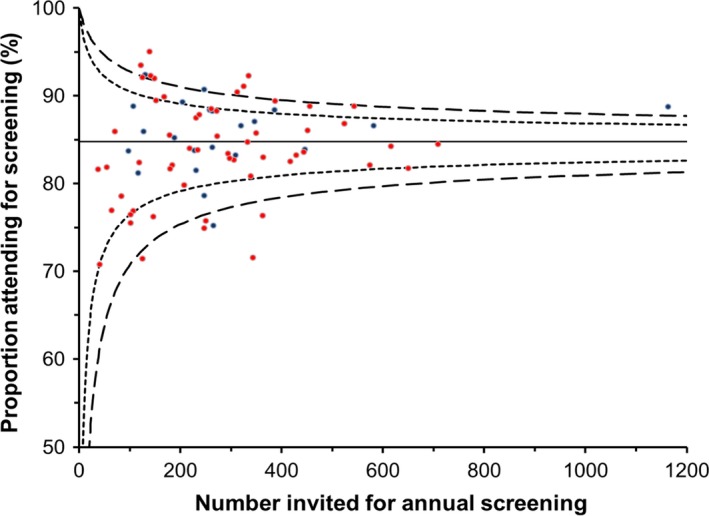
Funnel plot indicating diabetic retinopathy screening uptake as a function of number of persons invited for screening at general practitioner (GP) practices using both optometrist (red) and mobile unit (blue) screening. Horizontal line indicates mean uptake across all GP practices. Outer dashed lines indicate limits of variance from the mean to 2 SD and 3 SD.
Each of the 16 optometrist practices was contacted by telephone during the study period and asked on which days, and when on those days, they offered retinopathy screening appointments, to confirm the next available appointment from the time of the telephone call and how soon they are usually able to offer such appointments.
Results
The Oxfordshire Diabetic Eye Screening Programme invited 21 797 people for screening during the study period and 17 967 (82.4%) attended. Overall uptake rate and uptake rate for groups stratified by gender, age group and modality of screening are shown in Table 1.
Table 1.
Uptake of screening (stratified by gender, modality of screening and age group)
| No. invited | No. screened | Percentage screened | P‐value* | ||
|---|---|---|---|---|---|
| Total | 21 789 | 17 963 | 82.4 | ||
| By gender | Male | 12 384 | 10 303 | 83.2 | 0.0011 |
| Female | 9 369 | 7 633 | 81.5 | ||
| Not known | 36 | 27 | 75.0 | ||
| By modality of screening | Mobile unit | 6 530 | 5 454 | 83.5 | 0.0061 |
| Optometrist | 15 259 | 12 509 | 82.0 | ||
| By age group | 12–39 | 1 411 | 940 | 66.6 | < 0.0001 |
| 40–59 | 6 039 | 4 727 | 78.3 | ||
| 60–69 | 5 455 | 4 763 | 87.3 | ||
| 70–79 | 5 352 | 4 727 | 88.3 | ||
| 80 and over | 3 531 | 2 805 | 79.4 | ||
| Not known | 1 | 1 | 100.0 |
*Chi‐squared test.
The number of people invited for screening at each general practice ranged from 43 to 1236. Funnel plot analysis (Fig. 1) indicated that significant heterogeneity in uptake existed between general practices using either modality of retinopathy screening (minimum, 65%; maximum, 92%).
In univariate analyses using logistic regression, uptake of retinopathy screening was higher for men (83.2%) than for women (81.5%) (P = 0.001). Uptake varied between groups stratified by age (P < 0.0001), being lowest for the 12–39 years age group (67%), and increasing successively across age groups up to 79 years (40–59 years, 78%; 60–69 years, 87%; 70–79 years, 88%). Uptake declined in those aged 80 years and above (79%). Uptake was higher for people invited for screening by mobile units (83.5%) than for those invited for screening by high‐street optometrists (82%) (P = 0.006).
Table 2 describes what are in the three GLMM. Model 3 has the best fit because it has the smallest log likelihood.
Table 2.
Estimates for 2 level generalized dichotomous models of screening uptake
| Model 1 | Model 2 | Model 3 | |
|---|---|---|---|
| Fixed effects | |||
| Intercept | 1.55 (0.04) | 1.40 (0.07) | 1.63 (0.09) |
| Age group | Yes | Yes | |
| Gender | Yes | Yes | |
| Modality of screening | Yes | Yes | |
| Index of Multiple Deprivation group of general practice | Yes | ||
| Error variance | |||
| Level 2 intercept | 0.114 (0.026) | 0.099 (0.023) | 0.080 (0.021) |
| Model fit | |||
| Model fit – twice the log likelihood | 2024.6 | 1468.6 | 1462.5 |
The results of the GLMM are shown in Table 3. As in the univariate analysis, uptake varied between groups stratified by age and was lowest in the youngest age group. In Table 3, where IMD Group 1 are the most deprived and IMD Group 5 are the least deprived, the odds ratios show that those people with general practitioners in the most‐deprived areas are least likely to attend for screening; IMD Group 1 (0.75, 95% confidence interval (CI), 0.58 to 0.96) compared with IMD Group 2 (0.66, 95% CI, 0.53 to 0.96).
Table 3.
Results of the generalized mixed models analysis
| Odds ratio | 95% CI | P‐value | ||
|---|---|---|---|---|
| Age group | 12–39 | 0.52 | 0.45 to 0.60 | < 0.0001 |
| 40–59 | 0.95 | 0.85 to 1.05 | 0.29 | |
| 60–69 | 1.76 | 1.56 to 1.98 | < 0.0001 | |
| 70–79 | 1.96 | 1.74 to 2.21 | < 0.0001 | |
| Gender | Female | 0.91 | 0.85 to 0.98 | 0.014 |
| Male | Reference | |||
| Modality of screening | Mobile unit | 0.99 | 0.83 to 1.18 | 0.88 |
| Optometrist | Reference | |||
| General practice Index of Multiple Deprivation score | Group 1 | 0.75 | 0.58 to 0.96 | 0.02 |
| Group 2 | 0.66 | 0.53 to 0.96 | < 0.0001 | |
| Group 3 | 0.80 | 0.63 to 1.02 | 0.070 | |
| Group 4 | 0.82 | 0.66 to 1.01 | 0.063 | |
| Group 5 | Reference |
In contrast to the univariate analyses, gender and modality of screening were found to have no significant effect on uptake in the GLMM after age group and deprivation score of general practice were included. The results of the GLMM indicate significant heterogeneity in uptake between general practices using either modality of screening, even after accounting for differences in gender, age, modality of screening and deprivation score. In the GLMM, the intraclass correlation coefficient was 0.03, indicating that 3% of the variability in the screening rate was accounted for by general practices and 97% was accounted for by individual‐level or other factors. After fitting the individual‐level factors and the practice‐level factors, 14 of the general practices had a significant effect at the P = 0.05 level, and four at the P = 0.01 level.
Our telephone survey of 16 optometrist practices indicated heterogeneity in the availability and flexibility of appointments (Appendix 1). The time available for people wishing to book appointments for retinopathy screening with no eye examination varied between practices (median = 23 h/week; minimum = 4 h, maximum = 47 h). Next‐day appointments for retinopathy screening were offered by four optometrist practices, and two practices stated that they were usually able to offer appointments within 48 h. Most optometrist practices (n = 10) were able to offer appointments within 1 week. One optometrist practice (practice A) could only offer appointments in 4 weeks' time. Weekend appointments were offered by 10 optometrist practices and one practice stated that they would consider offering a screening appointment outside normal opening hours.
Discussion
Oxfordshire Diabetic Eye Screening Programme achieved an overall screening uptake of 82.4% during the study period. Although this rate is above that defined as achievable by the current Quality Assurance Standard and is just below the achievable rate in the new Quality Standard, it indicates that a significant minority of those invited did not attend screening. These non‐attenders are likely to be young people, in whom a longer time interval between diabetic registration and attendance for screening results in greater risk of referable retinopathy being present at the time of first screening 8.
Consistent with previous studies 16, 17, 18, 19, rates of attendance were lowest in the youngest age group. Lower uptake in this group represents a lost opportunity to limit the progression of disease because younger people are at highest risk of developing future retinopathy 18. As well as increased risk of visual loss, the progression of sight‐threatening retinopathy in young people engenders huge socio‐economic cost to society. Despite the trend of higher uptake with increasing age, the reduction in attendance rates in those aged over 80 years may relate to reduced mobility or comorbidity limiting access to diabetic retinopathy screening services.
Our analysis of the effect of individual‐level factors on uptake benefits from being based on a dataset of all registered people invited for retinopathy screening over 1 year. Data on ethnicity and measurements of blood pressure and glycaemic control for people in our study group were not available to the screening programme and we were thus unable to analyse the effect of these factors.
Uptake was higher for those invited for screening by mobile units than for those invited for screening by a high‐street optometrist. However, this effect disappeared in the GLMM that included indices of socio‐economic deprivation at the general practice location, reflecting the fact that registered people in more deprived locations are more likely to be offered screening by a high‐street optometrist than by a mobile unit. These effects have not been demonstrated previously because other screening programmes do not typically deliver screening through both modalities. Although the difference in overall uptake between the two screening modalities is small in both univariate analysis and the GLMM, the clinical relevance of this finding relates to optometrists having argued that they offer a wider range of services in terms of possible timings of screening appointments than a mobile screening service. However, the range of services offered by individual optometrist practices within Oxfordshire is highly variable and, given this variation, no increase in uptake within optometrist practices has been demonstrated in this study.
The results of our telephone questionnaire suggest that some of the variance in uptake between those invited for optometrist screening may be due to variation in the availability and flexibility of screening appointments offered by optometrists in different locations. As noted in the case of ‘practice A’, limited availability of time slots for screening during the week correlated with long waiting times for appointments. Such data are valuable in evaluating screening service provision in different locations.
Consistent with previous studies 12, we found that uptake rates for screening remain lower at practices located in areas of higher socio‐economic deprivation. Oxfordshire Diabetic Eye Screening Programme needs to encourage uptake among socio‐economically deprived groups because these people are at the highest risk of sight‐threatening diabetic retinopathy. IMD score includes the Education, Skills and Training Deprivation Domain which measures the lack of attainment and skills in the local population. Further work should include efforts to determine how one may engage more effectively with those who have a lower educational level, particularly those with poor literacy, health literacy and numeracy.
It is our opinion that general practice likely has a greater effect on screening attendance of registered persons than does the modality of screening they attend. Heterogeneity in screening uptake exists between general practices using either modality of retinopathy screening (see Fig. 1), and this remains true even after adjusting for socio‐economic deprivation at the location of the general practice. Although previous studies note greater variance in uptake between general practices than would be expected based on their respective local populations 12, we are unaware of any that have demonstrated such variance quantitatively at a practice level. Variance likely relates to complex interactions between modifiable and non‐modifiable risk factors for non‐attendance 14.
When looking at four practices individually, three with lower uptake and one with higher uptake, factors that appeared to influence practice uptake apart from socio‐economic factors were: the convenience of the screening location, with ease of parking near the location; minority language barriers; and general interest taken by the practice in diabetes care. Within the group who were socio‐economically disadvantaged, it was notable that poor areas of Oxford are served by optometrists, but optometrist practices are not generally located in the poorer parts of the city.
Identifying general practices achieving low levels of uptake provides a basis for further work to assess modifiable risk factors for non‐attendance and implement interventions where required. This further work could include examining whether screening uptake varies with practice‐level factors such as uptake of patient education resources, the provision of diabetes specialist nurses, whether there is a general practitioner responsible for people with diabetes at the practice, and who registered persons routinely see at the practice for diabetes care.
In conclusion, this study has indicated that existing diabetic retinopathy screening service provision by Oxfordshire Diabetic Eye Screening Programme may not be effective at achieving high uptake among the youngest or oldest age groups. Uptake rates for screening are lower at practices located in areas of higher socio‐economic deprivation. Uptake rates have not been found to be higher for those accessing screening services via high‐street optometrists, despite this modality of screening being thought to offer increased appointment flexibility above that of mobile units. Significant unexplained heterogeneity in uptake between general practices using either modality of retinopathy screening suggests that practice‐level factors may have an important role in determining rates of attendance. Further work should be aimed at determining the extent to which this variance can be accounted for by modifiable practice‐level factors that may be amenable to intervention.
Funding sources
None.
Competing interests
None declared.
Acknowledgements
RBRM wishes to thank Professor John McKnight (Consultant Diabetologist, NHS Lothian) and the Scottish Diabetes Research Network for awarding him a Fellowship Prize to support the completion of this project.
Author contributions
RBRM wrote the report and designed and conducted the optometrist telephone survey. IMS conducted the statistical analyses. PHS, IMS, SJC and HL all provided input on study design and commented on drafts of the paper. Professor Peter Scanlon is the guarantor of this work and takes responsibility for the integrity of the data and the accuracy of the data analysis.
Appendix 1. Optometrist survey data
| A | B | C | D | E | F | G | H | I | J | K | L | M | N | O | P | |
|---|---|---|---|---|---|---|---|---|---|---|---|---|---|---|---|---|
| Q1 | 8 | 15 | 46.5 | 42.5 | 30 | 32.5 | 25.5 | 34 | 8 | 14 | 3.75 | 22.75 | 22.5 | 16 | 36.5 | 15 |
| Q2 | No | Yes | Yes | Yes | No | Yes | Yes | No | Yes | No | Yes | No | Yes | No | Yes | Yes |
| Q3 | 35 | 5 | 4 | 1 | 11 | 10 | 3 | 2 | 5 | 3 | 1 | 3 | 1 | 10 | 1 | 7 |
| Q4 | > 1 month (4‐6 weeks typically) | < 1 week | < 1 week | < 48 h | > 1 week | < 1 week | > 1 week | < 48 h | > 1 week (7–8 days typically) | < 1 week | < 1 week | > 1 week | < 1 week | > 1 week | < 1 week | < 1 week |
| Q5 | Yes | No | No | Yes | Yes | Yes | Yes | Yes | No | Yes | No | Yes | No | No | No | Yes |
| Q6 | No | No | No | No | No | No | No | No | No | No | No | No | No | No | No | Yes |
| Overall score | 2 | 6 | 11 | 11 | 7 | 9 | 9 | 9 | 5 | 6 | 4 | 7 | 7 | 4 | 9 | 7 |
Diabet. Med. 34, 993–999 (2017)
Notes
A to P, Optometrist practices that responded to the telephone survey (anonymized).
Q1: Estimate the total shop hours per week available to book diabetic retinopathy screening appointments. Q2: Are screening appointments ever available at weekends? Q3: When is the first appointment that you could offer me for diabetic retinopathy screening (number of practice days)? Q4: How quickly are you typically able to offer people an appointment when they contact you? Q5: Would you consider flexible appointments outside the normal shop hours that you currently offer for diabetic retinopathy screening? Q6: Would you consider flexible appointments outside normal shop opening hours for diabetic retinopathy screening?
Overall score – sum of days available: +1 (if screening available at weekend); +3 (if screening available within 1 week); +2 (if screening available in 2 weeks); +1 (if screening possible outside normal diabetic retinopathy screening hours).
References
- 1. Diabetes UK: facts and stats PDF (website). Available at https://www.diabetes.org.uk/Professionals/Position-statements-reports/Statistics/ Last accessed 26 January 2017.
- 2. Gulliford MC, Dodhia H, Chamley M, McCormick K, Mohamed M, Naithani S et al Socio‐economic and ethnic inequalities in diabetes retinal screening. Diabet Med 2010; 27: 282–288. [DOI] [PubMed] [Google Scholar]
- 3. UK Prospective Diabetes Study Group . Tight blood pressure control and risk of macrovascular and microvascular complications in type 2 diabetes: UKPDS 38. BMJ 1998; 317: 703–713. [PMC free article] [PubMed] [Google Scholar]
- 4. UK Prospective Diabetes Study (UKPDS) Group . Intensive blood glucose control with sulphonylureas or insulin compared with conventional treatment and risk of complications in patients with type 2 diabetes (UKPDS 33). Lancet 1998; 352: 837–853. [PubMed] [Google Scholar]
- 5. The Diabetes Control and Complications Trial (DCCT) Research Group . The effect of intensive treatment of diabetes on the development and progression of long‐term complications in insulin‐dependent diabetes mellitus. N Engl J Med 1993; 329: 977–986. [DOI] [PubMed] [Google Scholar]
- 6. Liew G, Michaelides M, Bunce C. A comparison of the causes of blindness certifications in England and Wales in working age adults (16–64 years), 1999–2000 with 2009–2010. BMJ Open 2014; 4: e004015. [DOI] [PMC free article] [PubMed] [Google Scholar]
- 7. Scanlon PH, Aldington SJ, Stratton IM. Delay in diabetic retinopathy screening increases the rate of detection of referable diabetic retinopathy. Diabet Med 2014; 31: 439–442. [DOI] [PMC free article] [PubMed] [Google Scholar]
- 8. Scanlon PH, Stratton IM, Leese GP, Bachmann MO, Land M, Jones C et al; on behalf of the Four Nations Diabetic Retinopathy Screening Study Group . Screening attendance, age group and diabetic retinopathy level at first screen. Diabet Med 2016; 33: 904–911. [DOI] [PMC free article] [PubMed] [Google Scholar]
- 9. UK National Screening Committee . Interim quality standards and performance objectives for Diabetic Eye Screening Programmes pending a full standards review. Available at https://www.gov.uk/government/uploads/system/uploads/attachment_data/file/544585/Interim_QA_Standards_v1_11_final_issue.pdf Last accessed 28 August 2016.
- 10. Public Health England . Pathway Standards for NHS Diabetic Eye Screening Programme. Available at https://www.gov.uk/government/uploads/system/uploads/attachment_data/file/543686/Diabetic_eye_screening_pathway_standards.pdf Last accessed 26 January 2017.
- 11. NHS England . Diabetes Data 2011–12. The number of people who have been offered screening for diabetic retinopathy as part of a systematic programme that meets national standards. Available at https://www.england.nhs.uk/statistics/statistical-work-areas/integrated-performance-measures-monitoring/diabetes-data Last accessed 26 January 2017.
- 12. Scanlon PH, Carter SC, Foy C, Husband RF, Abbas J, Bachmann MO. Diabetic retinopathy and socioeconomic deprivation in Gloucestershire. J Med Screen 2008; 15: 118–121. [DOI] [PubMed] [Google Scholar]
- 13. Lewis K, Patel D, Yorston D, Charteris D. A qualitative study in the United Kingdom of factors influencing attendance by patients with diabetes at ophthalmic outpatient clinics. Ophthalmic Epidemiol 2007; 14: 375–380. [DOI] [PubMed] [Google Scholar]
- 14. Lindenmeyer A, Sturt JA, Hipwell A, Stratton IM, Al‐Athamneh N, Gadsby R et al Influence of primary care practices on patients' uptake of diabetic retinopathy screening: a qualitative case study. Br J Gen Pract 2014; 64: e484–e492. [DOI] [PMC free article] [PubMed] [Google Scholar]
- 15. Department for Communities and Local Government . English Indices of Deprivation 2015. Available at https://www.gov.uk/government/statistics/english-indices-of-deprivation-2015 Last accessed 16 December 2016.
- 16. Cook M, Forrest D, Watts G. Diabetic retinopathy screening: health equity audit for Bolton Diabetes Screening Programme 2014. Available at http://www.boltonshealthmatters.org/knowledgehub/health-equity-audit-bolton-diabetes-screening-programme-2014 Last accessed 26 January 2017.
- 17. Leese GP, Boyle P, Feng Z, Emslie‐Smith A, Ellis JD. Screening uptake in a well‐established diabetic retinopathy screening program: the role of geographic access and deprivation. Diabetes Care 2008; 31: 2131–2135. [DOI] [PMC free article] [PubMed] [Google Scholar]
- 18. Sachdeva A, Stratton IM, Unwin J, Moreton RBR, Scanlon PH. Diabetic retinopathy screening: study to determine risk factors for non‐attendance. Diabetes Primary Care 2012; 14: 308–316. [Google Scholar]
- 19. Millett C, Dodhia H. Diabetes retinopathy screening: audit of equity in participation and selected outcomes in South East London. J Med Screen 2006; 13: 152–155. [DOI] [PubMed] [Google Scholar]