

Abstract
Aim
This sub‐analysis of the ODYSSEY COMBO II study compared the effects of alirocumab, a proprotein convertase subtilisin/kexin type 9 (PCSK9) inhibitor, in high cardiovascular risk patients with or without diabetes mellitus (DM) receiving maximally tolerated statin therapy.
Methods
COMBO II was a 104‐week, double‐blind study (n = 720) enrolling patients with documented atherosclerotic cardiovascular disease (ASCVD) and baseline LDL‐C ≥70 mg/dL (1.8 mmol/L), and patients without documented ASCVD at high cardiovascular risk with LDL‐C ≥100 mg/dL (2.6 mmol/L). Patients receiving maximally tolerated statin therapy were randomized (2:1) to alirocumab 75 mg every 2 weeks (Q2W; 1 mL subcutaneous injection) or oral ezetimibe 10 mg daily. Alirocumab dose was increased to 150 mg Q2W (also 1 mL) at Week 12 if Week 8 LDL‐C was ≥70 mg/dL.
Results
History of DM was reported in 31% (n = 148) of patients on alirocumab and 32% (n = 77) of patients on ezetimibe. At Week 24, alirocumab consistently reduced LDL‐C from baseline in patients with (−49.1%) or without DM (−51.2%) to a significantly greater extent than ezetimibe (−18.4% and −21.8%, respectively). Occurrence of treatment‐emergent adverse events was similar between groups. Efficacy results at 104 weeks were similar to those at 24 weeks.
Conclusions
Over a 104‐week double‐blind study period, alirocumab provided consistently greater LDL‐C reductions than ezetimibe, with similar LDL‐C results in patients with or without DM. Safety of alirocumab was similar regardless of baseline DM status.
Keywords: cardiovascular disease, clinical trial, dyslipidaemia, type 1 diabetes, type 2 diabetes
1. INTRODUCTION
Diabetes mellitus (DM) is associated with an atherogenic lipid profile, typically characterized by elevated levels of plasma triglycerides (TGs) and reduced concentrations of high‐density cholesterol (HDL‐C).1 Individuals with diabetes mellitus (DM) are considered to be at high risk of atherosclerotic cardiovascular disease (ASCVD), and guidelines recommend that such patients receive lipid‐lowering treatment to reduce levels of low‐density lipoprotein cholesterol (LDL‐C).2, 3, 4 In addition, levels of non‐high‐density lipoprotein cholesterol (non‐HDL‐C) more closely align with cardiovascular risk in individuals with DM, and reducing non‐HDL‐C has been recommended as an alternative treatment target.5 However, a high percentage of patients with DM fail to achieve adequate control of LDL‐C or non‐HDL‐C levels with existing lipid‐lowering therapies and therefore remain at high risk of ASCVD.
Alirocumab is a fully human monoclonal antibody that inhibits proprotein convertase subtilisin/kexin type 9 (PCSK9). In the ODYSSEY Phase 3 clinical trial program, comprising a comprehensive evaluation of alirocumab in patients with dyslipidaemia and increased ASCVD risk (including 31.0% with DM, n = 223), alirocumab was associated with average reductions in LDL‐C of 49% with alirocumab 75 mg/150 mg every 2 weeks (Q2W; 75 mg/150 mg denotes that the initial dose of 75 mg Q2W was increased to 150 mg Q2W at Week 12 depending on Week 8 LDL‐C), and 61% with alirocumab 150 mg Q2W.6, 7 In the 104‐week, Phase 3 ODYSSEY COMBO II trial (n = 720), as previously reported, alirocumab 75 mg/150 mg Q2W significantly reduced LDL‐C vs ezetimibe in high risk cardiovascular patients receiving background maximally tolerated statin. Mean ± SE reductions in LDL‐C from baseline at Week 24 were 50.6% ± 1.4% for alirocumab vs 20.7% ± 1.9% for ezetimibe (P < .0001).8 Approximately one third of patients in COMBO II had DM at baseline (n = 225) and 24‐week data revealed similar reductions in LDL‐C in patients with or without DM.8 The purpose of this sub‐analysis was to investigate in greater detail whether the efficacy and safety of alirocumab, administered to patients receiving maximally tolerated statin, differs between those with DM and those without DM over the long term, using data from the COMBO II study.
2. METHODS
The double‐blind COMBO II study (clinicaltrials.gov identifier: NCT01644188) enrolled patients with documented ASCVD and baseline LDL‐C ≥70 mg/dL (1.8 mmol/L) and patients without documented ASCVD but with other risk factors and LDL‐C ≥100 mg/dL (2.6 mmol/L). All patients in the study were defined as being at high cardiovascular risk. ASCVD was defined as the presence of coronary heart disease (CHD), peripheral artery disease (PAD) or ischaemic stroke. Other risk factors included moderate chronic kidney disease (estimated glomerular filtration rate (eGFR) <60mL/min/1.73 m2, for 3 months or more, including screening; note that patients with eGFR <30 mL/min/1.73 m2 were excluded from the study) and known history of diabetes in addition to ≥2 additional related risk factors (including hypertension, ankle‐brachial index ≤0.90, microalbuminuria or macroalbuminuria or dipstick urinalysis at screening with >2+ protein, history of pre‐proliferative or proliferative retinopathy, family history of premature CHD). Trial methods have been published in detail elsewhere.9 The study was performed in accordance with principles of the Declaration of Helsinki and all applicable amendments by the World Medical Assemblies and the International Conference on Harmonization Guidelines for Good Clinical Practice. The protocol was approved by the institutional review boards of participating centres. All participants gave written informed consent.
2.1. Patients
Patients were randomized (2:1) to subcutaneous (SC) alirocumab 75 mg Q2W or oral ezetimibe 10 mg/d. At Week 12, the alirocumab dose was increased to 150 mg Q2W if Week 8 LDL‐C was ≥70 mg/dL (1.8 mmol/L) (Figure S1). DM at baseline was considered present if a Custom Medical Dictionary for Regulatory Activities (MedDRA) Query (CMQ) of the medical history reported “diabetes.”
All patients were receiving concomitant maximally tolerated statin therapy (defined as atorvastatin 40‐80 mg, rosuvastatin 20‐40 mg, or simvastatin 80 mg), unless an investigator‐approved reason was given, for example, intolerance to high doses. Other background non‐statin lipid‐lowering therapies were not allowed. Patients were instructed to remain on a National Cholesterol Education Program Adult Treatment Panel III therapeutic lifestyle changes diet or equivalent and to maintain the same daily dose of statin throughout the study.9
2.2. Endpoints
The present analysis compared alirocumab efficacy and safety in high risk cardiovascular patients with or without DM over a period of 104 weeks,8, 9 and was a sub‐analysis of the COMBO II study. The primary efficacy endpoint was pre‐specified, while the secondary endpoints and safety assessments were post‐hoc analyses. The primary efficacy endpoint was the percent change in calculated LDL‐C from baseline to Week 24, analysed using an intent‐to‐treat (ITT) approach including all lipid data, whether patients were on or off treatment. An on‐treatment analysis using lipid data collected during the treatment period was also conducted with all patients who received at least 1 dose or part of a dose of the double‐blind study injection and had an evaluable primary efficacy endpoint during the efficacy treatment period. Secondary endpoints included percent change from baseline in LDL‐C at Week 12 (before potential alirocumab dose increase); achievement of risk‐based LDL‐C goals at Week 24; percent changes from baseline in HDL‐C, TGs, non‐HDL‐C, apolipoprotein (Apo) B, Apo A1 and lipoprotein (a) [Lp(a)] at Week 24. Percent changes in all lipids are also presented up to Week 104, using both ITT and on‐treatment approaches. Safety was assessed through analysis of adverse event (AE) reports and laboratory analyses (including mean change in fasting glucose [FG] and glycated haemoglobin [HbA1c] at Week 24) from the time of signed informed consent until end of study, with a 70‐day follow‐up period.
2.3. Statistical analyses
Efficacy endpoints were analysed using a mixed effect model with a repeated measures approach to account for missing data for all lipid parameters, except Lp(a) and TGs and achievement of LDL‐C goals, which were analysed using a multiple imputation approach for handling of missing values, followed by robust regression, and achievement of LDL‐C goals, which was analysed using a multiple imputation approach for handling of missing values, followed by logistic regression. The significance level of the treatment‐by‐DM subgroup factor interaction term at Week 24 was also derived from the mixed effect model with repeated measures. Safety data were analysed using descriptive statistics. Analyses were performed using SAS version 9.2 software (SAS Institute Inc., Cary, North Carolina).
3. RESULTS
Overall, 720 patients were randomized, including 225 (31%) patients with DM and 495 (69%) without DM. DM patients were evenly distributed in the alirocumab (n = 148; 31%) and ezetimibe arms (n = 77; 32%). Across the treatment and DM subgroups, the mean age was 60.4 to 63.2 years and mean body mass index ranged from 29.2 to 32.5 kg/m2 (Table 1). Baseline levels of lipids, including LDL‐C, non‐HDL‐C, apo B, Lp(a) and HDL‐C, were similar between the alirocumab and ezetimibe groups within the DM and non‐DM subgroups (Table 1). Mean baseline HbA1c was 6.8% in patients with DM and 5.7% in patients without DM. Mean baseline FG was 134.1 mg/dL (7.44 mmol/L; alirocumab) and 132.0 mg/dL (7.33 mmol/L; ezetimibe) in DM subgroups and 104.0 mg/dL (5.77 mmol/L; alirocumab) and 103.6 mg/dL (5.75 mmol/L; ezetimibe) in non‐DM subgroups (Table 1). For the DM cohort, the mean duration of DM was 9.5 years in both treatment arms. Furthermore, 85.1% and 81.8% of patients with DM were receiving at least 1 glucose‐lowering agent at randomization in the alirocumab and ezetimibe groups, respectively. In total, 22.3% in the alirocumab group and 16.9% in the ezetimibe group were receiving insulin therapy at baseline. Alirocumab dose was increased per protocol from 75 to 150 mg Q2W at Week 12 if Week 8 LDL‐C was ≥70 mg/dL (1.8 mmol/L) in 20% and 18% of those with or without DM, respectively.
Table 1.
Demographics, clinical characteristics and medical history in patients with or without diabetes mellitus (DM) (randomized population)
| Patients with DMa (n = 225) | Patients without DM (n = 495) | |||
|---|---|---|---|---|
| Alirocumab (n = 148) | Ezetimibe (n = 77) | Alirocumab (n = 331) | Ezetimibe (n = 164) | |
| Age, years, mean (SD) | 62.8 (9.1) | 63.2 (8.8) | 61.2 (9.5) | 60.4 (9.3) |
| Male, % (n) | 69.6 (103) | 63.6 (49) | 77.6 (257) | 73.8 (121) |
| Race, white, % (n) | 82.4 (122) | 81.8 (63) | 85.2 (282) | 87.2 (143) |
| BMI, kg/m2, mean (SD) | 31.6 (5.9) | 32.5 (5.2) | 29.3 (5.0) | 29.2 (4.7) |
| ASCVD, % (n) | 89.2 (132) | 79.2 (61) | 99.4 (329) | 99.4 (163) |
| CHDb | 82.4 (122) | 72.7 (56) | 95.2 (315) | 95.1 (156) |
| ACS | 58.1 (86) | 51.9 (40) | 74.3 (246) | 76.8 (126) |
| Coronary revascularization procedure | 56.8 (84) | 54.5 (42) | 74.3 (246) | 75.0 (123) |
| Other clinically significant CHD | 34.5 (51) | 33.8 (26) | 41.7 (138) | 34.8 (57) |
| PAD | 8.8 (13) | 6.5 (5) | 3.3 (11) | 4.3 (7) |
| Ischaemic stroke | 10.8 (16) | 7.8 (6) | 7.3 (24) | 8.5 (14) |
| DM and ≥2 additional risk factorsc, % (n) | 40.5 (60) | 40.3 (31) | 0 | 0 |
| Mean baseline HbA1c, % (SD) | 6.8 (0.8) | 6.8 (0.8) | 5.7 (0.4) | 5.7 (0.4) |
| Mean baseline FG, mg/dL [mmol/L], mean (SD) | 134.1 (37.3) | 132.0 (39.8) | 104.0 (14.8) | 103.6 (15.3) |
| [7.44 (2.07)] | [7.33 (2.21)] | [5.77 (0.82)] | [5.75 (0.85)] | |
| Mean duration of DM, years (SD) | 9.5 (9.2) | 9.5 (9.4) | – | – |
| Baseline lipids | ||||
| Calculated LDL‐C, mg/dL [mmol/L], mean (SD) | 108.2 (33.7) | 99.3 (30.4) | 108.7 (37.7) | 107.2 (35.6) |
| [2.8 (0.9)] | [2.6 (0.8)] | [2.8 (1.0)] | [2.8 (0.9)] | |
| Non‐HDL‐C, mg/dL [mmol/L], mean (SD) | 142.6 (41.3) | 131.3 (31.7) | 137.6 (40.0) | 139.3 (43.7) |
| [3.7 (1.1)] | [3.4 (0.8)] | [3.6 (1.0)] | [3.6 (1.1)] | |
| Total cholesterol, mg/dL [mmol/L], mean (SD) | 186.2 (41.5) | 174.2 (32.4) | 186.6 (41.2) | 188.5 (44.9) |
| [4.8 (1.1)] | [4.5 (0.8)] | [4.8 (1.1)] | [4.9 (1.2)] | |
| Apo B, mg/dL, mean (SD) | 98.2 (23.8) | 90.6 (19.0) | 92.6 (22.7) | 94.9 (24.8) |
| Apo‐A1, mg/dL [mmol/L], mean (SD) | 135.5 (21.8) | 133.3 (23.4) | 143.0 (24.0) | 143.3 (25.8) |
| [1.4 (0.2)] | [1.3 (0.2)] | [1.4 (0.2)] | [1.4 (0.3)] | |
| Lp(a), mg/dL, median (Q1:Q3) | 28.0 (8.0:68.5) | 19.0 (6.0:43.0) | 26.0 (8.0:70.0) | 27.5 (10.0:66.5) |
| TG, mg/dL [mmol/L], median (Q1:Q3) | 154.0 (109.0:220.0) | 145.0 (123.0:199.0) | 129.0 (93.0:172.0) | 135.0 (100.5:198.0) |
| [1.7 (1.2:2.5)] | [1.6 (1.4:2.2)] | [1.5 (1.1:1.9)] | [1.5 (1.1:2.2)] | |
| HDL‐C, mg/dL [mmol/L], mean (SD) | 43.6 (11.3) | 42.9 (10.9) | 49.0 (13.9) | 49.1 (14.2) |
| [1.1 (0.3)] | [1.1 (0.3)] | [1.3 (0.4)] | [1.3 (0.4)] | |
| Taking high‐intensity statin therapy, % (n) | 61.5 (91) | 61.0 (47) | 68.9 (228) | 68.9 (113) |
| Any LMT other than statins, % (n) | 6.1 (9) | 2.6 (2) | 6.3 (21) | 6.7 (11) |
| Antidiabetic drug, % (n) | 85.1 (126) | 81.8 (63) | 0 | 0 |
| Insulin, % (n) | 22.3 (33) | 16.9 (13) | 0 | 0 |
Abbreviations: ACS, acute coronary syndrome; Apo, apolipoprotein; ASCVD, atherosclerotic cardiovascular disease; BMI, body mass index; CHD, coronary heart disease; FG, fasting glucose; HbA1c, glycated haemoglobin; HDL‐C, high‐density lipoprotein cholesterol; LDL‐C, low‐density lipoprotein cholesterol; Lp(a), lipoprotein (a); MI, myocardial infarction; PAD, peripheral artery disease; SD, standard deviation; TG, triglyceride.
Includes 2 patients with type 1 DM in alirocumab arm.
Includes acute MI, silent MI, unstable angina, coronary revascularization procedure or other clinically significant CHD.
Risk factors included hypertension; ankle‐brachial index of ≤0.90; microalbuminuria, macroalbuminuria or a urinary dipstick result of >2+ protein; preproliferative or proliferative retinopathy or laser treatment for retinopathy; or a family history of premature CHD.
3.1. Efficacy
At Week 24, LDL‐C levels were reduced from baseline by 49.1% and 51.2% in alirocumab‐treated patients with or without DM, respectively, vs 18.4% and 21.8% in ezetimibe groups, respectively (P = .8052 for treatment by DM interaction; Figure 1A). A similar beneficial effect of alirocumab vs ezetimibe was also evident at the 12‐week assessment in both groups, with or without DM (Figure 1A). Moreover, LDL‐C reductions with alirocumab treatment were maintained over 104 weeks in those with or without DM (Figure 1B).
Figure 1.
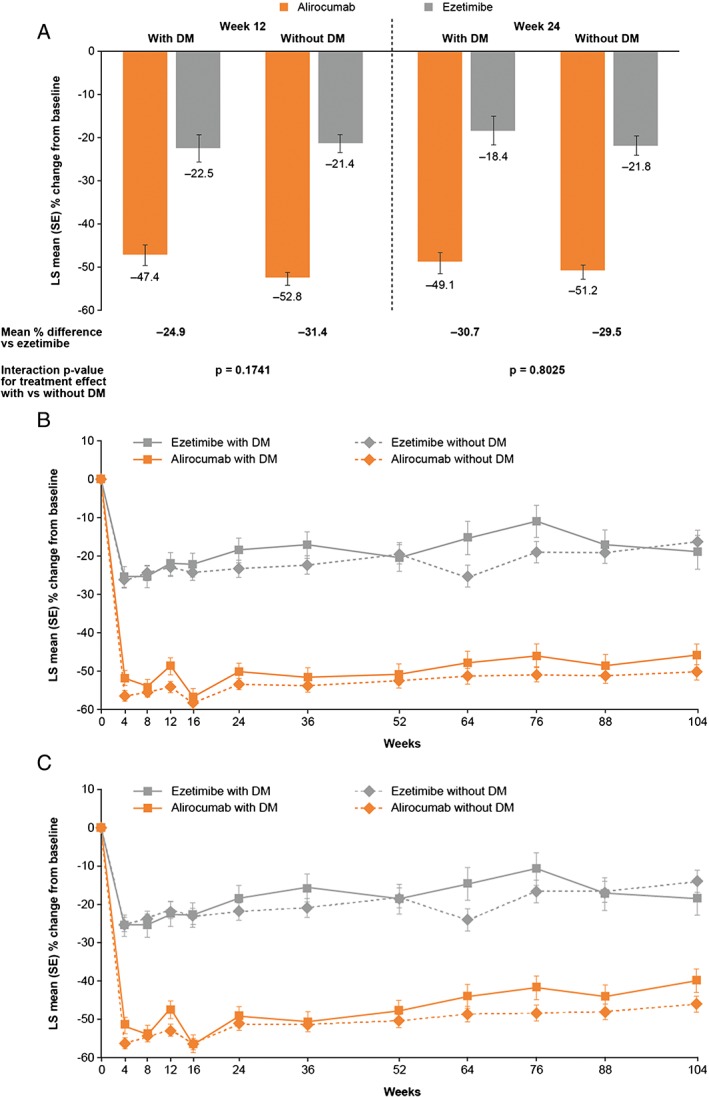
Mean percentage change in calculated low‐density lipoprotein cholesterol (LDL‐C) levels by diabetes mellitus (DM) status. A, LDL‐C subgroup analysis at Weeks 12 and 24 (ITT analysis). B, LDL‐C subgroup analysis over time (on‐treatment analysis)†. C, LDL‐C subgroup analysis over time (ITT). †On‐treatment includes all lipid data throughout the duration of study, collected while the patients were still receiving study treatment. ITT, intent‐to‐treat (includes all lipid data regardless of adherence to treatment); LS, least‐squares; SE, standard error
At Week 12, 80% of patients with DM and 82% of patients without DM were able to achieve LDL‐C levels ≤70 mg/dL (1.8 mmol/L) on alirocumab 75 mg Q2W (ie, without requiring dose increase to 150 mg Q2W). At Week 24, LDL‐C target levels ≤70 mg/dL (1.8 mmol/L) were achieved by 77.9% of alirocumab‐treated patients with DM and 77.3% of those without DM, compared with 50.1% and 45.1%, respectively, of ezetimibe‐treated patients. Treatment with alirocumab was associated with beneficial effects on non‐HDL‐C, Apo B, Lp(a) and HDL‐C levels, and a similar effect with ezetimibe on TG levels at 24 weeks (Figure 2A‐E). All P‐values for interaction, comparing effect of alirocumab vs ezetimibe in patients with or without DM on LDL‐C and other lipid changes, were non‐significant (Figures 1 and 2). Mean percentage changes in non‐HDL‐C, total cholesterol, ApoB, Apo‐A1, Lp(a), TGs and HDL‐C were broadly maintained over 104 weeks for patients with or without DM, in both the ITT and on‐treatment analyses (Figures S2 and S3, respectively).
Figure 2.
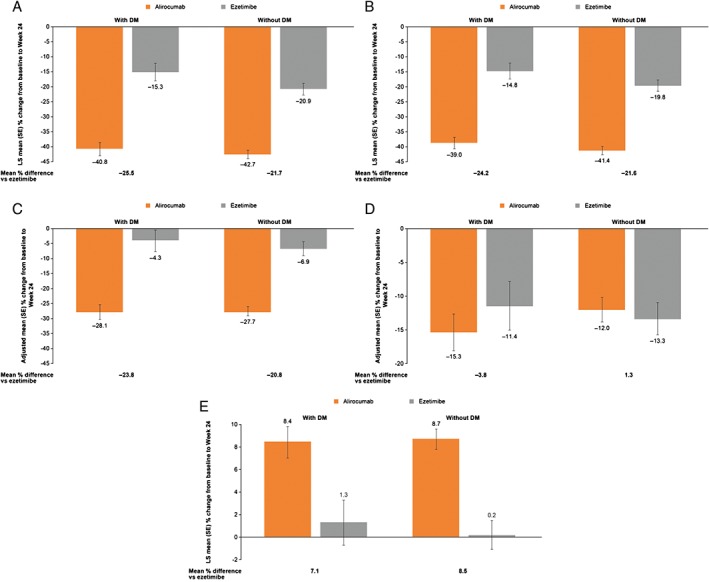
Mean percentage change in non‐high‐density lipoprotein cholesterol (non‐HDL‐C), apolipoprotein (Apo) B, lipoprotein(a) (Lp[a]), triglycerides (TG) and HDL‐C from baseline to Week 24 according to diabetes mellitus (DM) status (ITT analysis). A, Non‐HDL‐C. Interaction P‐value for treatment effect with vs without DM, P = .4004. B, Apo B. Interaction P‐value for treatment effect with vs without DM, P = .5016. C, Lp(a). Interaction P‐value for treatment effect with vs without DM, P = .5593. D, TGs. Interaction P‐value for treatment effect with vs without DM, P = .3432. E, HDL‐C. Interaction P‐value for treatment effect with vs without DM, P = .6232. LS, least squares; SE, standard error
Overall, the mean rate of adherence to treatment (ie, percentage of days that patients received treatment per planned dosing schedule) was high, and was similar in patients with or without DM. Of patients treated with alirocumab, 97.3% with DM and 98.2% without DM were adherent to the SC injection regimen. In the ezetimibe control arm, 100.0% of patients with DM and 98.8% of patients without DM were adherent to placebo injections for alirocumab. Adherence to ezetimbe/placebo capsules was similarly high: in the alirocumab arm, 93.1% of patients with DM and 97.6% of patients without DM received capsules per planned dosing schedule; in the ezetimibe arm, 100.0% of patients with DM and 97.5% of patients without DM were adherent to the planned dosing schedule.
3.2. Safety
Median FG and HbA1c over the 104 weeks of treatment were similar between treatment groups (Figure 3). Overall occurrence of treatment‐emergent AEs (TEAEs) up to 104 weeks was similar between patients, with or without DM, and between treatment groups (Table 2); the percentage of patients who experienced at least 1 TEAE ranged from 80.5% to 82.9%. Deaths were reported for 6 (out of 479; 1.3%) patients in the alirocumab group (2 with and 4 without DM) and 6 patients (out of 241; 2.5%) in the ezetimibe group (1 with and 5 without DM). Serious AEs were experienced by 26.4% and 26.0% of patients with DM and 25.7% and 24.4% of patients without DM, treated with alirocumab and ezetimibe, respectively. TEAEs leading to discontinuation occurred in 10.1% and 9.1% of patients with DM and 8.8% and 7.3% of patients without DM, in the alirocumab and ezetimibe groups, respectively.
Figure 3.
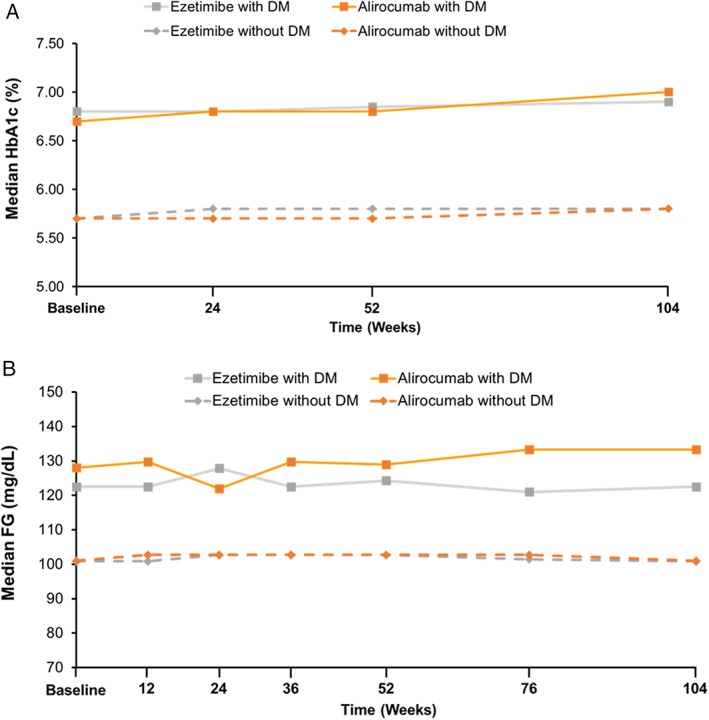
Median glycated hemoglobin (HbA1c) and fasting glucose (FG) over 104 weeks of treatment. A, HbA1c. B, FG
Table 2.
Safety analysis up to 104 weeks
| % (n) of patients | Patients with DM (n = 225) | Patients without DM (n = 495) | ||
|---|---|---|---|---|
| Alirocumab (n = 148) | Ezetimibe (n = 77) | Alirocumab (n = 331) | Ezetimibe (n = 164) | |
| Any TEAE | 81.1 (120) | 80.5 (62) | 81.9 (271) | 82.9 (136) |
| Treatment‐emergent SAE | 26.4 (39) | 26.0 (20) | 25.7 (85) | 24.4 (40) |
| TEAEs leading to permanent discontinuation of study treatment | 10.1 (15) | 9.1 (7) | 8.8 (29) | 7.3 (12) |
| TEAEs leading to death | 1.4 (2) | 1.3 (1) | 1.2 (4) | 3.0 (5) |
| TEAEs occurring in ≥5% of patients | ||||
| Hypertension | 8.1 (12) | 6.5 (5) | 6.3 (21) | 5.5 (9) |
| Upper respiratory tract infection | 6.1 (9) | 9.1 (7) | 10.0 (33) | 6.1 (10) |
| Influenza | 5.4 (8) | 9.1 (7) | 4.2 (14) | 5.5 (9) |
| Non‐cardiac chest pain | 5.4 (8) | 3.9 (3) | 2.4 (8) | 3.0 (5) |
| Dizziness | 4.7 (7) | 5.2 (4) | 6.9 (23) | 8.5 (14) |
| Headache | 4.7 (7) | 6.5 (5) | 6.9 (23) | 4.9 (8) |
| Arthralgia | 4.1 (6) | 5.2 (4) | 5.7 (19) | 3.7 (6) |
| Bronchitis | 4.1 (6) | 9.1 (7) | 3.6 (12) | 3.0 (5) |
| Fall | 4.1 (6) | 5.2 (4) | 2.7 (9) | 0.6 (1) |
| Nasopharyngitis | 3.4 (5) | 6.5 (5) | 5.4 (18) | 6.1 (10) |
| Back pain | 3.4 (5) | 7.8 (6) | 4.5 (15) | 2.4 (4) |
| Osteoarthritis | 2.7 (4) | 6.5 (5) | 2.7 (9) | 1.8 (3) |
| Constipation | 2.7 (4) | 6.5 (5) | 2.4 (8) | 0 |
| Myalgia | 2.0 (3) | 3.9 (3) | 6.6 (22) | 6.1 (10) |
| Cough | 1.4 (2) | 5.2 (4) | 3.6 (12) | 3.7 (6) |
| Sinusitis | 1.4 (2) | 6.5 (5) | 2.1 (7) | 2.4 (4) |
| Anxiety | 1.4 (2) | 5.2 (4) | 1.5 (5) | 1.2 (2) |
| Adjudicated treatment‐emergent cardiovascular events | 8.8 (13) | 2.6 (2) | 5.4 (18) | 6.7 (11) |
| Non‐fatal myocardial infarction | 3.4 (5) | 2.6 (2) | 3.3 (11) | 1.8 (3) |
| Fatal and non‐fatal ischaemic stroke (including stroke not otherwise specified) | 0.7 (1) | 0 | 0.3 (1) | 0.6 (1) |
| Unstable angina requiring hospitalization | 0.7 (1) | 0 | 0 | 0.6 (1) |
| Congestive heart failure requiring hospitalization | 1.4 (2) | 2.6 (2) | 0 | 0 |
| Ischaemia driven coronary revascularization procedure | 5.4 (8) | 1.3 (1) | 3.9 (13) | 3.7 (6) |
| Adjudicated cardiovascular deaths on studya | 1.4 (2) | 0 | 0.9 (3) | 1.2 (2) |
| Any neurocognitive disorders TEAE | 1.4 (2) | 2.6 (2) | 1.2 (4) | 1.8 (3) |
| DM or diabetic complications TEAE | 11.5 (17) | 13.0 (10) | 5.4 (18) | 5.5 (9) |
| Injection‐site reaction (HLT) | 0.7 (1) | 2.6 (2) | 3.6 (12) | 0.6 (1) |
Abbreviations: DM, diabetes mellitus; HLT, high‐level term; SAE, serious adverse event; TEAE, treatment‐emergent adverse event.
Includes all deaths that occurred after initiation of treatment up to the last protocol visit of the patient.
Treatment‐emergent cardiovascular events occurred in 8.8% and 2.6% of patients with DM and 5.4% and 6.7% of patients without DM, in the alirocumab and ezetimibe groups, respectively. There were few neurocognitive events in any group, with events occurring in 2 (1.4%) alirocumab patients and 2 (2.6%) ezetimibe patients with DM, and in 4 (1.2%) alirocumab patients and 3 (1.8%) ezetimibe patients without DM (Table 2). Injection site reactions (Medical Dictionary for Regulatory Activities High‐Level Term) occurred in 1 (0.7%) alirocumab patient and 2 (2.6%) ezetimibe patients with DM and in 12 (3.6%) alirocumab patients and 1 (0.6%) ezetimibe patient without DM, respectively.
4. DISCUSSION
COMBO II was an ezetimibe‐controlled, double‐blind randomized trial that assessed the efficacy and safety of alirocumab vs ezetimibe in high cardiovascular risk patients receiving background maximally tolerated statin over 104 weeks. Approximately one third of patients in the alirocumab (n = 148; 31%) and ezetimibe (n = 77; 32%) groups had DM at baseline. Results from this sub‐analysis indicate that the long‐term efficacy and safety of alirocumab in those with DM is similar to that in those without DM in patients with inadequately controlled LDL‐C. LDL‐C reductions at Week 24 with alirocumab (49.1%‐51.2% from baseline) were significantly greater than those with ezetimibe (18.4%‐21.8% from baseline) in this study. These reductions were consistent in patients with or without DM and were maintained to Week 104. Furthermore, results of this sub‐analysis demonstrate that alirocumab treatment does not affect measures of glycaemia; median FG and HbA1c remained similar in patients with or without DM, and were consistent with those observed in patients receiving ezetimibe. Moreover, in 80% of patients with DM and 82% of those without DM, 75 mg alirocumab Q2W was sufficient to achieve risk‐based LDL‐C targets. Alirocumab was generally well tolerated and the occurrence of AEs was similar regardless of DM status. Injection site reactions occurred more frequently in the alirocumab arm, but did not occur more frequently in those with DM who were treated with alirocumab. In fact, the rate of injection site reactions with alirocumab was lower in those with DM (1 patient, 0.7%) vs those without DM (12 patients, 3.6%), potentially related to the fact that DM patients were more accustomed to receiving injectable therapies (22% of patients in the alirocumab group were receiving insulin) and/or to performing self‐monitoring of blood glucose. This pattern was not seen in the ezetimibe groups; however, the number of ezetimibe‐treated patients who received placebo injections and reported injection‐site reactions was low (3 patients overall).
A possible limitation of this analysis is that, at randomization, patients were stratified according to history of myocardial infarction or ischaemic stroke, intensity of statin treatment and geographic region, to maintain a balance at baseline in factors that might influence outcome, but not DM status.8 Nevertheless, with the DM and non‐DM cohorts, treatment groups were balanced with regard to patient demographics and lipid profile at baseline.
Findings from this subanalysis of the COMBO II study are in agreement with subanalyses from other ODYSSEY studies, showing no differences in efficacy between patients with or without DM.6, 10 Furthermore, a pooled analysis of 10 ODYSSEY trials (including the COMBO II study) did not reveal an increase in new‐onset diabetes or adverse changes in glycaemic parameters with alirocumab treatment.11 A recently published study of the effects of the PCSK9 inhibitor evolocumab in patients with DM also found consistent reductions in atherogenic lipoproteins that were similar in patients with or without DM over the 12 weeks of treatment.12 Our study, which assessed the effect of alirocumab for up to 104 weeks, indicates that the impact of alirocumab on lipid parameters is maintained over the long term in patients with or without DM.
To conclude, in the longest completed randomized double‐blind controlled trial evaluating a PCSK9 inhibitor to date, alirocumab provided clinically relevant greater reductions in LDL‐C in patients with DM than those obtained with ezetimibe, with a similar safety profile. These reductions were maintained over the 104‐week duration of the study and were comparable in patients without DM. In addition, treatment with alirocumab enabled more patients, with or without DM, to achieve LDL‐C goals as compared with ezetimibe, with a 75 mg Q2W alirocumab dose sufficient for the majority of patients to attain their risk‐based LDL‐C goal. Further specific studies of the efficacy and safety of alirocumab in patients with DM are currently ongoing (NCT02642159, NCT02585778) and treatment with alirocumab for potential reduction of cardiovascular events is being evaluated in the large ongoing ODYSSEY OUTCOMES study (NCT01663402) which includes a substantial proportion of patients with DM.13
Supporting information
Figure S1. COMBO II study design.
Figure S2. Mean percentage change in non‐high‐density lipoprotein cholesterol (non‐HDL‐C), total cholesterol, apolipoprotein (Apo) B, Apo‐A1, lipoprotein(a) (Lp[a]), triglyceride (TG), and HDL‐C from baseline at Week 24 according to diabetes mellitus (DM) status (ITT analysis).
Figure S3. Mean percentage change in non‐high‐density lipoprotein cholesterol (non‐HDL‐C), total cholesterol, apolipoprotein (Apo) B, Apo‐A1, lipoprotein(a) (Lp[a]), triglyceride (TG), and HDL‐C from baseline at Week 24 according to diabetes mellitus (DM) status (On‐treatment analysis).†
ACKNOWLEDGEMENTS
The authors would like to thank the study patients and investigators, and the following persons from the sponsors for their contributions to data collection and analysis, assistance with statistical analysis, or critical review of the manuscript: Jay Edelberg, Eva‐Lynne Greene, Michael Howard, Carol Hudson, Veronica Lee, Rita Samuel and Bill Sasiela. Medical writing support was provided by Talya Underwood of Prime Medica Ltd, Knutsford, Cheshire, UK, supported by Sanofi and Regeneron Pharmaceuticals.
Conflict of interest
L. A. L. has served on an advisory panel for Aegerion, Amgen, AstraZeneca, Eli Lilly, Merck, Regeneron and Sanofi; has received research support from Amgen, AstraZeneca, Eli Lilly, Medicine Company, Merck, Pfizer, Regeneron and Sanofi; and has served on speaker's bureaus for Amgen, AstraZeneca, Merck and Sanofi. J. L. Z. has served as a speaker for Abbott, Philips and Merck Sharp & Dohme. M. B.‐B. and G. L. are employees of and stockholders in Sanofi. M. J. L. is an employee of and stockholder in Regeneron. C. P. C. has received personal fees from Sanofi and Regeneron during the conduct of the study; grants from Accumetrics, Arisaph, AstraZeneca, Boehringer‐Ingelheim and Janssen; personal fees from BMS, CSL Behring, Essentialis and Lipimedix; and grants and personal fees from GlaxoSmithKline, Merck and Takeda, outside the submitted work. Y. H. has received research grants, and consultant and speaker honoraria from Amarin, Amgen, AZ, BMS, BI, Eisai, Essperion, Grifolis, GSK Hamni, Intarcia, Janssen, Lexicon, Lilly, Merck, Novo Nordisk, Pfizer, Regeneron, Sanofi, Takeda and Vivus and is Immediate Past President of The American College of Endocrinology.
Leiter LA, Zamorano JL, Bujas‐Bobanovic M, Louie MJ, Lecorps G, Cannon CP and Handelsman Y. Lipid‐lowering efficacy and safety of alirocumab in patients with or without diabetes: A sub‐analysis of ODYSSEY COMBO II, Diabetes Obes Metab, 2017;19:989–996. https://doi.org/10.1111/dom.12909
Funding Information The ODYSSEY COMBO II study was supported by Sanofi and Regeneron Pharmaceuticals. The authors were responsible for all content and editorial decisions and received no honoraria related to the development/presentation of this publication.
REFERENCES
- 1. Verges B. Pathophysiology of diabetic dyslipidaemia: where are we? Diabetologia. 2015;58:886‐899. [DOI] [PMC free article] [PubMed] [Google Scholar]
- 2. Stone NJ, Robinson JG, Lichtenstein AH, et al. 2013 ACC/AHA guideline on the treatment of blood cholesterol to reduce atherosclerotic cardiovascular risk in adults: a report of the American College of Cardiology/American Heart Association Task Force on Practice Guidelines. Circulation. 2014;129(suppl):S1‐S45. [DOI] [PubMed] [Google Scholar]
- 3. Reiner Z, Catapano AL, De Backer G, et al. ESC/EAS guidelines for the management of dyslipidaemias: the Task Force for the management of dyslipidaemias of the European Society of Cardiology (ESC) and the European Atherosclerosis Society (EAS). Eur Heart J. 2011;32:1769‐1818. [DOI] [PubMed] [Google Scholar]
- 4. American Diabetes Association . 8. Cardiovascular disease and risk management. Diabetes Care. 2015;38(suppl):S49‐S57. [DOI] [PubMed] [Google Scholar]
- 5. Bays HE, Jones PH, Brown WV, Jacobson TA, National Lipid Association . National Lipid Association annual summary of clinical lipidology 2015. J Clin Lipidol. 2014;8(suppl):S1‐S36. [DOI] [PubMed] [Google Scholar]
- 6. Robinson JG, Farnier M, Krempf M, et al. Efficacy and safety of alirocumab in reducing lipids and cardiovascular events. N Engl J Med. 2015;372:1489‐1499. [DOI] [PubMed] [Google Scholar]
- 7. Farnier M, Gaudet D, Valcheva V, Minini P, Miller K, Cariou B. Efficacy of alirocumab in high cardiovascular risk populations with or without heterozygous familial hypercholesterolemia: pooled analysis of eight ODYSSEY Phase 3 clinical program trials. Int J Cardiol. 2016;223:750‐757. [DOI] [PubMed] [Google Scholar]
- 8. Cannon CP, Cariou B, Blom D, et al. Efficacy and safety of alirocumab in high cardiovascular risk patients with inadequately controlled hypercholesterolaemia on maximally tolerated doses of statins: the ODYSSEY COMBO II randomized controlled trial. Eur Heart J. 2015;36:1186‐1194. [DOI] [PMC free article] [PubMed] [Google Scholar]
- 9. Colhoun HM, Robinson JG, Farnier M, et al. Efficacy and safety of alirocumab, a fully human PCSK9 monoclonal antibody, in high cardiovascular risk patients with poorly controlled hypercholesterolemia on maximally tolerated doses of statins: rationale and design of the ODYSSEY COMBO I and II trials. BMC Cardiovasc Disord. 2014;14:121. [DOI] [PMC free article] [PubMed] [Google Scholar]
- 10. Kastelein JJ, Ginsberg HN, Langslet G, et al. ODYSSEY FH I and FH II: 78 week results with alirocumab treatment in 735 patients with heterozygous familial hypercholesterolaemia. Eur Heart J. 2015;36:2996‐3003. [DOI] [PMC free article] [PubMed] [Google Scholar]
- 11. Colhoun HM, Ginsberg HN, Robinson JG, et al. No effect of PCSK9 inhibitor alirocumab on the incidence of diabetes in a pooled analysis from 10 ODYSSEY Phase 3 studies. Eur Heart J. 2016;37:2981‐2989. [DOI] [PMC free article] [PubMed] [Google Scholar]
- 12. Sattar N, Preiss D, Robinson JG, et al. Lipid‐lowering efficacy of the PCSK9 inhibitor evolocumab (AMG 145) in patients with type 2 diabetes: a meta‐analysis of individual patient data. Lancet Diabetes Endocrinol. 2016;4:403‐410. [DOI] [PubMed] [Google Scholar]
- 13. Schwartz GG, Bessac L, Berdan LG, et al. Effect of alirocumab, a monoclonal antibody to PCSK9, on long‐term cardiovascular outcomes following acute coronary syndromes: rationale and design of the ODYSSEY outcomes trial. Am Heart J. 2014;168:682‐689. [DOI] [PubMed] [Google Scholar]
Associated Data
This section collects any data citations, data availability statements, or supplementary materials included in this article.
Supplementary Materials
Figure S1. COMBO II study design.
Figure S2. Mean percentage change in non‐high‐density lipoprotein cholesterol (non‐HDL‐C), total cholesterol, apolipoprotein (Apo) B, Apo‐A1, lipoprotein(a) (Lp[a]), triglyceride (TG), and HDL‐C from baseline at Week 24 according to diabetes mellitus (DM) status (ITT analysis).
Figure S3. Mean percentage change in non‐high‐density lipoprotein cholesterol (non‐HDL‐C), total cholesterol, apolipoprotein (Apo) B, Apo‐A1, lipoprotein(a) (Lp[a]), triglyceride (TG), and HDL‐C from baseline at Week 24 according to diabetes mellitus (DM) status (On‐treatment analysis).†