Summary
Proteomic approaches have been proven to provide an important tool in identifying drug resistance‐associated proteins. The aim of this study was to investigate the protein profiling of drug resistance‐related proteins in small‐cell lung cancer (SCLC) by proteomic analysis. The proteomic profiling was performed by two‐dimensional fluorescence difference gel electrophoresis (2D‐DIGE) coupled with MALDI‐TOF‐TOF of SCLC in the multidrug‐resistant cell line H69AR and its parental cell line H69. A total of 11 proteins were identified to be >2‐fold up‐or downregulated between the two cell lines. DJ‐1, one of the differently expressed proteins identified by proteomics, was further examined by immunohistochemistry staining in 116 cases of SCLC tissues. Immunohistochemical results demonstrated that DJ‐1 was expressed in 51.7% (60/116) of SCLC. DJ‐1 expression was correlated significantly with survival time of SCLC patients (P < 0.05), but not with other clinical parameters such as gender, age and clinical stage (P > 0.05). Downregulation of DJ‐1 using DJ‐1‐siRNA in H69AR cells sensitized cancer cells to chemotherapeutic drugs through increasing drug‐induced cell apoptosis accompanied with G0‐G1 phase arrest. These findings suggest DJ‐1 may serve as a potential biomarker for chemoresistance and prognostic factor for patients with SCLC.
Keywords: chemoresistance, DJ‐1, proteomics, small‐cell lung cancer
Lung cancer is currently the leading cause of cancer deaths around the world. Small‐cell lung cancer (SCLC) accounts for approximately 15% of all lung cancer cases, which also represents the most aggressive subset of lung cancer (Govindan et al. 2006). Systemic chemotherapy is the bedrock of treatment for different stages of the disease. Although SCLC patients respond well to chemotherapy, relapse is virtually inevitable and resultant tumours are resistant to further therapy (Kurup & Hanna 2004). Therefore, chemoresistance has become not only the greatest obstacle in treatment of SCLC, but also a key issue in improving the prognosis of SCLC.
DJ‐1 is a member of the eponymous DJ‐1 superfamily which has homologues distributed across all biological kingdoms (Wilson 2011). DJ‐1 was originally cloned as a mitogen‐dependent oncogene and plays a role in a Ras‐related signal pathway. DJ‐1 enhances the transforming activity more predominantly in cooperation with Ras than by itself in mouse NIH3T3 cells (Nagakubo et al. 1997). Mutations of the DJ‐1 gene can also lead to autosomal‐recessive hereditary Parkinson's disease. In an increasing number of studies DJ‐1 has been shown to be upregulated in many human cancer types, including in non‐small‐cell lung cancer, breast cancer, prostate cancer, endometrial cancer and ovarian cancer (MacKeigan et al. 2003; Bindukumar et al. 2008; Davidson et al. 2008; Tsuchiya et al. 2012; Shu et al. 2013). Meanwhile, increasing evidence has suggested that DJ‐1 has an effect on tumour initiation, progression and metastasis by regulating the growth, survival and chemoresistance of cancer cells (Cao et al. 2015). All of these findings indicate that DJ‐1 is a potential biomarker for cancer diagnosis and therapy.
Recent reports have shown that DJ‐1 is involved in many biological functions, such as transcriptional regulation, chaperone activity regulation, protease function regulation and mitochondrial regulation (Raninga et al. 2014). Moreover, DJ‐1 is implicated in apoptotic and cellular defence pathways which are critical in determining drug sensitivity. Studies show that overexpression of DJ‐1 can increase the resistance of cancer cells to the induction of apoptosis by anti‐cancer drugs including pancreatic cancer (Chen et al. 2012), NSCLC (Zeng et al. 2011), leukaemia (Liu et al. 2008). As above, accumulating evidence has shown that DJ‐1 might be one of the chemoresistance‐related genes. To investigate this we performed a proteomic analysis and found DJ‐1 to be differently expressed when we compared the SCLC multidrug‐resistant cell line H69AR and its parental cell line H69. Therefore, we propose that DJ‐1 may be involved in the molecular mechanisms of multidrug resistance in SCLC.
To further explore the biological function of DJ‐1 in SCLC, we detected the expression of DJ‐1 in SCLC tissues and evaluated the association of DJ‐1 expression with clinical prognosis of SCLC patients. We then further investigated its role on multidrug resistance by the cellular model of human SCLC‐resistant cell line H69AR. We suggest that DJ‐1 may play a critical role in multidrug resistance of SCLC and serve as an independent poor prognosticator in SCLC patients. Overall, our study may shed light on the association between DJ‐1 and multidrug resistance in SCLC.
Materials and methods
Cell lines and cell culture
Human SCLC cell line NCI‐H69 and the drug‐resistant subline NCI‐H69AR were purchased from the American Type Culture Collection (ATCC, USA) and maintained in RPMI 1640 medium containing L‐glutamine with 10% and 20% foetal calf serum, respectively, in an incubator at 37°C with 5% CO2. The drug‐resistant variant H69AR was alternately treated with drug‐free medium and medium containing 5 μg/ml of adriamycin (ADM) and tested regularly for maintained resistance to the selected drugs by CCK‐8 assay.
Ethical approval statement
Under the protocol approved by the Institutional Review Board, informed consent was obtained from the patients or their guardians. The Ethical Committee of Guangdong Women and Children Hospital approved the tissue collection and studies with collected tumor tissues.
Two‐dimensional fluorescence difference gel electrophoresis (2D‐DIGE)
The SCLC proteins from the cell lines H69AR and H69 were used for further analysis by 2D‐DIGE. The pH of the protein samples was adjusted to 8.5 and the protein concentration was adjusted to 5 μg/μl. Equal amounts of protein from each sample were pooled together as the internal standard. The proteins were minimally labelled according to the manufacturer's instructions (CyDye DIGE fluor minimal labelling kit, GE Healthcare). The Cy2 was used to label the 50 μg pooled internal standard, Cy3 to label proteins from H69 and Cy5 to label proteins from H69AR, and then, the samples were mixed. For each gel, an equal volume of rehydration buffer (8 M urea, 4% CHAPS, 2% DTT and 2% IPG buffer pH 3–10) was added. The pooled protein samples were subjected to isoelectric focusing (IEF) carried out by the Ettan IPGphor Isoelectric Focusing System (GE Amersham) and the nonlinear IPG strips (pH 3–10, 13 cm, GE Healthcare). The IPG strips were rehydrated for 12 h in 250 μl of rehydration buffer containing the protein samples. IEF was performed in four steps: 30 V for 12 h, 500 V for 1 h, 1000 V for 1 h and 8000 V for 8 h. Then, the gel strips were equilibrated under gentle shaking for 15 min in equilibration buffer [50 mM Tris–HCl (pH 8.8), 6 M urea, 2% SDS, 30% glycerol and 1% DTT]. The above step was repeated using the same buffer with 4% iodoacetamide in place of 1% DTT. The strips were then subjected to the two‐dimensional electrophoresis after transfer onto 12.5% SDS‐polyacrylamide gels. The second‐dimensional gels were cast between low fluorescent Pyrex glass plates (GE Healthcare) to minimize background fluorescence during scanning. Electrophoresis was performed using the Hoefer SE 600 system (GE Amersham) at 15 mA per gel for 30 min, followed by 30 mA per gel until the bromophenol blue reached the end of the gel.
The gels were scanned using a Typhoon FLA 9000 biomolecular imager (GE Healthcare). Excitation and emission wavelengths for Cy2, Cy3 and Cy5 were 488/520, 532/580 and 633/670 nm respectively. Gels were scanned at 100 μm resolution and the photomultiplier tube voltage was set to values ranging between 500 and 700 V to ensure maxima pixel intensity between 50,000 and 80,000 pixels for the three dyes. The 2D DeCyder software (Differential In‐Gel Analysis and Biological Variance Analysis software module; GE) was used for spot identification, background elimination, point matching and differential protein spots. The biological variation analysis module was used for intergel matching of the internal standard, and all the gel samples were subjected to comparative cross‐gel statistical analysis based on spot volumes with a t‐test. P value < 0.05 was considered statistically significant.
Western blot analysis
Equivalent amounts of protein were electrophoresed on 12% SDS‐PAGE and transferred to PVDF (polyvinylidene difluoride) membrane (Millipore). The membrane was incubated with a rabbit polyclonal antibody against human DJ‐1 (Abcam) at 1:500 overnight at 4°C. GAPDH (1:1000, Santa Cruz biotechnology) was used as a protein loading control. Then, the membrane was incubated with horseradish peroxidase‐labelled secondary antibody for 1 h at room temperature. The protein bands were detected by chemiluminescence (ECL).
RNA isolation, reverse transcription and qRT‐PCR
Total RNA was isolated from cancer cells lines using TRIzol reagent (Invitrogen). To measure the mRNA levels of DJ‐1, total RNA was reversely transcribed using prime Script RT reagent Kit (TIANGEN, Beijing, China). Reverse transcription reactions were processed for 15 min at 42°C, followed by 3 min at 95°C for complementary DNA (cDNA) synthesis. Quantitative real‐time PCR was performed in an ABI illumina instrument using the SYBR Green (TIANGEN Biotechnology Co, Ltd.) under the following conditions: 15 min at 95°C for 1 cycle, 10 s at 95°C, 30 s at 60°C for 40 cycles, 95°C for 15 s, 55°C for 45 s and 95°C for 15 s for melting curve analysis. Primers (Shanghai Sangon Biotech Co Ltd.) were designed based on sequences from the GenBank as follows: DJ‐1 F: 5′ TGGCTAAAGGAGCAGAGGAA 3′; R: ‘TGACCACATCACGGCT ‐ACAC3′; glyceraldehyde 3‐phosphate dehydrogenase (GAPDH) was used as an endogenous control: forward primer: 5‐AGCCTCAAGATC ‐ATCAGC‐3; reverse primer: 5‐GAGTCCTTCCACGATACC‐3. The relative mRNA expression levels of DJ‐1 were calculated using the comparative expression level 2−∆∆Ct method.
Transfection
Cells were transiently transfected with small interfering RNA (siRNA) specific to DJ‐1 and non‐target siRNA negative control (NC). siRNAs designed by GenePharma (Shanghai, China) were as follows: si‐DJ‐1‐394 (sense 5‐GGGCGCACAGAAUUUAUCUTT‐3 and antisense 5‐AGAU‐AAACACCAGAUCCUCTT‐3); si‐DJ‐1‐483 (sense 5‐CAGGUCCUACUGCUCUGUUTT‐3 and antisense 5‐AACAGAGCAGUAGGACCU‐GTT‐3); and si‐DJ‐1‐612 (sense 5‐GCCUGAUUCUUACAAGCCGTT‐3 and antisense 5‐CGGCUUGUAAGAAUCAGGCTT‐3) and non‐target siRNA (sense 5‐UUCUCCGAACGUGUCACGUTT‐3 and antisense 5‐ACGUGACACGUUCGGA GAATT‐3) which is a nonsense sequence and has no homologous genomes compared with humans, mouse and rat; catalogue number: A06001. Typically, cells were seeded in six‐well plates and transfected with siRNA or negative control siRNA by Lipofectamine 2000 and Opti‐MEM (Invitrogen) when cells grew to reach 60–70% confluence. Then, the mixture of Lipofectamine™ 2000, siRNA and Opti‐MEM medium was incubated for 30 min at room temperature before it was added into each well. After 4–6 h, the medium was replaced; 24–48 h later, cells were collected and used for cell CCK‐8 assay, real‐time qPCR and Western blotting analyses.
Cell counting kit‐8 (CCK‐8) assay
Cell proliferation and drug resistance were both assayed by the Cell Counting Kit‐8 (CCK‐8) assay. For cell proliferation assay, transient transfection cells were seeded in 96‐well plates about 5 × 10³ cells per well. According to the manufacturer's protocol, cell proliferation was tested every 24 h. For cell drug resistance assay, cells were seeded in 96‐well plates at 5 × 10³ cells per well. After transient transfection cells and treated it with drugs for 24 h, then the cells were treated in medium with three chemotherapy drugs [cisplatin (DDP; Shandong, China), etoposide (VP‐16; Jiangsu, China) and adriamycin (ADM; Jiangsu, China)] respectively. The absorbance at 450 was measured after incubation with 10 μl CCK‐8 reagent (Beyotime Institute of Biotechnology, Shanghai, China) for 4 h. The cells incubated without drugs were set at 100% survival and were used to calculate the concentration of each chemotherapeutic drug IC50. The assay was conducted in six replicate wells for each sample and three parallel experiments were performed.
Flow cytometric analysis
Cells were treated with drugs for 24 h after transfection and then collected for apoptosis and cell cycle assay. Cell apoptosis assay was performed using Annexin V/propidium iodide detection kit (Keygene, Nanjing, China). For cell cycle assay, the cells were collected and fixed in 70% ethanol at 4°C for 16 h and then stained with propidium iodide.
Immunohistochemistry staining
Formalin‐fixed, paraffin‐embedded tissues of 116 SCLC clinical patient samples were sectioned at 4 mm thickness. Before adding the primary antibody, antigen was retrieved by heating sections 0.01 M citrate buffer (pH 6.0) in a microwave oven for 10 min followed by 10 min of cooling. Then, sections were incubated with the same antibody against human DJ‐1 used in Western blot analysis (1:200, Abcam) at 4°C overnight. Visualization was achieved using the EnVision peroxidase system (Dako). Five fields of a sample were randomly selected according to semiquantitative scales by two independent experienced pathologists, and only tumour cells were scored. Firstly, the percentage of tumour cells with DJ‐1 immunoexpression for each specimen was classified into four groups of various scores from 0 to 3 (<10%, 0;>10%, 1;>25%, 2; and >50%, 3). The intensity of staining was scored manually (high, 3; medium, 2; low, 1; and no staining, 0). Negative controls were performed by replacing the primary antibodies stated above with PBS. A final IHC score was calculated by adding up the two scores above. A score >3 was designated as high expression and a score ≤3 was regarded as low expression. Positively stained DJ‐1 was mainly located in the cytoplasm of SCLC cells and appeared as brown particles.
Statistical analysis
All experiments were run in triplicate. Data are represented as mean ± SD. All the statistical analyses were carried out with spss version 16.0 software. Possible differences between groups were analysed using Student's t‐test or one‐way analysis of variance (anova). Survival curves were obtained by Kaplan–Meier method. Prognostic factors were examined by univariate and multivariate analyses (Cox proportional hazards model). A P value < 0.05 was considered statistically significant.
Results
DJ‐1 expression is upregulated in H69AR as compared with H69 Cells
To identify the differential protein expression profiles between drug‐resistant cell line H69AR and its parental cell line H69, we initiated a proteomic analysis using high‐resolution two‐dimensional gel electrophoresis. All protein spots between two cell lines were measured by computer‐assisted spot detection. Each fluorescence signal in fluorescent dye‐stained gels represents a protein spot intensity (Figure 1a). A total of 35 protein spots with more than 2‐fold intensity changes between two cell lines were successfully identified, reflecting increased or decreased amount of protein expression. We selected 25 increased protein spots in H69AR cells for protein identification by MALDI‐TOF‐TOF and 11 differently expressed proteins were identified between the two cell lines (Table 1). Of 25 protein spots with differential expression profiles, we identified spot 1157 as DJ‐1 and further validated the results by qRT‐PCR and Western blot (Figure 1b,c). Figure 2 shows that DJ‐1 expression increased in H69AR cells than in H69 cells at both mRNA and protein levels.
Figure 1.
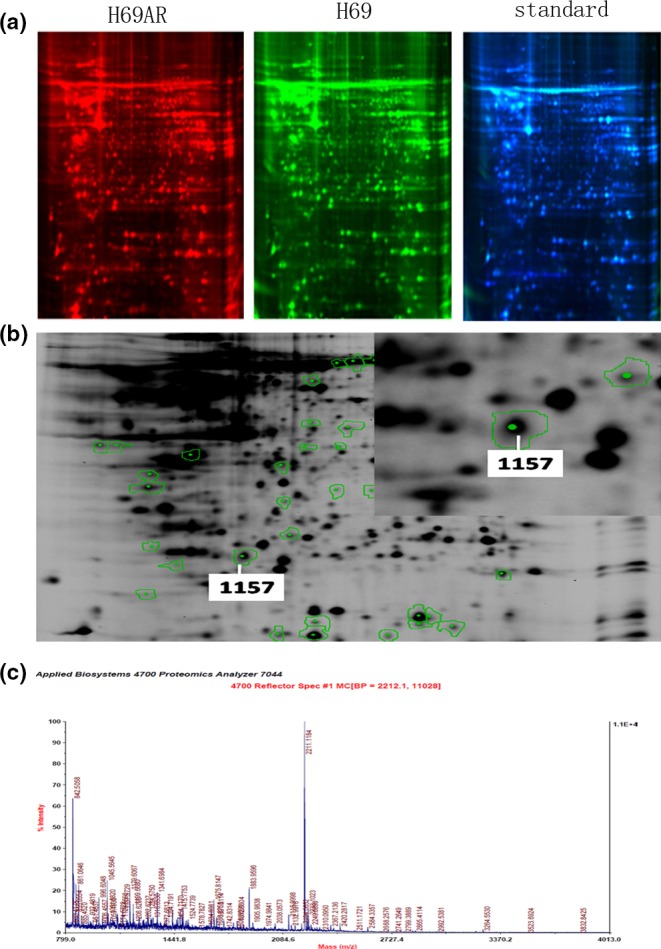
Identification of differently expressed proteins between H69 and H69AR SCLC cells by proteomic analysis. The two‐dimensional fluorescence difference gel electrophoresis results display H69AR cellular protein colour for red fluorescent spots, H69 for green fluorescent spots and standard for blue fluorescent spots (a). H69AR cells and H69 cell protein differential expression profile. The different protein spots were marked by the analysis software (b). Peptide mass fingerprinting of DJ‐1(c).
Table 1.
Higher expressed proteins in H69AR cells in proteomic analysis
| No | Accession no. | Spot IDa | Protein name | Folda | M.W(KD) | Protein score | Protein score CI % | Total ion score | Total ion CI % | Pep.count species |
|---|---|---|---|---|---|---|---|---|---|---|
| 1 | IPI00220327 | 1547 | Cytoskeletal 1 | 11 | 62KD | 200 | 100 | 140 | 100 | 12 |
| 2 | IPI00925196 | 491 | IMPDH2 | 3 | 62KD | 165 | 100 | 121 | 100 | 10 |
| 3 | IPI00025512 | 1084 | HSPB1 | 7 | 22KD | 309 | 100 | 259 | 100 | 7 |
| 4 | IPI00298547 | 1157 | DJ‐1 | 11 | 20KD | 170 | 100 | 153 | 100 | 3 |
| 5 | IPI00019359 | 754 | Cytoskeletal 9 | 11 | 62KD | 205 | 100 | 162 | 100 | 10 |
| 6 | IPI00024705 | 805 | GIPC‐1 | 10 | 36KD | 185 | 100 | 123 | 100 | 10 |
| 7 | IPI00027463 | 1580 | S100A6 | 3 | 10KD | 74 | 99.6 | 54 | 99.852 | 3 |
| 8 | gi|119574932 | 186 | Vinculin | 3 | 116KD | 510 | 100 | 233 | 100 | 39 |
| 9 | IPI00012011 | 1276 | Cofilin‐1 | 11 | 18KD | 554 | 100 | 462 | 100 | 10 |
| 11 | IPI00021700 | 939 | PCNA | 10 | 36KD | 384 | 100 | 293 | 11 | |
| 12 | IPI00419585 | 1326 | PPIA | 10 | 18KD | 148 | 100 | 104 | 100 | 6 |
H69AR vs. H69.
The spot ID was determined at the beginning of the analysis of the gel.
Protein database version information: IpI.HUMAN.v3.53,download in 2010_6.
Figure 2.
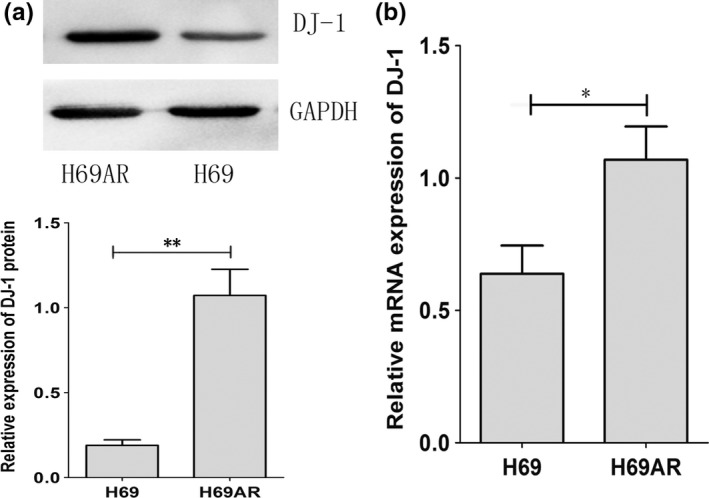
The expression of DJ‐1 in SCLC cell lines. The differential expression of DJ‐1 was assessed in H69AR and H69 by Western blot and qRT‐PCR (a and b). *P < 0.05,**P < 0.001 compared with control.
DJ‐1 expression is associated with cell proliferation and chemoresistance in SCLC
We further investigated the effect of DJ‐1 on SCLC proliferation and chemoresistance by RNA interference (RNAi). Three siRNAs (DJ‐1‐siRNA‐394, DJ‐1‐siRNA‐483, DJ‐1‐siRNA‐612) targeting DJ‐1 were designed and validated by qRT‐PCR and Western blot. The results showed that DJ‐1‐siRNA‐394 had a stronger suppressive effect at both mRNA and protein levels (Figure 3a,b). We thus chose to use siRNA‐394 in the subsequent studies. As shown in Figure 3c, the viability of H69AR cells transfected with si‐DJ‐1 significantly decreased compared with that of control cells. The survival and the IC 50 values of DJ‐1‐siRNAs transfected cells significantly decreased after treated with chemotherapeutic drugs including ADM, DDP or VP‐16 (Figure 3d and Table 2). These results indicated that downregulation of DJ‐1 can reverse the resistance of drug‐resistant cells to anti‐cancer agents.
Figure 3.
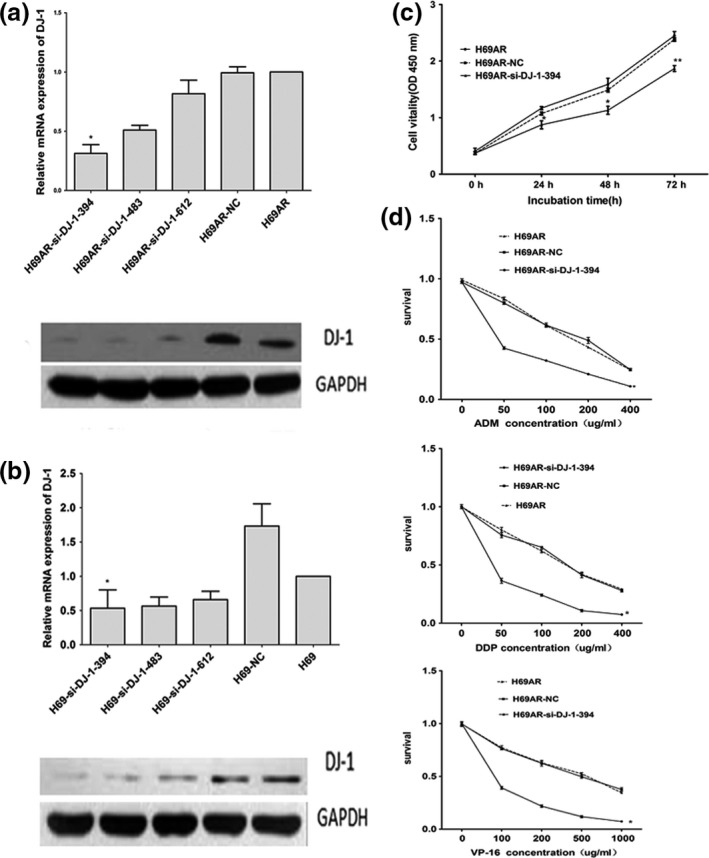
Downregulation of DJ‐1 expression in H69AR cells reduced its survival after treated with different chemotherapeutic drugs. (a,b) The expression of DJ‐1 was detected in H69AR and H69 cells transfected with si‐DJ‐1 (siRNA) or a scrambled negative control (NC) by qRT‐PCR and Western blot. (c) Effect of DJ‐1 on cell proliferation in H69AR‐NC and H69AR‐si‐DJ‐1‐394 cells under no treatment conditions. (d) The survival of cells to chemotherapy drugs (ADM, DDP and VP‐16) was measured after H69AR cells transfected with DJ‐1‐394 or mock by CCK‐8 assay. Values are presented as percentage of cell survival in drug‐treated cells and untreated cells. *P < 0.05,**P < 0.001 compared with control.
Table 2.
Drug sensitivity of H69AR cells after downregulation of DJ‐1
| Reagents | IC50 (ug/ml) | Resistance index | ||
|---|---|---|---|---|
| H69AR‐DJ‐1‐siRNA‐394 | H69AR | Mock | ||
| ADM | 38.01 | 156.52 | 152.50 | 0.24 |
| DDP | 43.14 | 158.56 | 154.26 | 0.27 |
| VP‐16 | 62.93 | 165.75 | 174.49 | 0.37 |
Downregulation of DJ‐1 affects drug‐induced apoptosis of SCLC cells
To further explore the possible mechanisms of DJ‐1 in chemoresistance, we evaluated the impact of DJ‐1 on apoptosis and cell cycle control when treated with chemotherapeutic drugs. By flow cytometry analysis, we found that downregulation of DJ‐1 in H69AR cells resulted in increased cell drug‐induced apoptosis (Figure 4) and increased both G0 and G1 cell cycle arrests (Figure 5).
Figure 4.
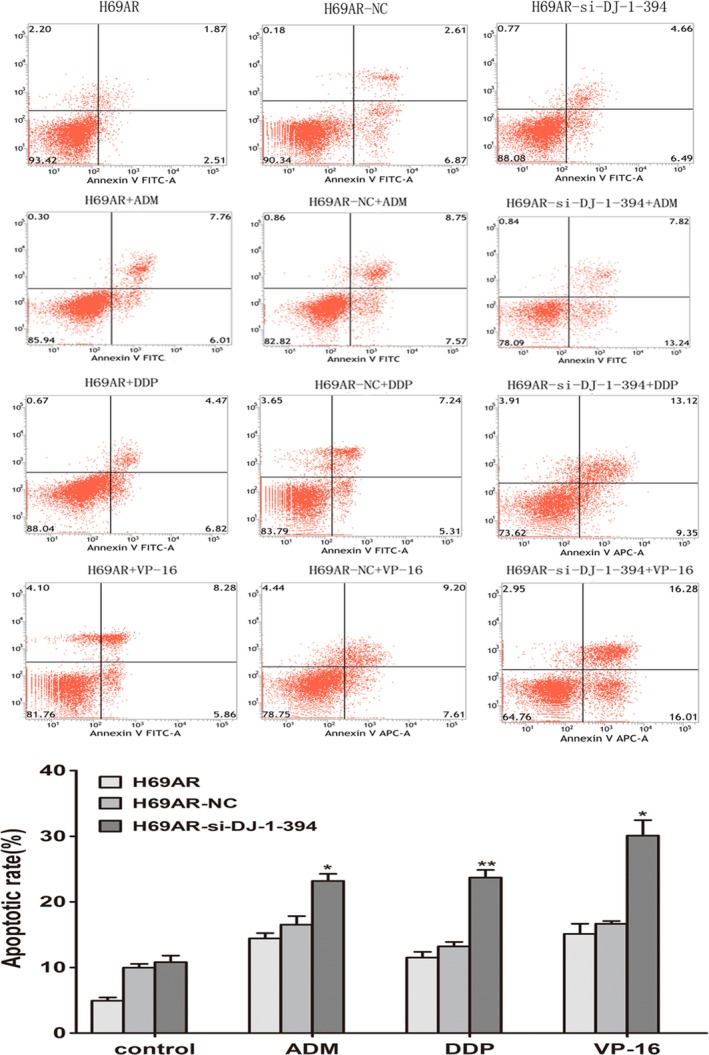
Role of DJ‐1 in cell apoptosis of SCLC cells. Knockdown DJ‐1 expression of H69AR cells increased cell apoptosis after treated with different concentrations of ADM, DDP or VP‐16. *P < 0.05, **P < 0.001.
Figure 5.
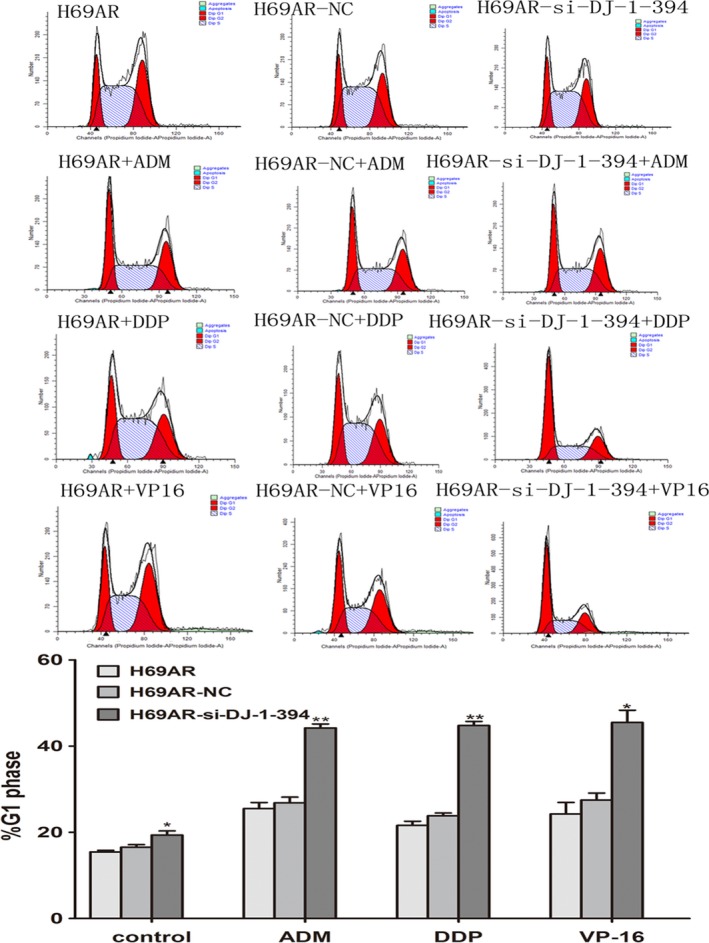
Role of DJ‐1 in cell cycle of SCLC cells. Knockdown DJ‐1 expression of H69AR cells increased cell cycle arrest. H69AR cells were transfected with siRNA and then were treated with ADM, DDP and VP‐16. *P < 0.05,**P < 0.001.
DJ‐1 expression in human SCLC is correlated with poor prognosis
We further investigated the clinical features of DJ‐1 in SCLC. Immunohistochemistry staining was performed to examine the expression levels of DJ‐1 in 116 samples from SCLC patients (Figure 6a). Positively stained DJ‐1 was mainly located in the cytoplasm of SCLC cells and appeared as brown particles (Figure 6b,c). The positive rate of DJ‐1 expression was 51.7% (60/116) in SCLC. The relationship between DJ‐1 expression and clinical characteristics in SCLC patients is summarized in Table 3. By multivariate analysis, the DJ‐1 expression was correlated with survival (P < 0.05), but not with other clinical parameters such as gender, age and clinical stage (P > 0.05). Kaplan–Meier survival analysis showed that DJ‐1 with high expression significantly indicates a poor prognosis (Figure 6d). Multivariate analysis, using Cox proportional hazards model, revealed that DJ‐1 expression and survival could be independent prognostic factors for the SCLC patients.
Figure 6.
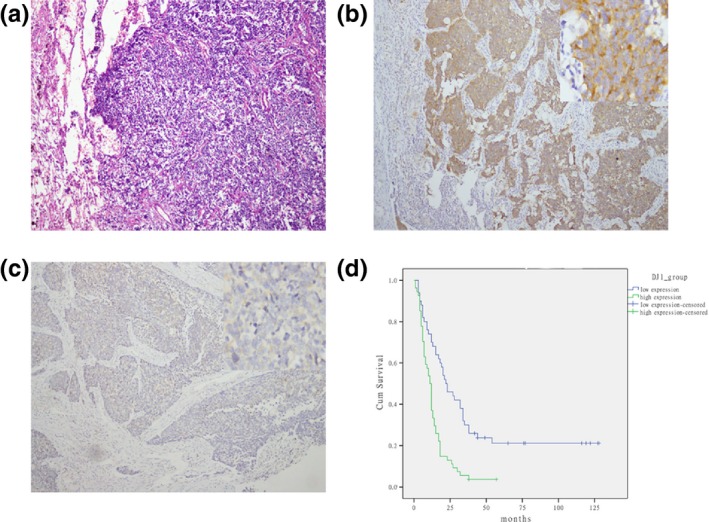
Expression of DJ‐1 in SCLC samples and the survival rates of SCLC patients. (a) HE staining of SCLC samples (magnification, ×100). (b,c) Representative images of immunostaining of DJ‐1 in small‐cell lung cancer tissues with DJ‐1‐high expression (b) and DJ‐1‐low expression (c) (magnification, ×50–400). (d) Kaplan–Meier analysis of correlation between DJ‐1 expression and the survival time of patients with SCLC (P < 0.001).
Table 3.
Association of DJ‐1 expression with clinicopathological characteristics in 116 SCLC patients
| Characteristics | Total (n = 116) | DJ‐1 expression | |||
|---|---|---|---|---|---|
| Low expression | High expression | χ2 | P valuea | ||
| Gender | 0.176 | 0.674 | |||
| Male | 101 | 48 | 53 | ||
| Female | 15 | 8 | 7 | ||
| Age (years) | 0.138 | 0.710 | |||
| <60 year | 58 | 27 | 31 | ||
| ≥60 year | 58 | 29 | 29 | ||
| Pathologic stage | 0.084 | 0.771 | |||
| LD | 72 | 34 | 38 | ||
| ED | 44 | 22 | 22 | ||
| Specimen type | 0.085 | 0.770 | |||
| Operation | 43 | 20 | 23 | ||
| Biopsy | 73 | 36 | 37 | ||
| Chemotherapy | 0.302 | 0.583 | |||
| Received | 21 | 9 | 12 | ||
| Unreceived | 95 | 47 | 48 | ||
| Metastasis | 0.024 | 0.877 | |||
| Absent | 106 | 50 | 56 | ||
| Present | 8 | 4 | 4 | ||
| Status | 7.946 | 0.005 | |||
| Survival | 13 | 11 | 2 | ||
| Death | 91 | 39 | 52 | ||
For analysis of correlation between of DJ‐1 expression levels and clinical features, Fisher's exact test was used. Results were considered statistically significant at P < 0 .05.
Discussion
For all patients with SCLC, etoposide and cisplatin (EP) is the most commonly used initial combination chemotherapy regimen. Multidrug resistance (MDR) has been the most important cause for failure of SCLC chemotherapy. It is therefore urgently required to develop novel targeting specific molecules involved in drug resistance. Proteomics is the most powerful approach for the study of complex biological systems, which has made large‐scale proteome analysis combined with rapid protein identification technologies (Yu et al. 2015). Recently, studies have showed that proteomics techniques could be used to identify proteins which may be involved in the drug resistant of cancer (Li et al. 2010; Gong et al. 2011; Zeng et al. 2011). Therefore, proteomics may also provide a new insight to study the mechanisms of multidrug resistance (MDR) in SCLC.
In this study, we identified differential protein expression using cellular models of SCLC which were widely used as sensitive (NCI‐H69) and resistant cell lines (NCI‐H69AR) to chemotherapy by proteomics. In total, 11 proteins were identified to be >twofold up‐or downregulated between two cell lines. For this study, we focused on DJ‐1 which has been implicated to be involved in several signalling pathways including cell apoptotic and cellular defence. We present the first evidence that DJ‐1 expression is associated with chemoresistance in SCLC. DJ‐1 was confirmed to be overexpressed at mRNA and protein levels by qRT‐PCR and Western blot analyses. Drug sensitivity assays showed that cells transfected with DJ‐1‐siRNA‐394 became more sensitive to chemotherapeutic drugs including ADM, DDP or VP‐16 compared with the control cells respectively. Our results with DJ‐1 in chemoresistance are consistent with the report in non‐small‐cell lung cancer (NSCLC) and pancreatic cancer (Zeng et al. 2011; Chen et al. 2012). To further investigate the possible mechanism of DJ‐1 in SCLC chemoresistance, we evaluated the effect of DJ‐1 on apoptosis and cell cycle control by flow cytometry. Our data indicated that one reason for the resistant phenotype in H69/H69AR cells may be that downregulation of DJ‐1 in H69AR cells resulted in increased drug‐induced apoptosis and increased both G0 and G1 cell cycle arrests. Therefore, our research may provide a novel mechanism of chemoresistance mediated by DJ‐1 in SCLC.
DJ‐1 as an oncogene has been shown to play a pivotal role in initiation, progression, metastasis and chemoresistance of tumour (Cao et al. 2015). Overexpression of DJ‐1 in breast cancer has been observed, and it can promote breast cancer cell invasion, as well as affect the occurrence and development of breast cancer (Le Naour et al. 2001; Tsuchiya et al. 2012; Ismail et al. 2014). Previous studies showed that higher DJ‐1 levels were correlated with the recurrence and metastasis in lung cancer (Kim et al. 2005; Bai et al. 2012). DJ‐1 is also associated with endometriotic cell migration and invasion (Rai & Shivaji 2011). Moreover, DJ‐1 as a protein deglycase which involved in oxidative stress resistance repairs proteins from glycation by glyoxal and methylglyoxal (Advedissian et al. 2016). Reports suggested that DJ‐1‐mediated antioxidative defence is activated after chemotherapy in advanced‐stage ovarian cancer, which may indicate its role in chemoresistance (Pylvas‐Eerola et al. 2016). And Junn E et al. have shown that overexpression of DJ‐1 through inhibiting apoptotic pathways increases the chemoresistance of cancer cells (Junn et al. 2005). However, to our knowledge, the clinical features of DJ‐1 expression in SCLC have not been reported. In the current study, we analysed the expression of DJ‐1 in 116 cases of SCLC tissues by immunohistochemistry technique. Our results showed that DJ‐1 was overexpressed in 51.7% (60/116) of cancer cells. DJ‐1 expression was correlated significantly with survival time of SCLC patients. Our findings suggest DJ‐1 may be a novel independent prognostic factor for SCLC patients.
In conclusion, we first identified DJ‐1 by proteomic approach and validated DJ‐1 is closely associated with chemoresistance in SCLC. Furthermore, our data showed that DJ‐1 was overexpressed in cancer cells and high expression of DJ‐1 was associated with shorter survival time in SCLC patients. These findings suggest DJ‐1 may serve as a potential biomarker for chemoresistance and prognostic factor for patients with SCLC.
Conflict of interest
Authors do not have any conflict of interests to report.
Funding source
This work was supported by the National Natural Science Foundation of China (81172241).
The first two authors contributed equally to this work.
References
- Advedissian T., Deshayes F., Poirier F., Viguier M. & Richarme G. (2016) The Parkinsonism‐associated protein DJ‐1/Park7 prevents glycation damage in human keratinocyte. Biochem. Biophys. Res. Commun. 473, 87–91. [DOI] [PubMed] [Google Scholar]
- Bai J., Guo C., Sun W. et al (2012) DJ‐1 may contribute to metastasis of non‐small cell lung cancer. Mol. Biol. Rep. 39, 2697–2703. [DOI] [PubMed] [Google Scholar]
- Bindukumar B., Schwartz S., Aalinkeel R., Mahajan S., Lieberman A. & Chadha K. (2008) Proteomic profiling of the effect of prostate‐specific antigen on prostate cancer cells. Prostate 68, 1531–1545. [DOI] [PubMed] [Google Scholar]
- Cao J., Lou S., Ying M. & Yang B. (2015) DJ‐1 as a human oncogene and potential therapeutic target. Biochem. Pharmacol. 93, 241–250. [DOI] [PubMed] [Google Scholar]
- Chen Y., Kang M., Lu W. et al (2012) DJ‐1, a novel biomarker and a selected target gene for overcoming chemoresistance in pancreatic cancer. J. Cancer Res. Clin. Oncol. 138, 1463–1474. [DOI] [PubMed] [Google Scholar]
- Davidson B., Hadar R., Schlossberg A. et al (2008) Expression and clinical role of DJ‐1, a negative regulator of PTEN, in ovarian carcinoma. Hum. Pathol. 39, 87–95. [DOI] [PubMed] [Google Scholar]
- Gong F., Peng X., Zeng Z., Yu M., Zhao Y. & Tong A. (2011) Proteomic analysis of cisplatin resistance in human ovarian cancer using 2‐DE method. Mol. Cell. Biochem. 348, 141–147. [DOI] [PubMed] [Google Scholar]
- Govindan R., Page N., Morgensztern D. et al (2006) Changing epidemiology of small‐cell lung cancer in the United States over the last 30 years: analysis of the surveillance, epidemiologic, and end results database. J. Clin. Oncol. 24, 4539–4544. [DOI] [PubMed] [Google Scholar]
- Ismail I.A., Kang H.S., Lee H.J., Kim J.K. & Hong S.H. (2014) DJ‐1 upregulates breast cancer cell invasion by repressing KLF17 expression. Br. J. Cancer 110, 1298–1306. [DOI] [PMC free article] [PubMed] [Google Scholar]
- Junn E., Taniguchi H., Jeong B.S., Zhao X., Ichijo H. & Mouradian M.M. (2005) Interaction of DJ‐1 with Daxx inhibits apoptosis signal‐regulating kinase 1 activity and cell death. Proc. Natl. Acad. Sci. USA 102, 9691–9696. [DOI] [PMC free article] [PubMed] [Google Scholar]
- Kim R.H., Peters M., Jang Y. et al (2005) DJ‐1, a novel regulator of the tumor suppressor PTEN. Cancer Cell 7, 263–273. [DOI] [PubMed] [Google Scholar]
- Kurup A. & Hanna N.H. (2004) Treatment of small cell lung cancer. Crit. Rev. Oncol. Hematol. 52, 117–126. [DOI] [PubMed] [Google Scholar]
- Le Naour F., Misek D.E., Krause M.C. et al (2001) Proteomics‐based identification of RS/DJ‐1 as a novel circulating tumor antigen in breast cancer. Clin. Cancer Res. 7, 3328–3335. [PubMed] [Google Scholar]
- Li S.L., Ye F., Cai W.J. et al (2010) Quantitative proteome analysis of multidrug resistance in human ovarian cancer cell line. J. Cell. Biochem. 109, 625–633. [DOI] [PubMed] [Google Scholar]
- Liu H., Wang M., Li M. et al (2008) Expression and role of DJ‐1 in leukemia. Biochem. Biophys. Res. Commun. 375, 477–483. [DOI] [PubMed] [Google Scholar]
- MacKeigan J.P., Clements C.M., Lich J.D., Pope R.M., Hod Y. & Ting J.P. (2003) Proteomic profiling drug‐induced apoptosis in non‐small cell lung carcinoma: identification of RS/DJ‐1 and RhoGDIalpha. Cancer Res. 63, 6928–6934. [PubMed] [Google Scholar]
- Nagakubo D., Taira T., Kitaura H. et al (1997) DJ‐1, a novel oncogene which transforms mouse NIH3T3 cells in cooperation with ras. Biochem. Biophys. Res. Commun. 231, 509–513. [DOI] [PubMed] [Google Scholar]
- Pylvas‐Eerola M., Liakka A., Puistola U., Koivunen J. & Karihtala P. (2016) Cancer stem cell properties as factors predictive of chemoresistance in neoadjuvantly‐treated patients with ovarian cancer. Anticancer Res. 36, 3425–3431. [PubMed] [Google Scholar]
- Rai P. & Shivaji S. (2011) The role of DJ‐1 in the pathogenesis of endometriosis. PLoS One 6, e18074. [DOI] [PMC free article] [PubMed] [Google Scholar]
- Raninga P.V., Trapani G.D. & Tonissen K.F. (2014) Cross talk between two antioxidant systems, thioredoxin and DJ‐1: consequences for cancer. Oncoscience 1, 95–110. [DOI] [PMC free article] [PubMed] [Google Scholar]
- Shu K., Xiao Z., Long S. et al (2013) Expression of DJ‐1 in endometrial cancer: close correlation with clinicopathological features and apoptosis. Int. J. Gynecol. Cancer 23, 1029–1035. [DOI] [PubMed] [Google Scholar]
- Tsuchiya B., Iwaya K., Kohno N. et al (2012) Clinical significance of DJ‐1 as a secretory molecule: retrospective study of DJ‐1 expression at mRNA and protein levels in ductal carcinoma of the breast. Histopathology 61, 69–77. [DOI] [PubMed] [Google Scholar]
- Wilson M.A. (2011) The role of cysteine oxidation in DJ‐1 function and dysfunction. Antioxid. Redox Signal. 15, 111–122. [DOI] [PMC free article] [PubMed] [Google Scholar]
- Yu G.J., Yin Y.L., Yu W.H. et al (2015) Proteome exploration to provide a resource for the investigation of Ganoderma lucidum . PLoS One 10, e119439. [DOI] [PMC free article] [PubMed] [Google Scholar]
- Zeng H.Z., Qu Y.Q., Zhang W.J., Xiu B., Deng A.M. & Liang A.B. (2011) Proteomic analysis identified DJ‐1 as a cisplatin resistant marker in non‐small cell lung cancer. Int. J. Mol. Sci. 12, 3489–3499. [DOI] [PMC free article] [PubMed] [Google Scholar]


