Abstract
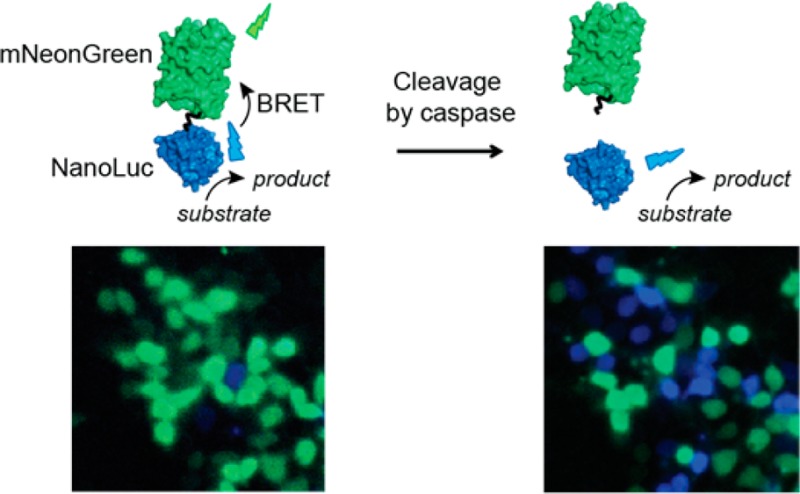
FRET-based caspase activity probes have become important tools to monitor apoptotic cell signaling. However, their dependence on external illumination is incompatible with light sensitive cells and hampers applications that suffer from autofluorescence and light scattering. Here we report the development of three caspase sensor proteins based on Bioluminescence Resonance Energy Transfer (BRET) that retain the advantages of genetically encoded, ratiometric optical probes but do not require external illumination. These sensors consist of the bright and stable luciferase NanoLuc and the fluorescent protein mNeonGreen, fused together via a linker containing a recognition site for caspase-3, -8, or -9. In vitro characterization showed that each caspase sensor displayed a robust 10-fold decrease in BRET ratio upon linker cleavage, with modest caspase specificity. Importantly, whereas scattering and background fluorescence precluded FRET-based detection of intracellular caspase activity in plate-reader assays, such measurements could be easily performed using our caspase BRET sensors in a high throughput format. The brightness of the BRET sensors also enabled long-term single-cell imaging, allowing BRET-based recording of cell heterogeneity in caspase activity in a heterogenic cell population.
Keywords: caspase sensor, BRET, NanoLuc, mNeonGreen, plate reader assay, single-cell imaging
Proteases play important roles in cell signaling regulation in normal and diseased states and are attractive targets for protease inhibitor mediated therapy.1 Caspases belong to the cysteine dependent class of proteases and are key regulators of apoptosis, a critical process in developmental biology and essential for tissue homeostasis.2 Caspases are also involved in inflammation, refinement of mature neuronal networks, proliferation, and differentiation.3−5 Apoptosis is tightly regulated by a cascade of caspases that are inert proenzymes before proteolytic activation.6 Caspases are activated via an extrinsic pathway, involving initiator caspase-8, and an intrinsic pathway, initiated by initiator caspase-9, which both lead to downstream activation of the caspase-3 and other subsequent executioner caspases.7 Dysregulation of apoptosis causes aberrant activation (or lack of activation) of these pathways and is associated with cancer, autoimmune diseases, and neurological and cardiovascular disorders.8
Many apoptosis assays focus on the detection of late events in apoptosis, such as externalization of phosphatidylserine, chromatin condensation, and DNA fragmentation.9 Caspase activation represents an early apoptosis marker and its detection typically relies on application of fluorescent peptide-based substrates. These assays are based on the release of a fluorophore reporter group upon caspase cleavage, the separation of a fluorescent group conjugated via a peptide linker to a quencher, or genetically encoded probes.10 The first two methods are usually limited to in vitro detection in cell lysates. Genetically encoded caspase sensor proteins allow monitoring caspase activity on a single-cell level in real time. Most of these sensors are based on Förster resonance energy transfer (FRET) between a fluorescent donor protein and an acceptor protein linked via a caspase-cleavable linker.11−20 The ratiometric response of FRET-sensor proteins renders them relatively insensitive to variations in sensor concentration, while their genetic encoding is attractive for live cell imaging and allows excellent control of subcellular localization. Single-cell imaging with genetically encoded FRET sensors revealed large cell-to-cell variability in the time point of caspase activation following treatment with apoptosis inducing agents. However, once the signaling threshold is reached, the cell dies within 10 min.21 Although FRET is highly useful in single-cell microscopy experiments, fluorescence is incompatible with light sensitive cells and optogenetic applications. Moreover, the requirement of an excitation light source introduces problems such as autofluorescence and light scattering, which can severely hamper applications in strongly absorbing or scattering media, such as plate-based assays and in vivo imaging.
Sensors based on bioluminescence resonance energy transfer (BRET) have recently received increasing attention as a viable alternative to FRET-based biosensing.22−24 In these sensors, the donor fluorescent domain is replaced by a luciferase enzyme, which generates light by catalyzing the oxidation of specific organic substrate molecules. Also, several examples of intensiometric bioluminescent assays to detect caspase activity have been reported, including the use of caspase-activatable luciferin variants,25 mechanically strained circular luciferases,26 or cyclic luciferases, whereby activity is restored upon cleavage by caspase-3.27 BRET-based detection of caspase activity has been reported using Renilla,28,29 firefly,30 and click-beetle green luciferases22 conjugated to YFP or GFP, the fluorescent dye AF680, and the red fluorescent protein tdTomato, respectively. Of these systems, BRET sensors based on Renilla luciferase and its variants have been most commonly used, both for caspase-3 and other proteases such as thrombin.29,31−34 While these studies already showed some of the benefits of BRET-based detection, these sensors still showed limited brightness and used relatively instable substrates, hampering their application in cell-based assays and precluding single-cell imaging experiments.
In this work we report the development of a family of bright BRET-based caspase sensors based on the recently developed luciferase NanoLuc (NLuc). NLuc is a small and highly stable luciferase that generates a bright and glow-type blue luminescence that is 100 times more intense than the luminescent signal produced by Renilla or firefly luciferases.35 Not surprisingly, NLuc is rapidly becoming the luciferase of choice for numerous applications, including as donor luciferase in BRET-based assays.23,36−39 To ensure efficient BRET in the absence of caspase activity, we fused NLuc via a caspase-cleavable 17 amino acid flexible linker to the fluorescent acceptor protein mNeonGreen (mNG)39,40 (Figure 1a). The high extinction coefficient and quantum yield of mNG and the strong overlap between the excitation spectrum of mNG and the emission spectrum of the NLuc substrate (furimazine) contribute to efficient energy transfer and thus bright acceptor emission in the noncleaved state.39 A 17-amino-acid linker containing a tetrapeptide caspase recognition site was chosen to allow easy access by the target caspases, while at the same time keeping the domains in close proximity for efficient BRET. Three sensors were developed (C3-, C8-, and C9-BRET), targeting initiator caspase-8 (Ile-Glu-Thr-Asp) involved in the extrinsic pathway, initiator caspase-9 (Leu-Glu-His-Asp) from the intrinsic pathway and the downstream executioner caspase-3 (Asp-Glu-Val-Asp).
Figure 1.
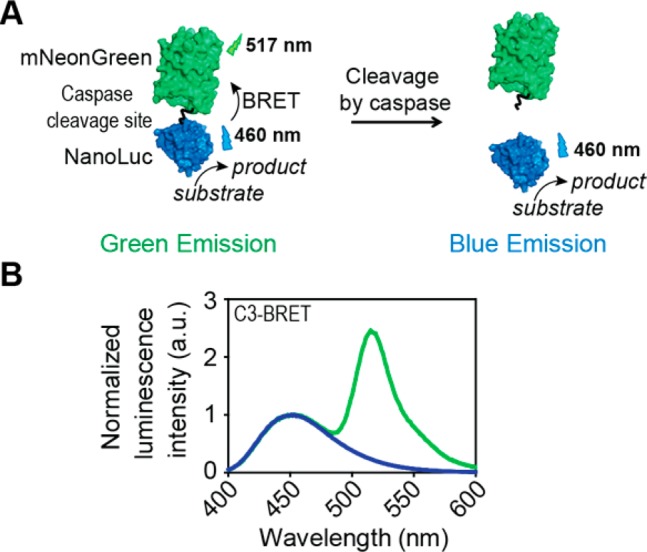
(A) Schematic representation of the BRET-based caspase sensor mechanism. (B) Luminescence emission spectra of C3-BRET (10 nM) in the absence (green trace) and presence of 10 μM caspase-3 (blue trace). All measurements were performed in buffer containing 20 mM Na2HPO4, 150 mM NaCl, 1 mM EDTA, 2 mM TCEP, and 1 mg/mL bovine serum albumin at pH = 7.1.
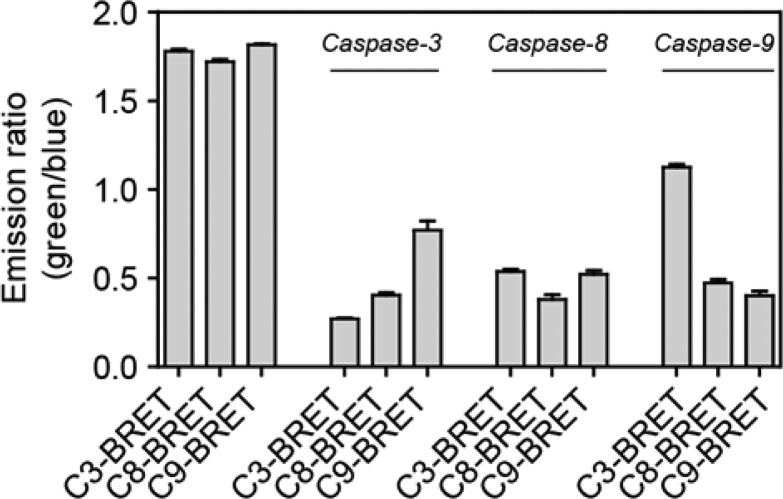
To allow thorough in vitro characterization of the functionality of the newly developed sensor, the sensor proteins were first expressed in Escherichia coli and purified by Ni-NTA affinity chromatography. Luminescence emission spectra showed efficient BRET for all three sensors, with the intensity of the 517 nm acceptor peak being 2-fold higher than that of the 460 nm NLuc peak (Figure 1b, Figure S-1, green spectra). In all cases, incubation with the target caspases resulted in complete disappearance of the mNG emission peak (Figure 1b, blue spectra), representing a robust 10-fold change in acceptor/donor emission ratio. SDS-PAGE analysis confirmed that the decrease in BRET efficiency was due to specific cleavage of the linker between NLuc and mNG, and not a result of unspecific degradation of mNG (Figure S-2). While the response of the BRET sensors is caspase specific, the sequences targeting different caspases are similar and previous studies have shown only moderate subtype selectivity.41,42Figure 2 shows the response of the three BRET sensors in the absence of caspase and after 5 min incubation with each of the caspases 3, 8, and 9 (Figure S-3, 60 min.). While each caspase cleaves its target sensor most efficiently, selectivity is indeed limited. The caspase-3 recognition site seems to be the most selective. Caspase-8 shows similar activity toward all three sensors, while caspase-9 cleaves C8-BRET and C9-BRET with similar efficiency, but is less reactive toward C3-BRET. In these plate-reader based assays, a 6–7-fold change in emission ratio was observed for all three sensors. Using 1 μM of the C3-BRET sensor and 60 min of incubation, a limit of detection of 12.5 pM caspase 3 was determined (Figure S-4).
Figure 2.
Emission ratio of the caspase sensors C3-, C8-, C9-BRET (1 μM) after 5 min incubation in the absence of caspase (left 3 bars) and in the presence of caspase-3, -8, or -9 protein (1 μM). All measurements were conducted in buffer containing 20 mM Na2HPO4, 150 mM NaCl, 1 mM EDTA, 2 mM TCEP, 1 mg/mL bovine serum albumin, and 1 M sodium acetate to aid caspase dimerization, at pH = 7.1. Error bars represent the standard deviation (n = 3).
An important advantage of bioluminescence is that BRET measurements are easily performed on a population of cells using a standard plate reader, whereas detection of FRET sensors typically suffers from a high background due to autofluorescence and light scattering.31,38 We therefore compared the performance of the C3-BRET sensor with SCAT3, a previously developed FRET sensor for caspase-3 developed by Takemoto et al.12 To investigate the performances of both caspase sensors in living cells, HeLa cells were seeded in transparent 96-well plates and transiently transfected with plasmid encoding SCAT3 or C3-BRET. Caspase activity was induced 48 h after transfection by the addition of protein kinase inhibitor staurosporine (STS), a well-known apoptosis inducer.43 Emission spectra of HeLa cells transfected with SCAT3 showed a broad peak around 470 nm (Figure 3a). This peak is present in both transfected and nontransfected cells; however, addition of STS does not change the observed fluorescence spectrum, despite the fact that fluorescence microscopy images showed successful transformation and expression of SCAT3 in these HeLa cells (Figure S-5). The similar spectra observed for transfected and nontransfected cells therefore suggest that the signal is dominated by background fluorescence and scattering, making the FRET-sensor signal nondiscernable. This background is not caused by the medium, as replacing medium by imaging buffer showed very similar spectra (Figure S-6). In contrast, HeLa cells expressing the C3-BRET sensor showed bioluminescent emission spectra that are very similar to the spectra of the purified sensor (Figure 3b). Moreover, 5 h incubation with STS results in complete disappearance of the mNG peak at 517 nm, consistent with complete sensor cleavage. As expected, nontransfected cells showed essentially no background luminescence, clearly demonstrating the advantage of bioluminescent over fluorescent detection for plate-based caspase activity assays.
Figure 3.
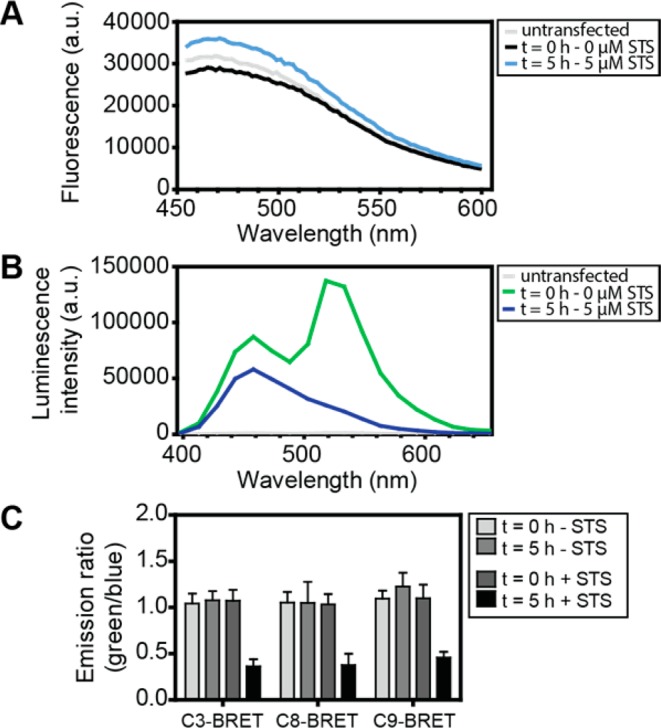
Caspase activity measured in HeLa cells. (A) Emission spectra of nontransfected HeLa cells (light gray) and HeLa cells expressing the caspase-3 FRET sensor SCAT3 at 0 h (black) and 5 h (light blue) after addition of 5 μM STS, using an excitation wavelength of 410 nm. (B) Emission spectra of nontransfected HeLa cells (light gray) and HeLa cells expressing C3-BRET at 0 h (green) and 5 h (blue) after addition of 5 μM STS; emission spectra were measured using 40 filters covering the complete spectrum. (C) Absolute emission ratios of HeLa cells expressing C3-, C8-, and C9-BRET at t = 0 and t = 5 h, in the absence and presence of 5 μM STS. Blue emission was recorded between 445 and 470 nm and green emission between 505 and 530 nm. Error bars represent the standard deviation of 8 different wells.
The performance of the BRET sensors to monitor caspase activity in HeLa cells was further examined by recording emission ratios of HeLa cells expressing each of the three sensors in the absence and presence of STS (Figure 3c, Figure S-7). Emission ratios were very similar for each sensor and remained constant over a period of 5 h in the absence of STS. Addition of STS induced a clear decrease in emission ratio after 5 h, consistent with complete sensor cleavage in the measured time frame. HeLa cells expressing control sensors in which the essential aspartic acid in the recognition motif was mutated to an alanine showed emission ratios that were slightly higher compared to the caspase-activatable sensors, possibly attributable to decreased background cleavage (Figure S-8). The emission ratios for these cells remained high even 5 h after incubation with STS, despite the fact that the cells did show clear apoptotic morphological changes. Together, these results show that the caspase BRET sensors provide reproducible, robust, and specific in situ detection of caspase activity.
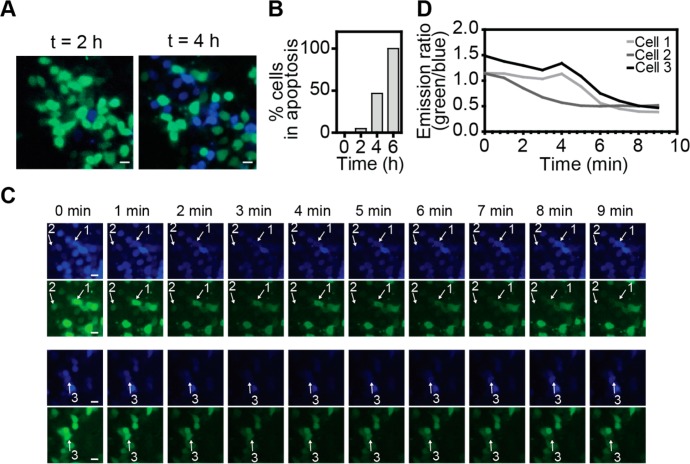
Previous work using FRET-based sensors revealed that there is substantial heterogeneity between cells in the onset of caspase-3 activation following treatment with STS.12,13,44 Having established the robust performance of C3-BRET to monitor intracellular caspase activation on a population of cells in a plate reader, we next tested whether its bright luminescence also allows bioluminescent imaging of single cells. HeLa cells expressing C3-BRET were treated with STS and subsequently imaged for 6 h using a bioluminescence microscope. Fresh substrate was added at regular time intervals and luminescence was imaged between 420 and 460 nm for NLuc and between 510 and 550 nm for mNG. Figure 4a shows pictures of the same cells imaged 2 and 4 h after STS addition in which the green and blue channels are superimposed. The robust change in emission ratio allows one to easily distinguish cells before and after caspase activation by simply merging the channels (Figure 4a). At 2 h, the vast majority of cells are still green, and only a few blue cells are observed that have undergone caspase-3 activation. After 4 h nearly half of the cells showed the low (<0.8) emission ratio characteristic of caspase-3 activity, while after 6 h 100% of the cells exhibited caspase activity (Figure 4b). Figure 4c displays the absolute emission intensities of 10 consecutive 1 min images of cells 4 h after STS treatment. Please note that there is a gradual decrease in emission intensities in both the blue and the green channels during these 10 min because the concentration of luciferase substrate decreases over time. However, by monitoring the ratio of the blue and the green emission, three cells can be distinguished that undergo caspase-3 activation within this time frame. In each case caspase-3 activity increased rapidly, showing complete cleavage of C3-BRET within 2–3 min, which is consistent with previous work using FRET-based single-cell imaging (Figure 4c,d).12 These results demonstrate that BRET-based imaging provides a feasible alternative for FRET-based imaging for monitoring caspase activation on a single-cell level for prolonged periods of time.
Figure 4.
Live single-cell imaging of caspase-3 activity in HeLa cells. (A) Merged images of HeLa cells transfected with C3-BRET sensor, 48 h after transfection. At the initiation of the experiment caspase activity was induced by the addition of staurosporine (STS, 5 μM) and images were recorded after 2 (left) and 4 h (right) (Scale bar = 20 μm). (B) Percentage of HeLa cells showing caspase activity (emission ratio <0.8) over time. (C) Bioluminescent images showing cleavage of single cells in two channels, Nluc emission (420–460 nm) and mNeonGreen (510–550 nm) emission, 4 h after STS addition. Scale bar = 20 μm. (D) Bioluminescent emission ratio traces of three cells labeled in (C) showing caspase-3 activation. Measurements were done at 37 °C and 5% CO2 in Dulbecco’s modified Eagle’s Medium, supplemented with 10% fetal bovine serum, under humidifying conditions.
In conclusion, bright bioluminescent caspase sensors were developed that allow robust in situ detection of caspase-3, -8, or -9 activity. The ratiometric and stable bioluminescent signal offered by these sensors proved to be advantageous for high throughput caspase activity assays and allowed long-term imaging of caspase activity in single cells. While FRET-based imaging remains the method of choice for high resolution imaging of a single cell in terms of sensitivity and spatial resolution, BRET-based imaging provides an attractive alternative for experiments involving light-sensitive cells and optogenetic applications. BRET-based caspase sensors are also attractive for in vivo imaging. For these latter applications it may be beneficial to develop red-shifted sensor variants, e.g., by using the recently developed NanoLanterns-NLuc variants as a red-shifted donor luciferase in combination with a red fluorescent acceptor proteins.34,37,45 Although the absolute intensity of bioluminescence changes over time, the emission ratio was shown to remain very stable over prolonged periods of time, responding only to caspase-induced cleavage. These sensors thus provide attractive tools for high-throughput cell-based drug screening to monitor caspase-mediated apoptosis, and can also be adopted, after replacement of the protease recognition sequence, to other protease-related cell signaling processes.
Acknowledgments
We would like to thank Stijn Aper and Tom de Greef for insightful discussions. We gratefully thank Guy Salvesen for the caspase-8 protein (Addgene plasmid #11827)46 and Masayuki Miura for SCAT-3.12 This work was supported by an ERC starting grant (ERC-2011-StG280255) and by The Netherlands Organisation for Scientific Research (NWO) via Gravity Program 024.001.035 and VICI grant 016.150.366.
Supporting Information Available
The Supporting Information is available free of charge on the ACS Publications website at DOI: 10.1021/acssensors.7b00239.
Materials and methods and supporting figures (PDF)
The authors declare no competing financial interest.
Supplementary Material
References
- Turk B. Targeting proteases: successes, failures and future prospects. Nat. Rev. Drug Discovery 2006, 5, 785–799. 10.1038/nrd2092. [DOI] [PubMed] [Google Scholar]
- Elmore S. Apoptosis: a review of programmed cell death. Toxicol. Pathol. 2007, 35, 495–516. 10.1080/01926230701320337. [DOI] [PMC free article] [PubMed] [Google Scholar]
- Parrish A. B.; Freel C. D.; Kornbluth S. Activation and Function. Cold Spring Harbor Perspect. Biol. 2013, 5, a008672. 10.1101/cshperspect.a008672. [DOI] [PMC free article] [PubMed] [Google Scholar]
- Yi C. H.; Yuan J. The Jekyll and Hyde functions of caspases. Dev. Cell 2009, 16, 21–34. 10.1016/j.devcel.2008.12.012. [DOI] [PMC free article] [PubMed] [Google Scholar]
- Hyman B. T.; Yuan J. Apoptotic and non-apoptotic roles of caspases in neuronal physiology and pathophysiology. Nat. Rev. Neurosci. 2012, 13, 395–406. 10.1038/nrn3228. [DOI] [PubMed] [Google Scholar]
- Hengartner M. O. The biochemistry of apoptosis. Nature 2000, 407, 770–776. 10.1038/35037710. [DOI] [PubMed] [Google Scholar]
- Riedl S. J.; Shi Y. Molecular mechanisms of caspase regulation during apoptosis. Nat. Rev. Mol. Cell Biol. 2004, 5, 897–907. 10.1038/nrm1496. [DOI] [PubMed] [Google Scholar]
- Mcilwain D. R.; Berger T.; Mak T. W. Caspase functions in cell death and disease. Cold Spring Harbor Perspect. Biol. 2013, 5, a008656. 10.1101/cshperspect.a008656. [DOI] [PMC free article] [PubMed] [Google Scholar]
- Häcker G. The morphology of apoptosis. Cell Tissue Res. 2000, 301, 5–17. 10.1007/s004410000193. [DOI] [PubMed] [Google Scholar]
- Poreba M.; Strózyk A.; Salvesen G. S.; Drag M. Caspase substrates and inhibitors. Cold Spring Harbor Perspect. Biol. 2013, 5, a008680. 10.1101/cshperspect.a008680. [DOI] [PMC free article] [PubMed] [Google Scholar]
- Mahajan N. P.; Harrison-Shostak D. C.; Michaux J.; Herman B. Novel mutant green fluorescent protein protease substrates reveal the activation of specific caspases during apoptosis. Chem. Biol. 1999, 6, 401–409. 10.1016/S1074-5521(99)80051-9. [DOI] [PubMed] [Google Scholar]
- Takemoto K.; Nagai T.; Miyawaki A.; Miura M. Spatio-temporal activation of caspase revealed by indicator that is insensitive to environmental effects. J. Cell Biol. 2003, 160, 235–243. 10.1083/jcb.200207111. [DOI] [PMC free article] [PubMed] [Google Scholar]
- Rehm M.; Düßmann H.; Jänicke R. U.; Tavaré J. M.; Kögel D.; Prehn J. H. M. Single-cell fluorescence resonance energy transfer analysis demonstrates that caspase activation during apoptosis is a rapid process: Role of caspase-3. J. Biol. Chem. 2002, 277, 24506–24514. 10.1074/jbc.M110789200. [DOI] [PubMed] [Google Scholar]
- Luo K. Q.; Yu V. C.; Pu Y.; Chang D. C. Application of the fluorescence resonance energy transfer method for studying the dynamics of caspase-3 activation during UV-induced apoptosis in living HeLa cells. Biochem. Biophys. Res. Commun. 2001, 283, 1054–1060. 10.1006/bbrc.2001.4896. [DOI] [PubMed] [Google Scholar]
- Tyas L.; Brophy V. A.; Pope A.; Rivett A. J.; Tavaré J. M. Rapid caspase-3 activation during apoptosis revealed using fluorescence-resonance energy transfer. EMBO Rep. 2000, 1, 266–270. 10.1093/embo-reports/kvd050. [DOI] [PMC free article] [PubMed] [Google Scholar]
- Zlobovskaya O. A.; Sergeeva T. F.; Shirmanova M. V.; Dudenkova V. V.; Sharonov G. V.; Zagaynova E. V.; Lukyanov K. A. Genetically encoded far-red fluorescent sensors for caspase-3 activity. BioTechniques 2016, 60, 62–68. 10.2144/000114377. [DOI] [PubMed] [Google Scholar]
- Kominami K.; Nagai T.; Sawasaki T.; Tsujimura Y.; Yashima K.; Sunaga Y.; Tsuchimochi M.; Nishimura J.; Chiba K.; Nakabayashi J.; Koyamada K.; Endo Y.; Yokota H.; Miyawaki A.; Manabe N.; Sakamaki K. In vivo imaging of hierarchical spatiotemporal activation of caspase-8 during apoptosis. PLoS One 2012, 7, e50218. 10.1371/journal.pone.0050218. [DOI] [PMC free article] [PubMed] [Google Scholar]
- Bardet P.-L.; Kolahgar G.; Mynett A.; Miguel-Aliaga I.; Briscoe J.; Meier P.; Vincent J.-P. A fluorescent reporter of caspase activity for live imaging. Proc. Natl. Acad. Sci. U. S. A. 2008, 105, 13901–13905. 10.1073/pnas.0806983105. [DOI] [PMC free article] [PubMed] [Google Scholar]
- Shcherbo D.; Souslova E. a; Goedhart J.; Chepurnykh T. V.; Gaintzeva A.; Shemiakina I. I.; Gadella T. W. J.; Lukyanov S.; Chudakov D. M. Practical and reliable FRET/FLIM pair of fluorescent proteins. BMC Biotechnol. 2009, 9, 24.This. 10.1186/1472-6750-9-24. [DOI] [PMC free article] [PubMed] [Google Scholar]
- Nagai T.; Miyawaki A. A high-throughput method for development of FRET-based indicators for proteolysis. Biochem. Biophys. Res. Commun. 2004, 319, 72–77. 10.1016/j.bbrc.2004.04.147. [DOI] [PubMed] [Google Scholar]
- Green D. R. Apoptotic pathways: Ten minutes to dead. Cell 2005, 121, 671–674. 10.1016/j.cell.2005.05.019. [DOI] [PubMed] [Google Scholar]
- Gammon S. T.; Villalobos V. M.; Roshal M.; Samrakandi M.; Piwnica-Worms D. Rational design of novel red-shifted BRET pairs: Platforms for real-time single-chain protease biosensors. Biotechnol. Prog. 2009, 25, 559–569. 10.1002/btpr.144. [DOI] [PMC free article] [PubMed] [Google Scholar]
- Griss R.; Schena A.; Reymond L.; Patiny L.; Werner D.; Tinberg C. E.; Baker D.; Johnsson K. Bioluminescent sensor proteins for point-of-care therapeutic drug monitoring. Nat. Chem. Biol. 2014, 10, 598–603. 10.1038/nchembio.1554. [DOI] [PubMed] [Google Scholar]
- Roda A.; Mirasoli M.; Michelini E.; Di Fusco M.; Zangheri M.; Cevenini L.; Roda B.; Simoni P. Progress in chemical luminescence-based biosensors: A critical review. Biosens. Bioelectron. 2016, 76, 164–179. 10.1016/j.bios.2015.06.017. [DOI] [PubMed] [Google Scholar]
- Scabini M.; Stellari F.; Cappella P.; Rizzitano S.; Texido G.; Pesenti E. In vivo imaging of early stage apoptosis by measuring real-time caspase-3/7 activation. Apoptosis 2011, 16, 198–207. 10.1007/s10495-010-0553-1. [DOI] [PubMed] [Google Scholar]
- Shi J.; Zhang H.; Fang L.; Xi Y.; Zhou Y.; Luo R.; Wang D.; Xiao S.; Chen H. A novel firefly luciferase biosensor enhances the detection of apoptosis induced by ESAT-6 family proteins of Mycobacterium tuberculosis. Biochem. Biophys. Res. Commun. 2014, 452, 1046–1053. 10.1016/j.bbrc.2014.09.047. [DOI] [PubMed] [Google Scholar]
- Kanno A.; Yamanaka Y.; Hirano H.; Umezawa Y.; Ozawa T. Cyclic luciferase for real-time sensing of caspase-3 activities in living mammals. Angew. Chem., Int. Ed. 2007, 46, 7595–7599. 10.1002/anie.200700538. [DOI] [PubMed] [Google Scholar]
- Angers S. Detection of beta 2-adrenergic receptor dimerization in living cells using bioluminescence resonance energy transfer (BRET). Proc. Natl. Acad. Sci. U. S. A. 2000, 97, 3684–3689. 10.1073/pnas.060590697. [DOI] [PMC free article] [PubMed] [Google Scholar]
- Dacres H.; Michie M.; Trowell S. C. Comparison of enhanced bioluminescence energy transfer donors for protease biosensors. Anal. Biochem. 2012, 424, 206–210. 10.1016/j.ab.2012.02.028. [DOI] [PubMed] [Google Scholar]
- Branchini B. R.; Rosenberg J. C.; Ablamsky D. M.; Taylor K. P.; Southworth T. L.; Linder S. J. Sequential bioluminescence resonance energy transfer-fluorescence resonance energy transfer-based ratiometric protease assays with fusion proteins of firefly luciferase and red fluorescent protein. Anal. Biochem. 2011, 414, 239–245. 10.1016/j.ab.2011.03.031. [DOI] [PubMed] [Google Scholar]
- Dacres H.; Dumancic M. M.; Horne I.; Trowell S. C. Direct comparison of fluorescence- and bioluminescence-based resonance energy transfer methods for real-time monitoring of thrombin-catalysed proteolytic cleavage. Biosens. Bioelectron. 2009, 24, 1164–1170. 10.1016/j.bios.2008.07.021. [DOI] [PubMed] [Google Scholar]
- Dacres H.; Dumancic M. M.; Horne I.; Trowell S. C. Direct comparison of bioluminescence-based resonance energy transfer methods for monitoring of proteolytic cleavage. Anal. Biochem. 2009, 385, 194–202. 10.1016/j.ab.2008.10.040. [DOI] [PubMed] [Google Scholar]
- Loening A. M.; Fenn T. D.; Wu A. M.; Gambhir S. S. Consensus guided mutagenesis of Renilla luciferase yields enhanced stability and light output. Protein Eng., Des. Sel. 2006, 19, 391–400. 10.1093/protein/gzl023. [DOI] [PubMed] [Google Scholar]
- Dragulescu-Andrasi A.; Chan C. T.; De A.; Massoud T. F.; Gambhir S. S. Bioluminescence resonance energy transfer (BRET) imaging of protein-protein interactions within deep tissues of living subjects. Proc. Natl. Acad. Sci. U. S. A. 2011, 108, 12060–5. 10.1073/pnas.1100923108. [DOI] [PMC free article] [PubMed] [Google Scholar]
- Hall M. P.; Unch J.; Binkowski B. F.; Valley M. P.; Butler B. L.; Wood M. G.; Otto P.; Zimmerman K.; Vidugiris G.; MacHleidt T.; Robers M. B.; Benink H. A.; Eggers C. T.; Slater M. R.; Meisenheimer P. L.; Klaubert D. H.; Fan F.; Encell L. P.; Wood K. V. Engineered luciferase reporter from a deep sea shrimp utilizing a novel imidazopyrazinone substrate. ACS Chem. Biol. 2012, 7, 1848–1857. 10.1021/cb3002478. [DOI] [PMC free article] [PubMed] [Google Scholar]
- Robers M. B.; Dart M. L.; Woodroofe C. C.; Zimprich C. A.; Kirkland T. A.; Machleidt T.; Kupcho K. R.; Levin S.; Hartnett J. R.; Zimmerman K.; Niles A. L.; Ohana R. F.; Daniels D. L.; Slater M.; Wood M. G.; Cong M.; Cheng Y.-Q.; Wood K. V. Target engagement and drug residence time can be observed in living cells with BRET. Nat. Commun. 2015, 6, 10091. 10.1038/ncomms10091. [DOI] [PMC free article] [PubMed] [Google Scholar]
- Yang J.; Cumberbatch D.; Centanni S.; Shi S.; Winder D.; Webb D.; Johnson C. H. Coupling optogenetic stimulation with NanoLuc-based luminescence (BRET) Ca2+ sensing. Nat. Commun. 2016, 7, 13268. 10.1038/ncomms13268. [DOI] [PMC free article] [PubMed] [Google Scholar]
- Aper S. J. A.; Dierickx P.; Merkx M. Dual readout BRET/FRET sensors for measuring intracellular zinc. ACS Chem. Biol. 2016, 11, 2854–2864. 10.1021/acschembio.6b00453. [DOI] [PMC free article] [PubMed] [Google Scholar]
- Arts R.; den Hartog I.; Zijlema S.; Thijssen V.; van der Beelen S.; Merkx M. Detection of antibodies in blood plasma using bioluminescent sensor proteins and a smartphone. Anal. Chem. 2016, 88, 4525–4532. 10.1021/acs.analchem.6b00534. [DOI] [PubMed] [Google Scholar]
- Shaner N. C.; Lambert G. G.; Chammas A.; Ni Y.; Paula J.; Baird M. A.; Sell B. R.; Allen J. R.; Day R. N.; Davidson M. W.; Wang J. A bright monomeric green fluorescent protein derived from Branchiostoma lanceolatum. Nat. Methods 2013, 10, 407–409. 10.1038/nmeth.2413. [DOI] [PMC free article] [PubMed] [Google Scholar]
- Pop C.; Salvesen G. S. Human caspases: Activation, specificity, and regulation. J. Biol. Chem. 2009, 284, 21777–21781. 10.1074/jbc.R800084200. [DOI] [PMC free article] [PubMed] [Google Scholar]
- McStay G. P.; Salvesen G. S.; Green D. R. Overlapping cleavage motif selectivity of caspases: implications for analysis of apoptotic pathways. Cell Death Differ. 2008, 15, 322–331. 10.1038/sj.cdd.4402260. [DOI] [PubMed] [Google Scholar]
- Bertrand R.; Solary E.; O’Connor P.; Kohn K. W.; Pommier Y. Induction of a common pathway of apoptosis by staurosporine. Exp. Cell Res. 1994, 211, 314. 10.1006/excr.1994.1093. [DOI] [PubMed] [Google Scholar]
- Angres B.; Steuer H.; Weber P.; Wagner M.; Schneckenburger H. A membrane-bound FRET-based caspase sensor for detection of apoptosis using fluorescence lifetime and total internal reflection microscopy. Cytometry, Part A 2009, 75, 420–427. 10.1002/cyto.a.20698. [DOI] [PubMed] [Google Scholar]
- Suzuki K.; Kimura T.; Shinoda H.; Bai G.; Daniels M. J.; Arai Y.; Nakano M.; Nagai T. Five colour variants of bright luminescent protein for real-time multicolour bioimaging. Nat. Commun. 2016, 7, 13718. 10.1038/ncomms13718. [DOI] [PMC free article] [PubMed] [Google Scholar]
- Zhou Q.; Snipas S.; Orth K.; Muzio M.; Dixit V. M.; Salvesen G. S. Target Protease Specificity of the Viral Serpin CrmA. J. Biol. Chem. 1997, 272, 7797–7800. 10.1074/jbc.272.12.7797. [DOI] [PubMed] [Google Scholar]
Associated Data
This section collects any data citations, data availability statements, or supplementary materials included in this article.


