

Abstract
Purpose
HER2-positive breast cancer is heterogeneous. Some tumors express mutations, like activating PIK3CA mutations or reduced PTEN expression, that negatively correlate with response to HER2-targeted therapies. In this exploratory analysis, we investigated whether the efficacy of trastuzumab emtansine (T-DM1), an antibody–drug conjugate comprised of the cytotoxic agent DM1 linked to the HER2-targeted antibody trastuzumab, was correlated with the expression of specific biomarkers in the phase III EMILIA study.
Experimental Design
Tumors were evaluated for HER2 (n = 866), EGFR (n = 832), and HER3 (n = 860) mRNA expression by quantitative reverse transcriptase PCR; for PTEN protein expression (n = 271) by IHC; and for PIK3CA mutations (n = 259) using a mutation detection kit. Survival outcomes were analyzed by biomarker subgroups. T-DM1 was also tested on cell lines and in breast cancer xenograft models containing PIK3CA mutations.
Results
Longer progression-free survival (PFS) and overall survival (OS) were observed with T-DM1 compared with capecitabine plus lapatinib in all biomarker subgroups. PIK3CA mutations were associated with shorter median PFS (mutant vs. wild type: 4.3 vs. 6.4 months) and OS (17.3 vs. 27.8 months) in capecitabine plus lapatinib–treated patients, but not in T-DM1-treated patients (PFS, 10.9 vs. 9.8 months; OS, not reached in mutant or wild type). T-DM1 showed potent activity in cell lines and xenograft models with PIK3CA mutations.
Conclusions
Although other standard HER2-directed therapies are less effective in tumors with PI3KCA mutations, T-DM1 appears to be effective in both PI3KCA-mutated and wild-type tumors.
Introduction
Overexpression of HER2 occurs in approximately 15% to 20% of breast cancers and is associated with poor prognosis (1). HER2 homodimerization or heterodimerization with other HER family members leads to the activation of the HER2 receptor tyrosine kinase through autophosphorylation, and transphosphorylation of other HER receptors, resulting in the activation of downstream signaling pathways that regulate cell growth and survival (2). The humanized mAb trastuzumab binds subdomain IV of the HER2 extracellular domain (ECD). Reported mechanisms of action of trastuzumab include inhibition of HER2 ECD shedding, disruption of downstream signal transduction pathways (most notably the PI3K pathway), and mediation of antibody-dependent cell-mediated cytotoxicity (ADCC; ref. 3). Trastuzumab improves clinical outcomes when used with chemotherapy in patients with HER2-positive breast cancer (4, 5). Three other HER2-targeted agents have also been approved for the treatment of HER2-positive metastatic breast cancer (MBC): lapatinib, a dual tyrosine kinase inhibitor of HER1 (EGFR) and HER2; pertuzumab, a humanized mAb targeting the heterodimerization domain (subdomain II) of HER2; and trastuzumab emtansine (T-DM1), an antibody–drug conjugate composed of trastuzumab conjugated to the cytotoxic agent DM1 via a stable thioether linker.
Resistance to HER2-directed therapies may occur through a number of mechanisms, including, but not limited to, modulation of HER2 signaling at the receptor level (e.g., heterodimerization with EGFR or HER3, increased expression of HER receptor ligands; refs.6, 7), dysregulation of the PI3K/AKT pathway downstream from HER2 (8–10), and activation of alternate signal transduction pathways (e.g., signaling through the insulin-like growth factor 1 receptor; ref. 11). Constitutive activation of the PI3K/AKT pathway, via mutations in PIK3CA or through the loss of PTEN, is a key mechanism of resistance in HER2-positive breast cancer (8–10). These molecular alterations are associated with poorer outcomes or resistance to trastuzumab-, lapatinib-, and pertuzumab-containing therapies (8, 9, 12–17). PIK3CA mutations and the loss or diminished expression of PTEN have been reported in approximately 32% and 19% to 48% (depending on methodology and interpretation) of patients with HER2-positive MBC, respectively (14, 16). The most commonly occurring PIK3CA mutations in breast cancer are H1047R and E545K (18).
T-DM1 has multiple mechanisms of action. Like trastuzumab, T-DM1 binds subdomain IV of the HER2 ECD, leading to the inhibition of HER2-mediated signaling and HER2 ECD shedding, as well as the induction of ADCC (19). T-DM1 also induces mitotic arrest and subsequent apoptosis through intracellular release of the microtubule disrupting agent DM1 (20). This mechanism may be independent of signaling pathways downstream of HER2 in that the T-DM1–HER2 complex undergoes receptor-mediated internalization, with active DM1-containing catabolites subsequently released following lysosomal degradation (21). T-DM1 is active in HER2-positive trastuzumab- and lapatinib-resistant cell lines and tumor models (19, 20), as well as in patients with breast cancer progressing on trastuzumab and/or lapatinib treatment (22–25), suggesting at least a partially non-overlapping mechanism of action. In the phase III EMILIA study, T-DM1 treatment resulted in a significant improvement in progression-free (PFS) and overall survival (OS) with less toxicity compared with the then standard-of-care combination of capecitabine and lapatinib (CL) in patients with HER2-positive MBC previously treated with trastuzumab and a taxane (24).
Results from previous exploratory analyses in phase II studies suggested a correlation between improved clinical benefit with T-DM1 and higher levels of HER2 mRNA expression (22, 23, 26). Here, we present the results of exploratory biomarker analyses in EMILIA, as well as preclinical data evaluating the antitumor activity of T-DM1 in HER2-amplified breast cancer models with wild-type (WT) and mutant (MT) PIK3CA.
Materials and Methods
Patients
The EMILIA trial (NCT00829166) enrolled patients with centrally confirmed HER2-positive, unresectable, locally advanced breast cancer or MBC who had received treatment previously with trastuzumab and a taxane. A description of major inclusion and exclusion criteria for EMILIA is published elsewhere (24).
Study design
Patients were randomized to T-DM1 3.6 mg/kg i.v. every 21 days or capecitabine 1,000 mg/m2 orally twice daily on days 1 to 14 of a 21-day cycle plus lapatinib 1,250 mg orally once per day as continuous dosing. The randomization procedure, eligibility criteria, and primary endpoints have been published elsewhere (24).
The trial protocol was approved by the relevant Institutional Review Boards, and the trial was conducted in accordance with the Declaration of Helsinki, current FDA Good Clinical Practices, and applicable local laws. Participating patients provided written informed consent. Biomarker results are reported in accordance with reporting recommendations for tumor marker prognostic studies (Supplementary Table S1; ref. 27).
Biomarker assessments
Before randomization, tumor cell blocks or unstained slides (at least 11) were sent to the central laboratory (Targos Molecular Pathology GmbH or Clarient) for the confirmation of HER2 status. If prior approval had been granted by the sponsors, centrally confirmed HER2 results for patients participating in a current or previous F. Hoffmann-La Roche/Genentech– sponsored trial could be used for enrollment in EMILIA.
Both IHC and FISH methodologies were used, although only 1 positive result was required to determine eligibility. The central laboratory used assays or kits approved by the FDA to evaluate HER2 status with the HercepTest for IHC testing (Dako) and either the HER2 FISH pharmDx Kit (Dako) or the PathVysion HER2 FISH Kit (Abbott Molecular) for FISH testing.
Tumor tissue collected for central HER2 testing was also used for quantitative reverse transcription PCR analysis of EGFR, HER2, and HER3. This analysis was performed centrally at Targos Molecular Pathology GmbH using protocols and processing instructions developed at Roche Molecular Diagnostics. In addition, tumor tissue samples from patients who signed an optional research informed consent form could be analyzed for PIK3CA mutations and PTEN expression. PIK3CA mutation analyses (by allele-specific PCR) for the following mutations were performed using a Mutation Detection Kit on a COBAS Z480 analyzer (Roche Molecular Systems Inc.): exon 1, R88Q; exon 4, N345K; exon 7, C420R; exon 9, E542K, E545A, E545D, E545G, E545K, and Q546E, Q546K, Q546L, Q546R; exon 20, M1043I, H1047L, H1047R, H1047Y, and G1049R. Cytoplasmic PTEN expression in tumor tissue was measured by IHC using a PTEN (138G6) antibody (Cell Signaling Technology). PTEN expression levels were compared with surrounding normal tissue and categorized as “none,” “decreased,” “slightly decreased,” “equivalent,” or “increased,” as described previously (28).
Statistical analyses
EGFR, HER2, and HER3 subgroups were defined a priori as those with values >median or ≤ median for this study based on previous analyses of HER2 mRNA, which indicated that clinical outcomes diverged around the median value (22, 23, 26). Analysis of our data by percentile demonstrated that clinical outcomes diverged around the median, confirming that the median is an appropriate cutoff (Supplementary Fig. S1).
PFS, OS, and overall response rate (ORR) were defined as in the primary study analysis (24). Median PFS and OS were calculated using the Kaplan–Meier method. Univariate analysis using Cox proportional hazards modeling, stratified by world region, number of prior chemotherapeutic regimens for locally advanced breast cancer or MBC, and visceral versus nonvisceral disease, was used to estimate HRs and associated 95% confidence intervals (CI) for EGFR, HER2, HER3, PIK3CA, and PTEN as categorical variables.
Because of the potential for a relationship between biomarkers and clinical variables that may in turn influence survival, we also performed multivariate analysis using Cox proportional hazards modeling in which EGFR, HER2, and HER3 were evaluated as continuous variables to maximize statistical power and PIK3CA was evaluated as a categorical variable (WT, MT); PTEN was not evaluated because the number of patients in the “equivalent/increased” group was prohibitively small. The following additional variables were considered: world region, prior chemotherapy regimen in locally advanced/metastatic setting, visceral disease, age, race, number of disease sites, prior anthracycline therapy, baseline Eastern Cooperative Oncology Group performance score, progesterone receptor and estrogen receptor status, baseline disease measurability, menopausal status, prior anticancer therapy, prior trastuzumab therapy, and HER2 status. A stepwise variable selection procedure was used to select covariates that were statistically significant to obtain a final model. Tests for multiplicative interaction between treatment effect and biomarker status were also conducted. OR estimates and 95% CIs for ORR for each biomarker subgroup were derived using a logistic regression model.
Cell viability assays
Breast cancer cell lines SK-BR-3 (wild-type PIK3CA), BT-474 (PIK3CA mutation: K111N), ZR-75-30 (PIK3CA mutation: I391M ‘polymorphism’), HCC1954 (PIK3CA mutation: H1047R), and MCF7 (PIK3CA mutation: E545K) were obtained from the ATCC. EFM-192A (PIK3CA mutation: C420R) were obtained from the German Collection of Microorganisms and Cell Cultures. KPL-4 (PIK3CA mutation: H1047R) were kindly provided by Dr J. Kurebayashi (Kawasaki Medical School, Okayama, Japan). Cells from ATCC were authenticated at ATCC using short tandem repeat (STR) methodology. EFM-192A and KPL-4 cells were deposited into a Genentech cell bank upon receipt and were authenticated at Genentech using STR methodology. All cells were used within 3 months of thawing a frozen vial. Cells were maintained in Ham's F-12: DMEM (50:50), high glucose, supplemented with 10% heat-inactivated FBS, and 2 mmol/L L-glutamine (all from Invitrogen Corp). MCF7-neo/HER2 cells were engineered to express high levels of human HER2 using neomycin resistance for selection. Trastuzumab and T-DM1 were from Genentech, Inc. As defined previously, efficiency of transformation values for the p110α mutants, according to oncogenic potency, were as follows: >4.0 for E545K (MCF7) and H1047R (HCC1954, KPL-4), 3.0 to 4.0 for C420R (EFM-192A), and <2.0 for K111N (BT-474; ref. 29). Cell viability assays were performed as described previously (19).
In vivo efficacy studies
Mouse xenograft studies were performed as follows: KPL-4 cells (3 × 10⁶/mouse) were inoculated into SCID/beige mice (Charles River Laboratories); BT-474M1 and MCF7-neo/HER2 cells (5 × 10⁶/mouse) were inoculated into NCr nude mice (Taconic), which had 0.36 mg 17β-estradiol 60-day sustained release pellets implanted 1 to 3 days before inoculation. All cells were mixed 1:1 with Matrigel (Becton, Dickinson and Co) and were inoculated into the number 2/3 mammary fat pads. Mice were randomized when tumor volumes reached an average of 200 mm3. Mice were administered a single intravenous injection of T-DM1 (doses of 1, 3, 5, 6, or 10 mg/kg) or vehicle, and tumor growth was monitored by caliper measurement 1 to 2 times per week.
Results
Patients and biomarker subgroups
Patients were enrolled between February 2009 and October 2011. As with the primary analysis (24), the data cut-off date for the analysis of biomarker data was January 14, 2012, (median follow-up of 13 months) for PFS and ORR and July 31, 2012, (median follow-up of 19 months) for OS. EGFR, HER2, and HER3 mRNA results were available from 832, 866, and 860 patients, respectively (Supplementary Fig. S2). Results were available for PIK3CA and PTEN analyses from 259 and 271 patients, respectively, owing to constraints on tissue availability. Median mRNA concentration ratios (data not shown), PIK3CA mutation frequency, and PTEN expression were similar across treatment arms (Tables 1 and 2).
Table 1. Univariate analysis of PFS by biomarker status in EMILIA.
| CL | T-DM1 | ||||
|---|---|---|---|---|---|
|
|
|
||||
| N | Median PFS, mo | N | Median PFS, mo | Stratified HRa (95% CI) | |
| All patients | 496 | 6.4 | 495 | 9.6 | 0.65 (0.55–0.77) |
| EGFR mRNA concentration ratio | |||||
| ≤Median (0.145) | 214 | 6.9 | 202 | 10.6 | 0.62 (0.48–0.81) |
| >Median (0.145) | 210 | 5.6 | 206 | 8.3 | 0.71 (0.55–0.91) |
| HER2 mRNA concentration ratio | |||||
| ≤Median (13.3) | 204 | 6.4 | 230 | 8.2 | 0.64 (0.50–0.82) |
| >Median (13.3) | 235 | 6.9 | 197 | 10.6 | 0.65 (0.50–0.85) |
| HER3 mRNA concentration ratio | |||||
| ≤Median (0.438) | 218 | 5.7 | 214 | 9.3 | 0.58 (0.45–0.74) |
| >Median (0.438) | 218 | 6.9 | 210 | 9.8 | 0.80 (0.62–1.04) |
| PIK3CA mutation statusb | |||||
| Mutated | 39 | 4.3 | 40 | 10.9 | 0.45 (0.25–0.82) |
| Wild type | 87 | 6.4 | 93 | 9.8 | 0.74 (0.50–1.10) |
| PTEN | |||||
| None/decreased/slightly decreased | 118 | 4.9 | 113 | 8.4 | 0.55 (0.39–0.78) |
| Equivalent/increased | 19 | 7.1 | 21 | 9.9 | 0.78 (0.32–1.91) |
The following stratification factors were used: world region (U.S., Western Europe, other), number of prior chemotherapeutic regimens (0–1 vs. >1), and site of disease involvement (visceral vs. nonvisceral).
Tumors were analyzed for the following mutations: exon 1, R88Q; exon 4, N345K; exon 7, C420R; exon 9, E542K, E545A, E545D, E545G, E545K, and Q546E, Q546K, Q546L, Q546R; exon 20, M1043I, H1047L, H1047R, H1047Y, and G1049R.
Table 2. Univariate analysis of OS by biomarker status in EMILIA.
| CL | T-DM1 | ||||
|---|---|---|---|---|---|
|
|
|
||||
| N | Median OS, mo | n | Median OS, mo | Stratified HRa (95% CI) | |
| All patients | 496 | 25.1 | 495 | 30.9 | 0.68 (0.54–0.85) |
| EGFR mRNA concentration ratio | |||||
| ≤Median (0.145) | 214 | 24.6 | 202 | 33.9 | 0.59 (0.42–0.83) |
| >Median (0.145) | 210 | 25.2 | 206 | 26.5 | 0.79 (0.56–1.10) |
| HER2 mRNA concentration ratio | |||||
| ≤Median (13.3) | 204 | 23.7 | 230 | 26.5 | 0.80 (0.59–1.09) |
| >Median (13.3) | 235 | 24.8 | 197 | 34.1 | 0.53 (0.37–0.76) |
| HER3 mRNA concentration ratio | |||||
| ≤Median (0.438) | 218 | 23.1 | 214 | NE | 0.64 (0.47–0.88) |
| >Median (0.438) | 218 | 27.1 | 210 | 31.9 | 0.71 (0.51–1.00) |
| PIK3CA mutation statusb | |||||
| Mutated | 39 | 17.3 | 40 | NE | 0.26 (0.12–0.57) |
| Wild type | 87 | 27.8 | 93 | NE | 0.68 (0.40–1.15) |
| PTEN | |||||
| None/decreased/slightly decreased | 118 | 23.6 | 113 | NE | 0.52 (0.32–0.86) |
| Equivalent/increased | 19 | 14.8 | 21 | NE | 0.43 (0.14–1.32) |
Abbreviation: NE, not estimable.
The following stratification factors were used: world region (U.S., Western Europe, other), number of prior chemotherapeutic regimens (0–1 vs. >1), and site of disease involvement (visceral vs. nonvisceral).
Tumors were analyzed for the following mutations: exon 1, R88Q; exon 4, N345K; exon 7, C420R; exon 9, E542K, E545A, E545D, E545G, E545K, and Q546E, Q546K, Q546L, Q546R; exon 20, M1043I, H1047L, H1047R, H1047Y, and G1049R.
Baseline demographic and disease characteristics of the sub-population of patients whose tumors were analyzed for biomarker expression were similar to those in the overall patient population (24), to patients for whom biomarker data were not available, and between treatment arms with 2 related exceptions (Supplementary Table S2). There were numerically greater proportions of patients from “other” world region and Asian patients for PIK3CA-nonevaluable versus PIK3CA-evaluable patients; however, the imbalance was numerically similar in each treatment arm. Moreover, world region was used as a stratification factor in these analyses, and its effect is thus accounted for statistically.
Impact of different levels of HER2 expression on T-DM1 activity
T-DM1 treatment, compared with CL, reduced the risk of disease progression to a similar degree in patients with HER2-positive MBC regardless of the extent of overexpression of tumor HER2 mRNA (i.e., >median and ≤ median; Table 1; Fig. 1A). Similarly, there was an OS benefit favoring T-DM1 for patients with both >median and ≤median HER2 mRNA levels (Table 2; Fig. 1B). However, the survival benefit associated with T-DM1 treatment relative to CL was greater in patients whose tumors had >median HER2 mRNA levels (HR, 0.53; 95% CI, 0.37–0.76; median OS, 34.1 vs. 26.5 months) compared with those whose tumors had ≤ median levels (HR, 0.80; 95% CI, 0.59–1.09; median OS, 24.8 vs. 23.7 months). Results from multivariate analyses of PFS and OS by HER2 mRNA, which adjusted for potential baseline confounding factors, were consistent with the findings from the univariate analyses (Table 3). Tests for interaction between treatment and HER2 mRNA level were not statistically significant (Table 3); however, these tests are exploratory and not powered to detect an interaction.
Figure 1.
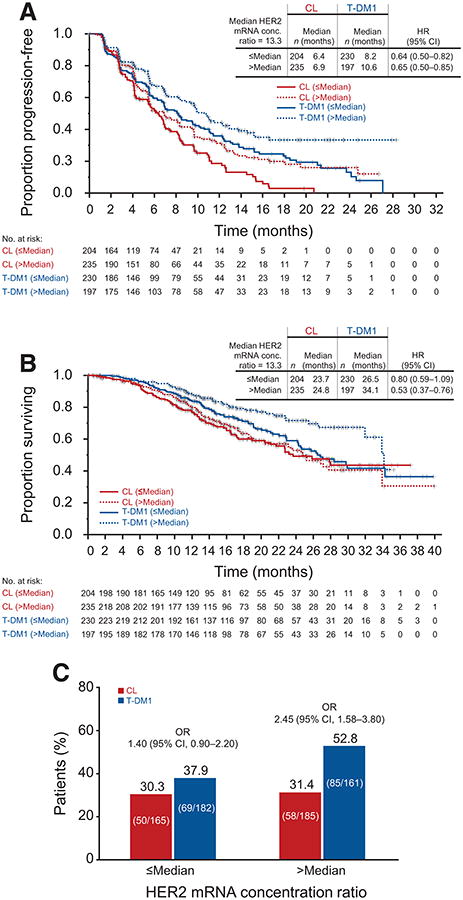
Kaplan–Meier estimates of PFS (A), OS (B), and ORR (C), by independent review committee, according to HER2 mRNA expression in EMILIA. HRs are based on unstratified analyses. Results for the CL arm are based on 439 patients who were evaluable for HER2 mRNA expression (88.5% of 496 patients randomized to CL). Results for the T-DM1 arm are based on 427 evaluable patients (86.3% of 495 patients randomized to T-DM1). OR, odds ratio.
Table 3. Multivariate Cox regression analysis of PFS and OS by biomarker status adjusting for prognostic and clinically important baseline variablesa,b; analysis of multiplicative interaction between treatment effect and biomarker status.
| EGFR, HER2, and HER3 evaluated as continuous variables | ||
|---|---|---|
|
| ||
| T-DM1 treatment relative to CL treatment HR (95% CI) | ||
|
| ||
| PFSc | OSd | |
| EGFR mRNA concentration ratio | 0.68 (0.57–0.82) | 0.64 (0.50–0.81) |
| HER2 mRNA concentration ratio | 0.69 (0.57–0.83) | 0.62 (0.49–0.78) |
| HER3 mRNA concentration ratio | 0.68 (0.57–0.82) | 0.61 (0.48–0.78) |
| EGFR, HER2, HER3, combined | 0.67 (0.56–0.81) | 0.61 (0.48–0.78) |
| PIK3CA mutation status evaluated as a categorical variable | ||
|
| ||
| T-DM1 treatment relative to CL treatment HR (95% CI) | ||
|
|
||
| PIK3CA mutation status | PFSe | OSf |
|
| ||
| Mutated (n = 79) | 0.50 (0.27–0.94) | 0.21 (0.09–0.47) |
| Wild type (n = 180) | 0.70 (0.47–1.03) | 0.65 (0.38–1.10) |
| P value for interactiong between treatment and biomarker expression | ||
|
|
||
| PFS | OS | |
|
| ||
| EGFR mRNA concentration ratio | 0.83 | 0.25 |
| HER2 mRNA concentration ratio | 0.07 | 0.13 |
| HER3 mRNA concentration ratio | 0.52 | 0.88 |
| PIK3CA mutation status | 0.22 | 0.05 |
The initial model also included the following variables: world region, prior chemotherapy regimen in locally advanced/metastatic setting, visceral disease, age, race, number of disease sites, prior anthracycline therapy, baseline Eastern Cooperative Oncology Group (ECOG) performance score, progesterone receptor and estrogen receptor status, baseline disease measurability, menopausal status, prior anticancer therapy, prior trastuzumab therapy, and HER2 status.
A stepwise procedure was used to determine the final model.
Significant baseline risk factors were number of disease sites per independent review (<3 or ≥3 sites); baseline ECOG performance score (0 or 1); and disease measurability by independent review (yes or no).
Significant baseline risk factors were number of disease sites per independent review (<3 or ≥3 sites); baseline ECOG performance score (0 or 1); and prior trastuzumab therapy for metastatic breast cancer (yes or no).
The only significant baseline risk factor for the PIK3CA-mutated group was the number of disease sites per independent review (<3 or ≥3 sites). The only significant factor for the PIK3CA wild-type group was the presence of visceral disease (yes or no).
The only significant baseline risk for the PIK3CA-mutated group was prior anthracycline treatment (yes or no). Significant factors for the PIK3CA wild-type group were number of disease sites per independent review (<3or ≥3 sites) and the presence of visceral disease (yes or no).
This analysis was conducted using a Cox proportional hazard model, and the P value was obtained using Wald statistics.
ORRs were higher in the T-DM1 arm compared with the CL arm for both HER2 mRNA subgroups (Fig. 1C).
Impact of EGFR and HER3 expression levels on T-DM1 activity
Median PFS and OS were longer in the T-DM1 arm than in the CL arm, independent of EGFR and HER3 mRNA expression level (Tables 1 and 2). The PFS and OS benefit with T-DM1 relative to CL was greater in patients with tumors containing ≤ median EGFR or HER3 mRNA levels compared with those with tumors containing >median levels (Tables 1 and 2). These differences were greater for OS than for PFS. Results from multivariate analyses of PFS and OS by EGFR and HER3 mRNA, which adjusted for potential baseline confounding factors, were consistent with the findings from the univariate analyses (Table 3). Tests for interaction between treatment and EGFR and HER3 mRNA level were not statistically significant (Table 3); however, these tests are exploratory and not powered to detect an interaction.
Association of PIK3CA mutation and PTEN expression status with treatment outcomes
Treatment benefit in terms of PFS, OS, and ORR was observed with T-DM1 relative to CL independent of PIK3CA mutation status (Tables 1 and 2; Fig. 2). Among patients treated with CL, the presence of a tumor PIK3CA mutation was associated with shorter median PFS (MT vs. WT, 4.3 vs. 6.4 months), shorter median OS (17.3 vs. 27.8 months), and lower ORR (17.1% vs. 39.7%). A differential treatment effect based on PIK3CA mutation status was not observed in T-DM1–treated patients (PFS, 10.9 vs. 9.8 months; OS, not reached in MT or WT; ORR, 50.0% vs. 47.4%; Tables 1 and 2; Fig. 2). Consistent with these data, the reduction in risk of disease progression with T-DM1 relative to CL was greater in patients with PIK3CA-mutated tumors (HR, 0.45; 95% CI, 0.25–0.82) than in those with WT tumors (HR, 0.74; 95% CI, 0.50–1.10; Table 1; Fig. 2A). A similar result was seen for the reduction in risk of death (MT PIK3CA: HR, 0.26; 95% CI, 0.12–0.57; WT PIK3CA: HR, 0.68; 95% CI, 0.40–1.15; Table 2; Fig. 2B). These findings were further supported by multivariate analyses of PFS and OS, which adjusted for baseline factors (Table 3). There was an interaction between treatment effect and PI3KCA mutation status with respect to OS (P = 0.05) but not PFS (P = 0.22), suggesting that the OS benefit is affected by mutation status. However, benefit was seen in both PI3KCA-mutated and WT tumors (Table 3).
Figure 2.
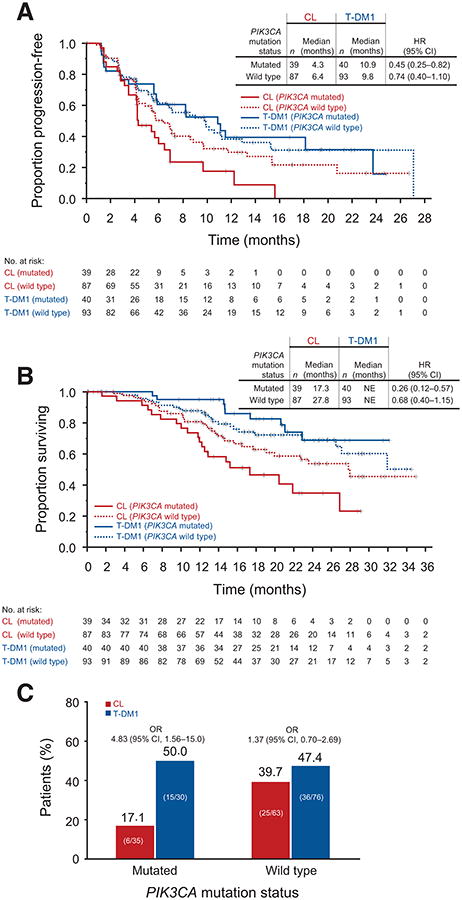
Kaplan–Meier estimates of PFS (A) and OS (B), as well as ORR (C), by independent review committee, according to PIK3CA mutation status in EMILIA. HRs are based on unstratified analyses. Results for the CL arm are based on 126 patients who were evaluable for PIK3CA mutation status (25.4% of 496 patients randomized to CL). Results for the T-DM1 arm are based on 133 evaluable patients (26.9% of 495 patients randomized to T-DM1). NE, not estimable. OR, odds ratio.
T-DM1 was associated with longer median PFS and OS compared with CL, regardless of tumor PTEN expression (Tables 1 and 2).
In patients with absent or decreased tumor PTEN expression, the decreased risk of disease progression with T-DM1 relative to that with CL (HR, 0.55; 95% CI, 0.39–0.78) was greater than in patients with normal-to-increased tumor PTEN expression (HR, 0.78; 95% CI, 0.32–1.91) (Table 1). This relationship was not observed for OS (decreased PTEN expression: HR, 0.52; 95% CI, 0.32–0.86; normal-to-increased PTEN expression: HR, 0.43; 95% CI, 0.14–1.32; Table 2).
Activity of T-DM1 in PIK3CA-mutant breast cancer cell lines and xenograft models
To further characterize the activity of T-DM1 in HER2-positive tumors with PIK3CA mutations, HER2-amplified breast cancer cell lines with WT PIK3CA and with specific PIK3CA mutations were treated with T-DM1 and trastuzumab. At concentrations ≥0.01 μg/mL, sensitivity to T-DM1 was observed across all cell lines with various activating PIK3CA mutations (Fig. 3). T-DM1 consistently showed enhanced potency relative to trastuzumab. In contrast, sensitivity to trastuzumab appeared to be mutation specific (Fig. 3). Consistent with other reports (9), cell lines with the H1047R (i.e., HCC1954, KPL-4) and E545K mutations (i.e., MCF7-neo/HER2) were insensitive to trastuzumab at all concentrations evaluated. Less-activating mutations (e.g., K111N) did not appear to confer resistance to trastuzumab.
Figure 3.
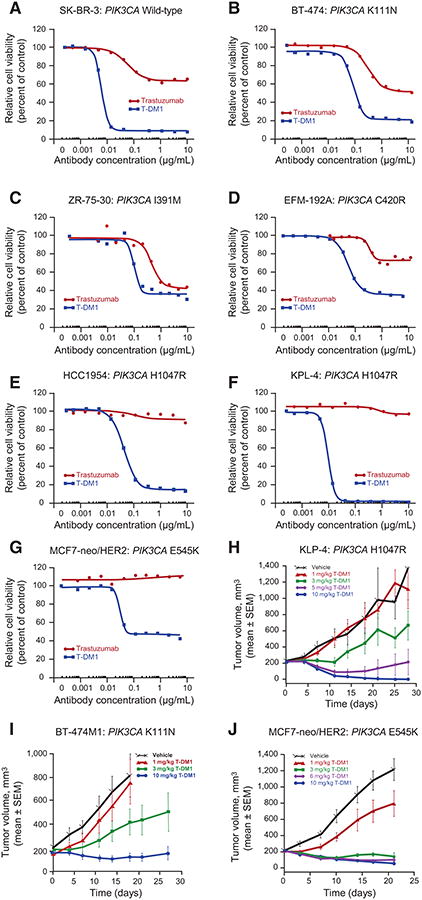
Response to T-DM1 in HER2-amplified breast cancer cell lines and xenograft models expressing mutant PIK3CA. Breast cancer cells were treated for 5 days with different concentrations of T-DM1 or trastuzumab. Cell viability was assessed using the CellTiter-Glo Luminescent Cell Viability Assay. The following cell lines were tested: SK-BR-3 (wild-type PIK3CA; A); BT-474 (mutant PIK3CA K111N, weakly activating; B); ZR-75-30 (mutant PIK3CA I391M; C); EFM-192A (mutant PIK3CA C420R, strongly activating; D); HCC1954 (mutant hotspot PIK3CA H1047R; E); KPL-4 (mutant H1047R; F); MCF7-neo/HER2 (mutant hotspot E545K; G). Antitumor efficacy of T-DM1 was assessed in PIK3CA-mutant breast cancer cell xenograft models. Xenograft models were initiated by inoculating KPL-4 cells (activating H1047R PIK3CA mutation; H) into the mammary fat pads of SCID beige mice or by inoculating BT-474M1 (nonactivating K111N PIK3CA mutation; I), or MCF7-neo/HER2 (activating E545K PIK3CA mutation; J) cells into the mammary fat pads of NCr nude mice, which had 0.36-mg 17β-estradiol 60-day sustained release pellets implanted 1 to 3 days prior to cell inoculation. In all models, once tumor volumes reached an average of 200 mm3, mice were administered a single intravenous injection of T-DM1 (doses of 1, 3, 5, 6, or 10 mg/kg) or vehicle. Tumor growth was monitored by caliper measurement.
We next evaluated the in vivo antitumor activity of T-DM1 in 3 mouse orthotopic xenograft models of human breast cancer expressing activating (H1047R/KPL-4, E545K/MCF7-neo/HER2) or nonactivating (K111N/BT-474M1) PIK3CA mutations (Fig. 3). Inhibition of tumor growth was seen at T-DM1 doses ≥3 mg/kg in all 3 models, irrespective of PIK3CA mutation status. A single dose of T-DM1 ≥5 mg/kg was sufficient to achieve regression and/or complete suppression of tumor growth through ≥20 days after administration. In vehicle-treated animals, tumors continued to grow throughout the time of the experiments compared with vehicle-treated control animals.
Discussion
De novo and acquired resistance to HER2-directed therapies occurs through multiple mechanisms (6–11) and can limit efficacy (8, 9, 14, 15).T-DM1 may retain antitumor activity in the presence of some resistance mechanisms, in part because of its cytotoxic moiety, which has a mechanism of action that largely bypasses intracellular signaling pathways downstream of HER2 (Supplementary Fig. S3; ref. 20). In this exploratory biomarker analysis of the EMILIA trial, T-DM1 produced superior survival outcomes relative to CL in all of the analyzed tumor biomarker subgroups.
Aberrant activation of the PI3K/AKT/mTOR pathway, such as occurs in the presence of activating PIK3CA mutations or through the loss of PTEN expression, results in constitutive pathway activation downstream of HER2, and can lead to decreased activity of trastuzumab-, lapatinib-, and pertuzumab-containing therapies (8, 9, 12–17). In our study, the presence of PIK3CA mutations was associated with shorter PFS and OS durations in patients who received CL but did not adversely affect efficacy with T-DM1. T-DM1 also appeared to result in a greater PFS benefit versus CL in patients with absent or decreased PTEN expression, although the sample size is small. Taken together, these data suggest that activation of the PI3K/AKT/mTOR pathway may mediate resistance to lapatinib but not T-DM1. The results with CL in patients in EMILIA presented here are consistent with preclinical findings that activating PIK3CA mutations mediate resistance to lapatinib (10) and with the recently reported NeoALTTO study of neoadjuvant trastuzumab versus lapatinib versus the combination (15). In this study, PIK3CA mutations correlated with a statistically significant decrease in the rate of pathologic complete response when compared with tumors lacking such mutations. Moreover, the cell culture and mouse xenograft data reported here provide complementary evidence that T-DM1 has cytotoxic activity in vitro and in vivo regardless of PIK3CA mutation status. Recent data from the phase III TH3RESA study in patients who previously received ≥2 prior HER2-directed regimens for advanced disease are consistent with the results presented here. PFS was similar in T-DM1–treated patients regardless of tumor PIK3CA mutation status or PTEN expression level (30).
Agents that can inhibit the constitutive activation of the PI3K/AKT/mTOR pathway may offer an additional approach to treating tumors resistant to other HER2-directed therapies. For example, although a randomized phase III trial evaluating the addition of the mTOR inhibitor everolimus to trastuzumab and paclitaxel did not improve PFS in the ITT population (31), a recent pooled analysis from this and a different phase III trial evaluating everolimus plus trastuzumab and vinorelbine (32) suggested that everolimus, when added to trastuzumab plus chemotherapy, conferred greater PFS benefit in patients with HER2-positive advanced breast cancer whose tumors exhibited mutations indicative of hyperactivation of the PI3K signaling pathway (i.e., PIK3CA mutations or low PTEN expression), compared with those without these mutations (33).
HER2 mRNA expression appeared to be proportionately related to efficacy in that median PFS and OS were longer in each treatment group in patients with >median tumor HER2 mRNA expression. These findings suggest that tumors with >median HER2 expression may be characterized by increased sensitivity to treatment with either T-DM1 or lapatinib and are consistent with reports from phase II studies of T-DM1 for HER2-positive MBC, in which patients with ≥median HER2 mRNA levels had longer median PFS durations and higher ORRs than those with <median HER2 mRNA levels (22, 23, 26).
EGFR mRNA expression also appeared to be proportionately related to efficacy in that median PFS and OS were shorter in T-DM1-treated patients with >median tumor EGFR mRNA expression. The role of increased EGFR expression warrants further investigation in preclinical models.
Our study is limited in that PIK3CA mutation and PTEN expression analyses were performed on subsets of the patient population owing to constraints on tissue availability. However, there were no clear differences in patient or disease characteristics between these subsets and the intent-to-treat population that were not accounted for statistically, suggesting that our results were not likely to be biased (Supplementary Table S2; ref. 24). Furthermore, a number of methods are currently used to categorize the extent of PTEN expression (12, 13, 16, 28, 30), and there is no standard validated method (16). Finally, archived tumor samples may not represent the molecular status of the tumors at the time of study treatment. However, it has been estimated that marked changes in HER2 expression levels from primary to metastatic tumors occur in only 10% of patients (34).
In conclusion, our data suggest that tumors previously exposed to trastuzumab and taxane with enhanced signaling through the HER2/PI3K/AKT pathway (e.g., PIK3CA-mutated tumors) may be sensitive to initial T-DM1 treatment and exhibit decreased sensitivity to CL or, when examined in preclinical models, trastuzumab. These results have clinical implications suggesting that single-agent T-DM1 may be active in HER2-positive MBC, which is less sensitive to other standard HER2-directed therapies. Validation in a prospective study is needed to confirm these results.
Supplementary Material
Translational Relevance.
HER2 overexpression is associated with poor prognosis in patients with metastatic breast cancer. Tumors often develop resistance to therapies that inhibit HER2 signaling, in part due to the constitutive activation of downstream pathways such as PI3K/AKT. Consistent with this, activating PIK3CA mutations and reduced PTEN expression have been negatively correlated with response to HER2-targeted therapies. Trastuzumab emtansine (T-DM1) has demonstrated activity in patients with HER2-positive breast cancer whose disease progressed on other HER2-targeted agents. Our results suggest that although the efficacy of capecitabine plus lapatinib is reduced in patients with tumors expressing PIK3CA mutations compared with patients with PIK3CA wild-type tumors, efficacy with T-DM1 is similar between the two groups. Furthermore, T-DM1 showed potent activity in preclinical models with PIK3CA mutations. Thus, T-DM1 appears efficacious in the presence of a biomarker previously associated with impaired response to other HER2-targeted treatments.
Acknowledgments
The authors thank Liang Fang, PhD, and Jennifer B. Kang, MS, who are former and current employees of Genentech, Inc, respectively, for conducting statistical analyses. The authors also thank Silke Hoersch, MS of F. Hoffmann-La Roche, who provided additional statistical input.
Grant Support: This study was funded by F. Hoffmann-La Roche, Ltd. Support for third-party writing assistance, furnished by Glen Miller, PhD, was provided by Genentech, Inc.
Footnotes
Note: Supplementary data for this article are available at Clinical Cancer Research Online (http://clincancerres.aacrjournals.org/).
Prior presentation: Preliminary account of these data has been presented in part at the annual meeting of the American Association for Cancer Research, Washington, DC, April 6 to 10, 2013. J Baselga, S Verma, J Ro, J Huober, et al. Relationship between tumor biomarkers (BM) and efficacy in EMILIA, a phase 3 study of trastuzumab emtansine (T-DM1) in HER2-positive metastatic breast cancer (MBC). Abstract LB-63.
Disclosure of Potential Conflicts of Interest: S. Verma is a consultant/advisory board member for Amgen, AstraZeneca, Boehringer Ingelheim, Novartis, and Roche. J. Huober reports receiving speakers bureau honoraria from Roche and is a consultant/advisory board member for GlaxoSmithKline and Roche. S. Olsen has ownership interests (including patents) in Genentech/Roche. M.D. Pegram is a consultant/advisory board member for Pfizer. G.D. Lewis Phillips, A.E. Guardino, and M.K. Samant are employees of Genentech. S.L. de Haas is an employee of F. Hoffmann-La Roche. No potential conflicts of interest were disclosed by the other authors.
Authors' Contributions: Conception and design: J. Baselga, S. Verma, A.E. Guardino, M.K. Samant, S. Olsen, M.D. Pegram
Development of methodology: J. Baselga, S. Verma, A.E. Guardino, M.K. Samant, S. Olsen, S.L. de Haas
Acquisition of data (provided animals, acquired and managed patients, provided facilities, etc.): J. Baselga, G.D. Lewis Phillips, S. Verma, J. Ro, J. Huober, A.E. Guardino, M.D. Pegram
Analysis and interpretation of data (e.g., statistical analysis, biostatistics, computational analysis): J. Baselga, G.D. Lewis Phillips, A.E. Guardino, M.K. Samant, S. Olsen, S.L. de Haas, M.D. Pegram
Writing, review, and/or revision of the manuscript: J. Baselga, G.D. Lewis Phillips, S. Verma, J. Ro, J. Huober, A.E. Guardino, M.K. Samant, S. Olsen, S.L. de Haas, M.D. Pegram
Study supervision: J. Baselga, S. Verma, A.E. Guardino, S. Olsen
References
- 1.Slamon DJ, Clark GM, Wong SG, Levin WJ, Ullrich A, McGuire WL. Human breast cancer: correlation of relapse and survival with amplification of the HER-2/neu oncogene. Science. 1987;235:177–82. doi: 10.1126/science.3798106. [DOI] [PubMed] [Google Scholar]
- 2.Yarden Y, Sliwkowski MX. Untangling the ErbB signalling network. Nat Rev Mol Cell Biol. 2001;2:127–37. doi: 10.1038/35052073. [DOI] [PubMed] [Google Scholar]
- 3.Spector NL, Blackwell KL. Understanding the mechanisms behind trastuzumab therapy for human epidermal growth factor 2-positive breast cancer. J Clin Oncol. 2009;27:5838–47. doi: 10.1200/JCO.2009.22.1507. [DOI] [PubMed] [Google Scholar]
- 4.Mariani G, Fasolo A, De Benedictis E, Gianni L. Trastuzumab as adjuvant systemic therapy for HER2-positive breast cancer. Nat Clin Pract Oncol. 2009;6:93–104. doi: 10.1038/ncponc1298. [DOI] [PubMed] [Google Scholar]
- 5.Del Mastro L, Lambertini M, Bighin C, Levaggi A, D'Alonzo A, Giraudi S, et al. Trastuzumab as first-line therapy in HER2-positive metastatic breast cancer patients. Expert Rev Anticancer Ther. 2012;12:1391–405. doi: 10.1586/era.12.107. [DOI] [PubMed] [Google Scholar]
- 6.Lee-Hoeflich ST, Crocker L, Yao E, Pham T, Munroe X, Hoeflich KP, et al. A central role for HER3 in HER2-amplified breast cancer: Implications for targeted therapy. Cancer Res. 2008;68:5878–87. doi: 10.1158/0008-5472.CAN-08-0380. [DOI] [PubMed] [Google Scholar]
- 7.Wilson TR, Fridlyand J, Yan Y, Penuel E, Burton L, Chan E, et al. Widespread potential for growth-factor-driven resistance to anticancer kinase inhibitors. Nature. 2012;487:505–9. doi: 10.1038/nature11249. [DOI] [PMC free article] [PubMed] [Google Scholar]
- 8.Nagata Y, Lan KH, Zhou X, Tan M, Esteva FJ, Sahin AA, et al. PTEN activation contributes to tumor inhibition by trastuzumab, and loss of PTEN predicts trastuzumab resistance in patients. Cancer Cell. 2004;6:117–27. doi: 10.1016/j.ccr.2004.06.022. [DOI] [PubMed] [Google Scholar]
- 9.Berns K, Horlings HM, Hennessy BT, Madiredjo M, Hijmans EM, Beelen K, et al. A functional genetic approach identifies the PI3K pathway as a major determinant of trastuzumab resistance in breast cancer. Cancer Cell. 2007;12:395–402. doi: 10.1016/j.ccr.2007.08.030. [DOI] [PubMed] [Google Scholar]
- 10.Eichhorn PJ, Gili M, Scaltriti M, Serra V, Guzman M, Nijkamp W, et al. Phosphatidylinositol 3-kinase hyperactivation results in lapatinib resistance that is reversed by the mTOR/phosphatidylinositol 3-kinase inhibitor NVP-BEZ235. Cancer Res. 2008;68:9221–30. doi: 10.1158/0008-5472.CAN-08-1740. [DOI] [PMC free article] [PubMed] [Google Scholar]
- 11.Lu Y, Zi X, Zhao Y, Mascarenhas D, Pollak M. Insulin-like growth factor-I receptor signaling and resistance to trastuzumab (Herceptin) J Natl Cancer Inst. 2001;93:1852–57. doi: 10.1093/jnci/93.24.1852. [DOI] [PubMed] [Google Scholar]
- 12.Esteva FJ, Guo H, Zhang S, Santa-Maria C, Stone S, Lanchbury JS, et al. PTEN, PIK3CA, p-AKT, and p-p70S6K status: association with trastuzumab response and survival in patients with HER2-positive metastatic breast cancer. Am J Pathol. 2010;177:1647–56. doi: 10.2353/ajpath.2010.090885. [DOI] [PMC free article] [PubMed] [Google Scholar]
- 13.Razis E, Bobos M, Kotoula V, Eleftheraki AG, Kalofonos HP, Pavlakis K, et al. Evaluation of the association of PIK3CA mutations and PTEN loss with efficacy of trastuzumab therapy in metastatic breast cancer. Breast Cancer Res Treat. 2011;128:447–56. doi: 10.1007/s10549-011-1572-5. [DOI] [PubMed] [Google Scholar]
- 14.Baselga J, Cortes J, Im SA, Clark E, Ross G, Kiermaier A, et al. Biomarker analyses in CLEOPATRA: A phase III, placebo-controlled study of pertuzumab in human epidermal growth factor receptor 2-positive, first-line metastatic breast cancer. J Clin Oncol. 2014;32:3753–61. doi: 10.1200/JCO.2013.54.5384. [DOI] [PubMed] [Google Scholar]
- 15.Majewski I, Nuciforo PG, Mittempergher L, Bosma AJ, Eidtmann H, Holmes E, et al. PI3KCA mutations are associated with decreased benefit to neoadjuvant HER2-targeted therapies in breast cancer. J Clin Oncol. 2015;33:1334–39. doi: 10.1200/JCO.2014.55.2158. [DOI] [PMC free article] [PubMed] [Google Scholar]
- 16.Park YH, Jung HA, Choi MK, Chang W, Choi YL, Do IG, et al. Role of HER3 expression and PTEN loss in patients with HER2-overexpressing metastatic breast cancer (MBC) who received taxane plus trastuzumab treatment. Br J Cancer. 2014;110:384–91. doi: 10.1038/bjc.2013.757. [DOI] [PMC free article] [PubMed] [Google Scholar]
- 17.Loibl S, von Minckwitz G, Schneeweiss A, Paepke S, Lehmann A, Rezai M, et al. PIK3CA mutations are associated with lower rates of pathologic complete response to anti-human epidermal growth factor receptor 2 (HER2) therapy in primary HER2-overexpressing breast cancer. J Clin Oncol. 2014;32:3212–20. doi: 10.1200/JCO.2014.55.7876. [DOI] [PubMed] [Google Scholar]
- 18.Lee JW, Soung YH, Kim SY, Lee HW, Park WS, Nam SW, et al. PIK3CA gene is frequently mutated in breast carcinomas and hepatocellular carcinomas. Oncogene. 2005;24:1477–80. doi: 10.1038/sj.onc.1208304. [DOI] [PubMed] [Google Scholar]
- 19.Junttila TT, Li G, Parsons K, Phillips GL, Sliwkowski MX. Trastuzumab-DM1 (T-DM1) retains all the mechanisms of action of trastuzumab and efficiently inhibits growth of lapatinib insensitive breast cancer. Breast Cancer Res Treat. 2011;128:347–56. doi: 10.1007/s10549-010-1090-x. [DOI] [PubMed] [Google Scholar]
- 20.Lewis Phillips GD, Li G, Dugger DL, Crocker LM, Parsons KL, Mai E, et al. Targeting HER2-positive breast cancer with trastuzumab-DM1, an antibody-cytotoxic drug conjugate. Cancer Res. 2008;68:9280–90. doi: 10.1158/0008-5472.CAN-08-1776. [DOI] [PubMed] [Google Scholar]
- 21.Erickson HK, Lewis Phillips GD, Leopold DD, Provenzano CA, Mai E, Johnson HA, et al. The effect of different linkers on target cell catabolism and pharmacokinetics/pharmacodynamics of trastuzumab maytansinoid conjugates. Mol Cancer Ther. 2012;11:1133–42. doi: 10.1158/1535-7163.MCT-11-0727. [DOI] [PubMed] [Google Scholar]
- 22.Burris HA, III, Rugo HS, Vukelja SJ, Vogel CL, Borson RA, Limentani S, et al. Phase II study of the antibody drug conjugate trastuzumab-DM1 for the treatment of human epidermal growth factor receptor 2 (HER2)-positive breast cancer after prior HER2-directed therapy. J Clin Oncol. 2011;29:398–405. doi: 10.1200/JCO.2010.29.5865. [DOI] [PubMed] [Google Scholar]
- 23.Krop IE, LoRusso P, Miller KD, Modi S, Yardley D, Rodriguez G, et al. A phase II study of trastuzumab emtansine in patients with human epidermal growth factor receptor 2-positive metastatic breast cancer who were previously treated with trastuzumab, lapatinib, an anthracycline, a taxane, and capecitabine. J Clin Oncol. 2012;30:3234–41. doi: 10.1200/JCO.2011.40.5902. [DOI] [PubMed] [Google Scholar]
- 24.Verma S, Miles D, Gianni L, Krop IE, Welslau M, Baselga J, Pegram M, et al. Trastuzumab emtansine for HER2-positive advanced breast cancer. N Engl J Med. 2012;367:1783–91. doi: 10.1056/NEJMoa1209124. [DOI] [PMC free article] [PubMed] [Google Scholar]
- 25.Krop IE, Kim SB, González-Martín A, LoRusso PM, Ferrero JM, Smitt M, et al. Trastuzumab emtansine versus treatment of physician's choice for pretreated HER2-positive advanced breast cancer (TH3RESA): A randomized, open-label, phase 3 trial. Lancet Oncol. 2014;15:689–99. doi: 10.1016/S1470-2045(14)70178-0. [DOI] [PubMed] [Google Scholar]
- 26.Perez EA, Hurvitz SA, Amler LC, Mundt KE, Ng V, Guardino E, et al. Relationship between HER2 expression and efficacy with first-line trastuzumab emtansine compared with trastuzumab plus docetaxel in TDM4450g: A randomized phase II study of patients with previously untreated HER2-positive metastatic breast cancer. Breast Cancer Res. 2014;16:R50. doi: 10.1186/bcr3661. [DOI] [PMC free article] [PubMed] [Google Scholar]
- 27.McShane LM, Altman DG, Sauerbrei W, Taube SE, Gion M, Clark GM, et al. REporting recommendations for tumor MARKer prognostic studies (REMARK) Nat Clin Pract Oncol. 2005;2:416–22. [PubMed] [Google Scholar]
- 28.Miller KD, Diéras V, Harbeck N, Andre F, Mahtani RL, Gianni L, et al. Phase IIa trial of trastuzumab emtansine with pertuzumab for patients with human epidermal growth factor receptor 2-positive, locally advanced, or metastatic breast cancer. J Clin Oncol. 2014;32:1437–44. doi: 10.1200/JCO.2013.52.6590. [DOI] [PubMed] [Google Scholar]
- 29.Gymnopolous M, Elsliger MA, Vogt PK. Rare cancer-specific mutations in PIK3CA show gain of function. Proc Natl Acad Sci U S A. 2007;104:5569–74. doi: 10.1073/pnas.0701005104. [DOI] [PMC free article] [PubMed] [Google Scholar]
- 30.Kim SB, Wildiers H, Krop IE, Leung ACF, Trudeau C, Yu R, et al. Relationship between tumor biomarkers and efficacy in TH3RESA, a phase 3 study of trastuzumab emtansine (T-DM1) vs treatment of physician's choice in HER2-positive advanced breast cancer previously treated with trastuzumab and lapatinib. J Clin Oncol. 2014;32:5s. suppl; abstr 605. [Google Scholar]
- 31.Hurvitz SA, Andre F, Jiang Z, Shao Z, Mano MS, Neciosup SP, et al. Combination of everolimus with trastuzumab plus paclitaxel as first-line treatment for patients with HER2-positive advanced breast cancer (BOLERO-1): a phase 3, randomised, double-blind, multicentre trial. Lancet Oncol. 2015;16:816–29. doi: 10.1016/S1470-2045(15)00051-0. [DOI] [PubMed] [Google Scholar]
- 32.André F, O'Regan R, Ozguroglu M, Toi M, Xu B, Jerusalem G, et al. Everolimus for women with trastuzumab-resistant, HER2-positive, advanced breast cancer (BOLERO-3): a randomised, double-blind, placebo-controlled phase 3 trial. Lancet Oncol. 2014;15:580–91. doi: 10.1016/S1470-2045(14)70138-X. [DOI] [PubMed] [Google Scholar]
- 33.Slamon DJ, Hurvitz SA, Chen D, Andre F, Tseng LM, Maria Jerusalem GH, et al. Predictive biomarkers of everolimus efficacy in HER2+ advanced breast cancer: Combined exploratory analysis from BOLERO-1 and BOLERO-3. J Clin Oncol. 2015;33 suppl; abstr 512. [Google Scholar]
- 34.Fabi A, Di Benedetto A, Metro G, Perracchio L, Nisticò C, Di Filippo F, et al. HER2 protein and gene variation between primary and metastatic breast cancer: significance and impact on patient care. Clin Cancer Res. 2011;17:2055–64. doi: 10.1158/1078-0432.CCR-10-1920. [DOI] [PubMed] [Google Scholar]
Associated Data
This section collects any data citations, data availability statements, or supplementary materials included in this article.