

Abstract
Most body mass index (BMI) genetic loci have been identified in studies of primarily European ancestries. The effect of these loci in other racial/ethnic groups is less clear. Thus, we aimed to characterize the generalizability of 170 established BMI variants, or their proxies, to diverse US populations and trans-ethnically fine-map 36 BMI loci using a sample of >102,000 adults of African, Hispanic/Latino, Asian, European and American Indian/Alaskan Native descent from the Population Architecture using Genomics and Epidemiology Study.
We performed linear regression of the natural log of BMI (18.5–70kg/m2) on the additive single nucleotide polymorphisms (SNPs) at BMI loci on the MetaboChip (Illumina, Inc.), adjusting for age, sex, population stratification, study site or relatedness. We then performed fixed-effect meta-analyses and a Bayesian trans-ethnic meta-analysis to empirically cluster by allele frequency differences. Lastly, we approximated conditional and joint associations to test for the presence of secondary signals.
We noted directional consistency with the previously reported risk alleles beyond what would have been expected by chance (binomial p<0.05). Nearly a quarter of the previously described BMI index SNPs and 29 of 36 densely-genotyped BMI loci on the MetaboChip replicated/generalized in trans-ethnic analyses. We observed multiple signals at 9 loci, including the description of seven loci with novel multiple signals.
This study supports the generalization of most common genetic loci to diverse ancestral populations and emphasizes the importance of dense multi-ethnic genomic data in refining the functional variation at genetic loci of interest and describing several loci with multiple underlying genetic variants.
Keywords: Fine-mapping, Body Mass Index, Allele Frequency Heterogeneity
INTRODUCTION
Obesity is a global epidemic and has become a top public health concern given its downstream effects on cardiovascular disease, diabetes, cancer, and other diseases (Popkin 2009). In the United States (US), there are marked racial/ethnic differences in obesity prevalence among adults (Flegal et al. 2012). For example, the US National Health and Nutrition Examination Survey estimated that in 2009–2010, non-Hispanic/Latino African descent (50%) and Hispanic/Latino (39%) adults had the highest burden of obesity; whereas adults of non-Hispanic/Latino European descent had the lowest (34%). Studies of Asian descent subpopulations indicate that they may have an even lower prevalence of obesity between 4–10% (Oza-Frank et al. 2009). Given that non-European ancestries and Hispanic/Latinos collectively make up more than one third of the US population and are experiencing some of the fastest population growth (Humes et al. 2011), future public health research on the determinants of obesity in US must be relevant to these racial/ethnic minorities.
Body mass index (BMI, kg/m2) is commonly used to classify obesity in epidemiologic studies and is a polygenic trait with heritability estimates ranging between 40–70% (Hjelmborg et al. 2008; Maes et al. 1997). As numerous genome-wide association studies (GWAS) of predominantly European descent populations have identified more than 100 BMI loci (Berndt et al. 2013; Locke et al. 2015; Okada et al. 2012; Speliotes et al. 2010; Wen et al. 2012; Wen et al. 2014; Willer et al. 2009; Winkler et al. 2015), little is known about the effect of these loci in non-European ancestries. Therefore, the study of diverse populations can inform the generalizability and diversity of alleles at established loci and aid the identification of underlying causal variants through trans-ethnic fine-mapping.
To this aim the Population Architecture using Genomics and Epidemiology (PAGE) Study was designed to extend the current body of knowledge on the genetic determinants of complex chronic diseases from studies of primarily European descent populations to African, Hispanic/Latino, Asian and American Indian/Alaskan Native ancestries (Matise et al. 2011), which within the US are differentially affected by the obesity epidemic (Flegal and Troiano 2000; Oza-Frank et al. 2009). In this study of approximately 102,000 adults from diverse ancestries, we aimed to generalize a total of 170 previously described BMI index single nucleotide polymorphisms (SNPs), or their available proxies, located within 166 loci and to fine-map 36 of these BMI loci with dense genotyping on the MetaboChip (Illumina, Inc.) using trans-ethnic meta-analytic methods to narrow the putative interval for future biologic study.
METHODS
Study Population
The Population Architecture using Genomics and Epidemiology (PAGE) Study is comprised of several large study sites/consortia and a coordinating center bringing together samples of diverse populations including those included in this analysis: the Atherosclerosis Risk in Communities (ARIC) Study, the Epidemiologic Architecture for Genes Linked to Environment study accessing BioVU (EAGLE BioVU), Coronary Artery Risk Development in Young Adults (CARDIA), Cardiovascular Health Study (CHS), the Hispanic Community Health Study/Study of Latinos (HCHS/SOL), Multiethnic Cohort (MEC), the Women’s Health Initiative (WHI) (Matise et al. 2011). Additional studies collaborating in this analysis also included: the GenNet Network (GenNet), the Hypertension Genetic Epidemiology Network (HyperGEN) Study, the MEC-Slim Initiative in Genomic Medicine for the Americas Type 2 Diabetes Consortium (MEC-SIGMA), the Mount Sinai School of Medicine BioBank (BioME), and the Taiwan-MetaboChip Study for Cardiovascular Disease (TaiChi) study. A detailed description of each study can be found in our Supplemental Materials.
Racial/ethnicity was self-reported in most studies except for EAGLE BioVU where racial/ethnicity is observer-reported (Dumitrescu et al. 2010; Hall et al. 2014). MEC-SIGMA sample included Type 2 Diabetes cases and controls from Los Angeles, CA (Consortium et al. 2014). The TaiChi Consortium substudies were conducted in Taiwan, the San Francisco Bay Area, and Hawaii and represent East Asian ancestry (Assimes et al. 2016). The PAGE MEC and WHI Hispanic/Latino samples predominantly represent individuals of Mexican origin (Carty et al. 2013), whereas the HCHS/SOL (Daviglus et al. 2012) and BioME Hispanic/Latino samples were more diverse with respect to Hispanic/Latino backgrounds and admixture (e.g. African, European and American Indian) (Tayo et al. 2011). The majority of WHI Asian American samples were of Chinese and Japanese descent, but also included smaller samples of other backgrounds (e.g. Hawaiian, Filipino, Korean, and Vietnamese). MEC represents both Japanese and Hawaiian ancestries, which were analyzed separately based on their self-reported Asian background. Only WHI recruited American Indians/Alaskan Natives.
The PAGE datasets generated during and/or analyzed during the current study are available in the dbGaP repository (http://www.ncbi.nlm.nih.gov/projects/gap/cgi-bin/study.cgi?study_id=phs000356.v1.p1). These non-PAGE datasets are either available on dbGaP or if not funded by the National Institutes of Health are available from the corresponding author by request. Each study obtained approval from their Institutional Review Boards and written consent from all participants with the exception of EAGLE BioVU, which followed an opt-out program (Pulley et al. 2010; Roden et al. 2008).
Genotyping and Imputation
The MetaboChip was a custom Illumina iSELECT array that contained approximately 195,000 SNPs and was designed to support large scale follow up of putative associations for cardiovascular and metabolic traits, including BMI (Voight et al. 2012). Approximately 33% of the MetaboChip SNPs were included as replication targets and 62% were included for fine-mapping within 257 targeted densely-genotyped loci, which included 21 loci associated with BMI as of 2009 (Voight et al. 2012) and 15 additional loci (i.e. originally included on the MetaboChip for other cardiometabolic traits) associated with BMI since 2009 (Locke et al. 2015; Okada et al. 2012; Speliotes et al. 2010; Wen et al. 2012; Wen et al. 2014; Winkler et al. 2015). Collectively, these 36 densely-genotyped BMI MetaboChip loci include 37,900 SNPs (Supplemental Table 1), represent 20% of all BMI loci identified as of June 2016. Across the entire MetaboChip more than a third of all BMI loci are represented by either at least one index SNPs, or at leats one proxy SNP. We define a locus as was done as part of the design of the MetaboChip (Voight et al. 2012). Therefore as shown in Supplemental Table 1 the number of SNPs per locus, which varied widely as a function of the base pair range of the putative region of interest (133 to 3,494 SNPs across 38 kb to 1.9Mb, respectively) and the tiered-prioritization of 11 dense-genotyping for cardiometabolic phenotypes of interest (e.g. BMI) (Voight et al. 2012).
As part of the PAGE Study, the genotyping of the MetaboChip was performed at research genomics laboratories: the Human Genetics Center of the University of Texas-Houston (Houston, TX), the Vanderbilt University Center for Human Genetics Research (CHGR) DNA Resources Core (Nashville, TN), University of Southern California Genomics Core (Los Angeles, CA), and the Translational Genomics Research Institute (Phoenix, AZ) (Buyske et al. 2012). Each genotyping center genotyped the same 90 HapMap YRI (Yoruba in Ibadan, Nigeria) samples and 2–3% study-specific blinded replicates to facilitate genotyping quality control. The study-specific SNP- and person-level quality control measures are summarized in Supplemental Table 2.
Imputation of MetaboChip SNPs was conducted in MEC-SIGMA (Hispanic/Latinos only), BioME (African and Hispanic/Latino ancestries), and WHI (representing 54% of WHI African descent women, and all of the WHI European descent women) using 1000 Genomes phase 1 reference populations, or in the case of WHI using study-specific reference samples (Liu et al. 2012), and then filtered on imputation quality (Supplemental Table 2). Less than a third of the final analytic sample genotypes were imputed.
In family- and household-based studies, the family structure was either accounted for using a linear mixed models (GenNet, HyperGen) or a generalized estimating equation incorporating clusters of 1st degree relative pairs/household members (HCHS/SOL) (Lin et al. 2014). Within each racial/ethnic group, related participants within the remaining studies and across the PAGE studies were identified using PLINK (Purcell et al. 2007). When apparent first-degree relative pairs or individuals with high inbreeding coefficients (F>0.15) (Weale 2010) were identified by non-PAGE study investigators or by the PAGE Coordinating Center, these individuals or the member from each pair with the lower call rate was excluded from further analysis. Principal components of ancestry were calculated using the Eigensoft software (Patterson et al. 2006; Price et al. 2006) and determined either among the unrelated subset, or in the 1000 Genomes reference populations, and then projected to the study and racial/ethnic sample (Lin et al. 2014). Within each race/ethnic group in each study, ancestral outliers of the resulting principal components were excluded by each study’s investigators or the PAGE Coordinating Center from further analysis (Buyske et al. 2012).
Ascertainment of BMI
Weight and height were measured by trained clinic staff in the ARIC, CARDIA, CHS, GenNet, HCHS/SOL, HyperGen, WHI and TaiChi studies. In EAGLE BioVU, weight and height were calculated across the complete medical histories (Crawford et al. 2015) following a published protocol (Goodloe et al. in press). For BioMe, height and weight measures were obtained from participants’ medical records at the time of enrollment (Locke et al. 2015; Monda et al. 2013). In MEC weight and height were self-reported by questionnaire with good validity (Lim et al. 2011; Lim et al. 2012).
BMI was then calculated as the ratio of weight to height squared. Following previous PAGE study recommendations to remove extreme outliers (Fesinmeyer et al. 2012; Gong et al. 2013), BMI values <18.5 or >70 kg/m2 are excluded due to the potential for these extremes to be coding errors, reflect underlying illnesses or rare genetic mutations. However, due to the young average age of CARDIA participants, additional data cleaning was performed in CARDIA and individuals <18.5kg/m2 were retained in the final analytic sample. To reduce the influence of variation in growth and development on quantitative variation in BMI, we limited our analytic samples to adults >19 years of age in EAGLE BioVU, CARDIA, and BioME, and >20 years of age in HCHS/SOL. Across the PAGE studies (Supplemental Table 3) we had genotype and BMI information available on a resulting analytic sample of 35,606 African, 26,048 Hispanic/Latino, 22,466 Asian and 535 American Indian/Alaskan Native descent adults.
Statistical Analysis
As described previously (Fesinmeyer et al. 2012; Gong et al. 2013) the distribution of BMI was naturally log (ln) transformed to minimize the influence of outliers. All regression models were adjusted for age, sex, the top 2 to top 10 principal components, and study site, as appropriate for the racial/ethnic group and study (Supplemental Table 2). Study- and racial/ethnic-specific linear regression models were implemented in PLINK (Purcell et al. 2007), R (WHI, https://cran.r-project.org), SNPTEST (BioME), GWAF (GenNet, HyperGen) (Chen and Yang 2010), or a weighted version of a generalized estimating equation in SUGEN (HCHS/SOL) (Lin et al. 2014).
Generalization of Established SNP-Associations with BMI in Diverse Populations
We created a Bonferroni corrected threshold of significance for the 170 index SNPs (or if unavailable on the MetaboChip, their highest LD proxy, r2≥0.8 in the discovery population 1000 Genomes pilot CEU, YRI, or CHB+JPT) from previous GWAS or MetaboChip-wide studies (Supplemental Table 4) after accounting for the four loci with more than one racial/ethnic specific finding in strong linkage disequilibrium (LD, r2≥0.8 in CEU, YRI and CHB+JPT). Replication (i.e. in the same population of discovery) or generalization (i.e. to another racial/ethnic group) was declared if an index SNP was: 1) Bonferroni significant for 166 independent tests (p-value<3.0×10⁻⁴) and 2) had a consistent direction of effect as the previous report. These same criteria were applied to any index SNP within the 36 densely-genotyped BMI loci. Strong evidence of effect heterogeneity was defined as less than a Bonferroni p-value (i.e. 0.05/166 for index SNPs, or a locus-specific threshold described below). Using a binomial distribution, we tested if the number of observed SNPs with directional consistency between the risk allele observed in this study and prior studies was greater than would be expected by chance (50% expected allele consistency by chance, p<0.05 significant).
Replication/Generalization of 36 Densely-Genotyped BMI Loci in Diverse Populations
To identify independent signals in the fine-mapped regions, we generated a locus-specific Bonferroni correction for multiple comparisons based on the number of independent SNPs (r2≤0.2, pruned in PLINK using a 50-SNP window that was shifted by five SNPs each iteration) in the African descent samples with MetaboChip data from the ARIC Study (n=3,399). This served as a worst-case scenario of the maximum number of independent tests in the present study’s populations with the least LD. The resulting p-value thresholds for statistical significance ranged from 6.31×10⁻⁵ to 1.39×10⁻³ (Supplemental Table 1).
Among the subset of the 28,573 SNPs passing quality control and located in the 36 densely-genotyped loci (range per locus: 110 to 2,785; Supplemental Table 1), we conducted inverse variance fixed-effect meta-analysis across studies (>100 observations each) in METAL (version 2011-03-25) (Willer et al. 2010) when the SNP was >0.1% minor allele frequency (MAF) in the racial/ethnic group and was informed by more than half of the maximum racial/ethnic-specific sample size.
Trans-Ethnic Meta-Analyses to Narrow the Putative Interval
Similarly, we generated trans-ethnic meta-analyses for SNPs >0.1% MAF in each racial/ethnic group and informed by at least two populations and more than half of the maximum trans-ethnic sample size (n=101,979). We excluded American Indians/Alaskan Natives from our trans-ethnic fixed-effect estimates due to their small sample size and possible within group heterogeneity due to their recruitment across all nation-wide WHI recruitment centers (n=535).
Linkage Disequilibrium
Finally the fine-mapping of causal variants was informed by estimates of population-specific allele frequencies and LD correlation (r2, 500 Kb sliding windows) in PLINK (Purcell et al. 2007) using genotypes from the ARIC (African descent), HCHS/SOL (Hispanic/Latino), and WHI studies (Asian, European, and American Indian/Alaskan Native ancestries). As done in a previous large meta-analysis of BMI (Justice et al. in press), trans-ethnic LD estimates were generated from a sample of 17,437 individuals from 1000 Genomes YRI (pilot), ARIC, MEC, HCHS/SOL and WHI, which was both closely proportionate to the racial/ethnic groups of our trans-ethnic meta-analysis (37% African, 26% Hispanic/Latino, 20% Asian, 17% European descent; compared to 35%, 26%, 22%, 18%, respectively, in the full trans-ethnic sample) and also representative of the PAGE studies with the greatest amount of within racial/ethnic group diversity (e.g. HCHS/SOL for Hispanic/Latinos, WHI for Asian Americans; see section on Study Population for more information). Regional plots were generated using LocusZoom to visualize trans-ethnic association differences as well as across the LD of various racial/ethnic groups (Pruim et al. 2010).
Bayesian Trans-Ethnic Meta-Analysis
Lastly, the assumption of fixed-effects across racial/ethnic groups was relaxed in a Bayesian trans-ethnic meta-analysis in MANTRA, which allows for the empirical estimation of mean allele frequency differences between racial/ethnic groups as prior information in the clustering of the observed genetic effects across defined racial/ethnic groups (Morris 2011)—in our case African, Hispanic/Latino, Asian and European ancestries. We adjusted for multiple comparisons in this Bayesian analysis by defining very strong evidence in favor of association as having a Bayes Factor (BF)>5, or strong evidence in favor for effect heterogeneity after applying MANTRA as having a posterior probability of effect heterogeneity above a Bonferroni correction for the number of independent index tests (e.g. posterior probability>1–0.05/166) or above the Bonferroni correction for the number of independents tests per locus, both described above. Furthermore, we also calculated the posterior probability ϕj that the .th SNP in the .th independent signal is causal as:
We then ranked all SNPs by their BFs and summed their cumulative posterior probabilities until it exceeded 99%. The resulting set of SNPs constitutes the 99% credible set and defines a genomic region where there is a 99% probability of containing the causal SNP, if the assumption holds that each region of interest contained only one causal variant.
Established and Novel Secondary Signals at Known Loci
We further investigated our trans-ethnic fixed-effect meta-analysis results at the 36 densely-genotyped loci for second independent signals using Genome-wide Complex Trait Analysis (GCTA, version 64) (Yang et al. 2012; Yang et al. 2011). To inform our approximations we used the same trans-ethnic genotypes of 17,437 individuals from 1000 Genomes YRI (pilot), ARIC, MEC, HCHS/SOL, and WHI, which were used to calculate trans-ethnic LD above and were proportionate to the racial/ethnic groups of our trans-ethnic meta-analysis. We first filtered out SNPs with high trans-ethnic heterogeneity (heterogeneity p-value<1.66×10⁻⁶) and then adjusted for the ‘lead SNPs’ (i.e. the marker with the smallest p-value within each region) of the densely-genotyped regions in an approximate conditional model. We contrasted the conditional effect estimates and p-values of the surrounding SNPs with their unconditional estimates to ascertain if any additional SNPs that were associated unconditionally with BMI at p-value<0.1 then arose as significantly ‘independent’ after we adjusted for the lead SNPs of these regions and took the number of independent tests in the region into account (see locus-specific threshold above). We repeated this approach to ensure that no additional significant lead conditional SNPs arose in subsequent rounds of adjustments.
Then we entered these potentially independent SNP markers into an approximate joint model in GCTA, which included all of the lead SNPs in the 36 densely-genotyped loci as well as the 170 index SNPs for BMI outside of these regions to account for any potential long-range LD with BMI loci not densely-mapped on the MetaboChip. Joint analyses were repeated dropping out the SNPs with non-significant joint p-values (p-value<0.05/166 for index SNPs; or p-value less than the locus-specific threshold for lead or secondary SNPs in densely-genotyped regions), until a final joint model included only significant joint SNP associations. As a sensitivity analysis of a subset of 6 loci with evidence of independent signals from the approximate GCTA analyses, we performed a single round of exact conditional analyses using the same statistical analysis and meta-analysis software as described above for the unconditional analyses. In this round we adjusted for the lead fixed-effect trans-ethnic SNP and queried the significance of the remaining SNPs within the densely-genotyped region. We also ran the approximate conditional analyses within each race/ethnic group, meta-analyzing conditional results across race/ethnic groups, and compared this approach to the exact and approximate conditional approaches, described above. Additionally these jointly significant SNPs were queried for functional annotation in HaploReg (version 4.1) (Ward and Kellis 2012). Both GERP and SiPhy conservation, as well as GENCODE and RefSeq genetic annotations were queried on each lead SNP.
Statistical Power
To aid with the interpretation of null study findings, post hoc we calculated statistical power in Quanto version 1.2.4 (Gauderman and Morrison 2006) to detect BMI genetic effects. Previous PAGE meta-analyses using this transformation have estimated that genetic effects for risk variants at FTO could be as much as 1% change in BMI per risk allele (or 0.0119 on the natural ln scale) (Gong et al. 2013). Using information available on the worst-case locus-specific Bonferroni correction from Supplemental Table 1 (6.31×10⁻⁵), the varying BMI distributions and sample sizes of the race/ethnic specific and trans-ethnic meta-analyses (Supplemental Table 3) we calculated power to detect effects up to as large as 1% change in BMI per risk allele.
As shown in Supplemental Figure 1, power was expected to be greatest in the trans-ethnic meta-analysis, which would allow for the identification of moderate genetic effects (>0.6% change per risk allele) at ≥80% power for low frequency variants (≥1%). Despite the smaller size of the Asian descent sample, we estimated that we generally would have better power in the analysis than in the African and Hispanic/Latino (>13,000 and >3,000 samples larger, respectively) descent analyses, which would allow us to describe large genetic effects at ≥80% for both low frequency and common variants (≥1%). In contrast, the African, Hispanic/Latino, and European descent analyses were expected not have sufficient power (<80%) to describe low frequency variants (e.g. ≤1%), and only had sufficient power (≥80%) to describe moderate effects (>0.6% change per risk allele) that were common (≥5%) in that specific race/ethnic group.
RESULTS
Our study was comprised of 102,514 individuals from five racial/ethnic groups, with a mean age spanning from 27 years old (range: 20–37 years) in CARDIA to 73 years (65–93 years) in CHS (Supplemental Table 3). The biobank studies (EAGLE BioVU, BioME), as well as HCHS/SOL, HyperGen, and TaiChi represented ages across more than 5 decades of the life course. Women comprised the majority (or entirety, as in the WHI) of all studies, except for the TaiChi sample, which was only 39% female. Within sex obesity prevalence varied substantially across studies (26–64% of females and 19–46% of males were obese at the time of assessment). Yet obesity prevalence appeared to be generally higher in women and men of African, Hispanic/Latino and American Indian/Alaskan Native ancestry compared to women and men of Asian and European ancestry.
Generalization of Established SNP-Associations with BMI in Diverse Populations
Overall, 135 of 165 SNPs, or their proxies (r2≥0.8), were previously shown to associate with BMI, passed quality control filters in at least two racial/ethnic groups, and displayed consistent directions of effect in the trans-ethnic fixed-effect meta-analysis (Supplemental Table 4). This is more concordant than would be expected by chance (binomial p, pbin =1.63×10⁻¹⁷). Of all 170 index SNPs, or their proxies, that passed quality control filters in at least one racial/ethnic group, 42 were significantly associated with BMI in either the trans-ethnic analyses or in at least one racial/ethnic group. For example, we replicated two African descent-specific associations at GALNT10 (rs4569924 p=4.79×10⁻⁵ (Monda et al. 2013). and DHX34 (rs4802349, p=3.79×10⁻⁸ (Gong et al. 2013)), and demonstrated generalization of associations from previous studies of European descent populations for two SNPs at 8p12 (rs7844647, r2=0.96 in CEU, p=2.03×10⁻⁴ (Winkler et al. 2015)) at AGBL4 (rs657452, p=5.52×10⁻⁶ (Locke et al. 2015)) to African and Hispanic/Latino descent individuals, respectively.
Eighteen of the 42 significant index SNP associations were only significant in the trans-ethnic sample, perhaps due to its larger sample size (Supplemental Table 4). Three SNPs exhibited significant heterogeneity across the racial/ethnic groups in the trans-ethnic fixed effect meta-analysis, yet only one of these SNPs (rs116612809, the index SNP at BRE and the most significant (‘top’) SNP in the African descent and trans-ethnic fixed-effect analyses) persisted to have evidence in favor of association after accounting for the ancestral heterogeneity in a Bayesian meta-analysis. One index SNP at TRAF3 (rs7143963; (Winkler et al. 2015)) was nominally significant and directionally consistent in both the African descent and trans-ethnic analyses, but only exhibited significant heterogeneity across the studies of African descent individuals (Supplemental Figure 2), wherein the effect estimates from two studies with <1,200 individuals were the most extreme (HyperGen n=1171, Risk allele frequency=66.9; MEC pilot n=433, 59.2%).
Replication/Generalization of 36 Densely-Genotyped BMI Loci in Diverse Populations
In 35,606 African descent individuals, 31 of 35 index SNPs (or their proxies) that passed quality controls and were located within one of the 36 densely-genotyped BMI loci showed an association that was directionally consistent with the previously reported risk allele (pbin=1.52×10⁻⁶). We observed no significant effect heterogeneity within the studies contributing samples of African descent individuals at either the index or lead SNPs (Supplemental Table 5). Our analysis of the dense genotypes of African descent individuals led to the generalization of 14 BMI loci (Table 1), including six loci (COBLL1, POC5, SLC22A3, TCF7L2, MAP2K5, ATP2A1) not previously associated in African descent populations, and eight loci that were previously generalized to African descent individuals (Gong et al. 2013): SEC16B, ETV5, TFAP2B, FTO and MC4R with the same lead SNP and TMEM18, GNPDA2, and BDNF-AS1/BDNF with a different lead marker (r2 of 0.86, 0.98, 0.11, respectively). Additionally as described previously (Gong et al. 2013), rs116612809 at BRE replicated as the most significant SNP for BMI in our expanded African descent sample (Table 1). Thus our findings resulted in a total of 15 BMI loci with significant evidence of association in African descent individuals, six of which were best represented by the index SNP from GWAS of European (Locke et al. 2015; Speliotes et al. 2010), and non-European populations (Gong et al. 2013; Monda et al. 2013; Pei et al. 2014).
Table 1.
Replication or generalization of 15 of the fine-mapped 36 BMI loci on the MetaboChip to 35,606 African Americans
| Index-Lead SNPS r2 range****
|
|||||||||||||||
|---|---|---|---|---|---|---|---|---|---|---|---|---|---|---|---|
| Gene | Chr | Marker Type | rsID | Bp37 | A1 | A2 | Freq | Effect (%) | StdErr (%) | P*** | I2 | HetP | N | In ARIC | In WHI EA |
| SEC16B | 1 | Index, Lead | rs543874 | 177,889,480 | g | a | 0.249 | 1.37 | 0.17 | 6.0E-15 | 44.5 | 4.2E-02 | 35,604 | 0.32–1 (same) | 0.96–1 (same) |
| TMEM18 | 2 | Index | rs13021737 | 632,348 | g | a | 0.883 | 1.36 | 0.23 | 8.9E-09 | 26.8 | 1.7E-01 | 35,541 | 0.42–1.00 | 1.00 |
| Lead | rs10865549 | 631,759 | a | g | 0.883 | 1.52 | 0.24 | 6.4E-10 | 0 | 5.0E-01 | 33,352 | ||||
| BRE*,** | 2 | Index, Lead | rs116612809 | 28,301,171 | g | a | 0.097 | 1.39 | 0.25 | 6.4E-08 | 0 | 6.3E-01 | 35,583 | 1 (same) | 1 (same) |
| COBLL1* | 2 | Index, Lead | rs10184004 | 165,508,389 | t | c | 0.719 | 0.72 | 0.17 | 2.1E-05 | 32.2 | 1.2E-01 | 35,598 | 1 (same) | 1 (same) |
| ETV5 | 3 | Index | rs1516725 | 185,824,004 | c | t | 0.817 | 0.64 | 0.20 | 1.2E-03 | 6.9 | 3.8E-01 | 35,485 | 0.18 | 0.57 |
| Lead | rs7647305 | 185,834,290 | c | t | 0.594 | 0.68 | 0.15 | 1.1E-05 | 0 | 5.3E-01 | 35,602 | ||||
| GNPDA2 | 4 | Index | rs10938397 | 45,182,527 | g | a | 0.250 | 0.77 | 0.17 | 8.4E-06 | 51.9 | 1.5E-02 | 35,517 | 0.22–0.98 | – |
| Lead | rs181153926 | 45,165,656 | t | c | 0.249 | 0.87 | 0.18 | 1.6E-06 | 44.5 | 4.8E-02 | 32,146 | ||||
| POC5 | 5 | Index | rs2112347 | 75,015,242 | t | g | 0.495 | 0.09 | 0.15 | 5.5E-01 | 0 | 8.9E-01 | 35,604 | 0.09 | 0.36 |
| Lead | rs984976 | 74,910,870 | a | g | 0.150 | 0.88 | 0.22 | 5.4E-05 | 0 | 5.2E-01 | 35,595 | ||||
| TFAP2B | 6 | Index | rs2207139 | 50,845,490 | g | a | 0.096 | 0.79 | 0.26 | 2.0E-03 | 44.7 | 4.1E-02 | 35,605 | 0.19 | 0.47 |
| Lead | rs2744475 | 50,784,880 | g | c | 0.331 | 0.84 | 0.16 | 2.0E-07 | 7.5 | 3.7E-01 | 35,513 | ||||
| SLC22A3* | 6 | Index | rs3127574 | 160,791,370 | c | g | 0.587 | 0.03 | 0.15 | 8.3E-01 | 4 | 4.1E-01 | 35,597 | <0.01 | <0.01 |
| Lead | rs116859471 | 160,736,564 | t | a | 0.002 | 7.37 | 1.95 | 2.4E-04 | 53.3 | 1.8E-02 | 33,916 | ||||
| TCF7L2* | 10 | Index, Lead | rs7903146 | 114,758,349 | c | t | 0.706 | 0.66 | 0.17 | 6.1E-05 | 26.7 | 1.8E-01 | 35,604 | 1 (same) | 1 (same) |
| BDNF-AS1/BDNF | 11 | Index | rs11030104 | 27,684,517 | a | g | 0.951 | 1.28 | 0.36 | 3.8E-04 | 14.6 | 3.0E-01 | 35,606 | 0.02–0.05 | <0.01 |
| Lead | rs7929344 | 27,743,495 | a | g | 0.245 | 0.78 | 0.18 | 1.1E-05 | 28.5 | 1.6E-01 | 35,586 | ||||
| MAP2K5 | 15 | Index | rs16951275 | 68,077,168 | t | c | 0.610 | 0.57 | 0.15 | 2.7E-04 | 0 | 5.7E-01 | 35,605 | 0.52–0.93 | 0.53–0.99 |
| Lead | rs3784718 | 68,098,004 | c | t | 0.630 | 0.61 | 0.16 | 1.2E-04 | 0 | 5.9E-01 | 34,268 | ||||
| ATP2A1 | 16 | Index | rs2650492 | 28,333,411 | a | g | 0.064 | 0.70 | 0.33 | 3.5E-02 | 0 | 5.3E-01 | 35,590 | 0.82 | 1.00 |
| Lead | rs8061590 | 28,895,130 | g | a | 0.312 | 0.69 | 0.16 | 2.5E-05 | 29.8 | 1.5E-01 | 35,592 | ||||
| FTO | 16 | Index | rs17817964 | 53,828,066 | t | c | 0.118 | 1.05 | 0.24 | 1.2E-05 | 33 | 1.2E-01 | 35,606 | 0.91–0.98 | 0.94–1.00 |
| Lead | rs62048402 | 53,803,223 | a | g | 0.114 | 1.19 | 0.24 | 1.1E-06 | 23 | 2.1E-01 | 35,603 | ||||
| MC4R | 18 | Index, Lead | rs6567160 | 57,829,135 | c | t | 0.189 | 1.08 | 0.19 | 2.8E-08 | 58.9 | 3.7E-03 | 35,599 | <0.01–1 (same) | <0.01–1 (same) |
Abbreviations: ARIC=Atherosclerosis Risk in Communities Study, Bp37=base pair Build 37, Chr=chromosome, EA=European American women, Freq=Frequency of A1, SNPs=single nucleotide polymorphisms, WHI=Women’s Health Initiative.
Note: Starred genes represent fine-mapped loci, which were associated with BMI after the design of the Metabochip in 2009.
Replication of African descent signal (Gong et al. 2013).
For GWAS SNPs a Bonferroni correction for multiple tests reflected the number of independent GWAS signals tested (=0.05/166; Supplemental Table 3). For all other SNPs in the fine-mapped BMI regions, we performed a Bonferroni correction for the number of independent SNPs per region (r2<0.2 in ARIC African-Americans; Supplemental Table 1).
The range of linkage disequilibrium captures any SNP within the fine-mapped loci (Supplemental Table 3) that represents the index BMI signal or secondary signal (described in European descent populations), or race/ethnic population specific marker. ARIC and WHI samples were used to represent the linkage disequilibrium for the PAGE African and European descent samples.
In a sample of 26,048 Hispanic/Latinos, 32 of 36 index SNPs in the densely-genotyped BMI loci had associations that were directionally consistent with previous reports (pbin=8.57×10⁻⁷). We also observed no significant heterogeneity within the Hispanic/Latinos studies at either the index or lead SNPs (Supplemental Table 6). Using the dense-genotyping at 36 BMI loci, we were able to generalize 13 BMI loci to Hispanic/Latinos (Table 2), including 8 loci that were generalized to African descent individuals (SEC16B TMEM18, COBLL1, GNPDA2, TCF7L2, MAP2K5, FTO and MC4R) plus an additional 5 loci (LYPLAL1, IGF2BP2, SLC39A8, KCNQ1, MTCH2) that only generalized to Hispanic/Latinos.
Table 2.
Generalization of 13 of the fine-mapped 36 BMI loci on the MetaboChip to 26,048 Hispanic/Latino Americans
| Index-Lead SNPS r2 range****
|
|||||||||||||||
|---|---|---|---|---|---|---|---|---|---|---|---|---|---|---|---|
| Gene | Chr | Marker Type | rsID | Bp37 | A1 | A2 | Freq | Effect (%) | StdErr (%) | P*** | ISq | HetP | N | In HCHS/SOL | In WHI EA |
| SEC16B | 1 | Index, Lead | rs543874 | 177,889,480 | g | a | 0.202 | 0.76 | 0.20 | 1.8E-04 | 0 | 4.4E-01 | 26,045 | 0.81–1 (same) | 0.96–1 (same) |
| LYPLAL1** | 1 | Index | rs2820436 | 219,640,680 | a | c | 0.439 | 0.63 | 0.17 | 1.6E-04 | 0 | 4.8E-01 | 26,046 | 0.33 | 0.55 |
| Lead | rs2820446 | 219,748,818 | g | c | 0.414 | 0.89 | 0.17 | 1.3E-07 | 50.8 | 5.8E-02 | 25,991 | ||||
| TMEM18 | 2 | Index | rs13021737 | 632,348 | g | a | 0.867 | 1.14 | 0.24 | 3.6E-06 | 29.5 | 2.0E-01 | 26,016 | 0.82–0.88 | 1.00 |
| Lead | rs6744653 | 628,524 | g | a | 0.849 | 1.25 | 0.23 | 8.5E-08 | 43.9 | 9.8E-02 | 26,047 | ||||
| COBLL1* | 2 | Index | rs10184004 | 165,508,389 | t | c | 0.326 | 0.39 | 0.18 | 3.2E-02 | 44 | 9.7E-02 | 26,045 | 0.67 | 0.45 |
| Lead | rs12692738 | 165,558,252 | c | t | 0.252 | 0.77 | 0.20 | 1.1E-04 | 33 | 1.8E-01 | 26,045 | ||||
| IGF2BP2** | 3 | Index | rs11927381 | 185,508,591 | t | c | 0.673 | 0.52 | 0.18 | 3.9E-03 | 23.6 | 2.5E-01 | 25,976 | 0.14 | 0.05 |
| Lead | rs6778126 | 185,405,781 | g | a | 0.515 | 0.63 | 0.17 | 1.5E-04 | 43.9 | 9.8E-02 | 26,043 | ||||
| GNPDA2 | 4 | Index | rs10938397 | 45,182,527 | g | a | 0.372 | 0.70 | 0.17 | 4.7E-05 | 49.1 | 6.7E-02 | 26,020 | 0.45–0.99 | 0.55–0.99 |
| Lead | rs10938398 | 45,186,139 | a | g | 0.371 | 0.72 | 0.17 | 2.9E-05 | 44.5 | 9.4E-02 | 26,048 | ||||
| SLC39A8* | 4 | Index | rs13107325 | 103,188,709 | t | c | 0.046 | 1.03 | 0.39 | 9.5E-03 | 55.2 | 3.7E-02 | 26,048 | 0.29 | 0.26 |
| Lead | rs63519 | 103,202,914 | a | c | 0.142 | 0.85 | 0.24 | 3.4E-04 | 31.6 | 1.9E-01 | 26,048 | ||||
| TCF7L2* | 10 | Index, Lead | rs7903146 | 114,758,349 | c | t | 0.739 | 0.79 | 0.19 | 3.3E-05 | 63.8 | 1.1E-02 | 26,047 | 1 (same) | 1 (same) |
| KCNQ1* | 11 | Index | rs2237897 | 2,858,546 | t | c | 0.200 | 0.82 | 0.22 | 1.4E-04 | 0 | 9.1E-01 | 26,044 | 0.83 | 0.60 |
| Lead | rs60808706 | 2,857,233 | a | g | 0.217 | 0.90 | 0.21 | 1.6E-05 | 0 | 6.2E-01 | 26,045 | ||||
| MTCH2 | 11 | Index | rs3817334 | 47,650,993 | t | c | 0.397 | 0.51 | 0.17 | 2.5E-03 | 0 | 6.1E-01 | 26,040 | 0.25 | 0.47 |
| Lead | rs11039448 | 47,918,416 | t | g | 0.653 | 0.88 | 0.17 | 4.0E-07 | 0 | 4.7E-01 | 26,048 | ||||
| MAP2K5 | 15 | Index | rs16951275 | 68,077,168 | t | c | 0.531 | 0.37 | 0.17 | 3.4E-02 | 25.4 | 2.4E-01 | 26,046 | <0.01 | <0.01 |
| Lead | rs76616765 | 68,003,745 | g | c | 0.010 | 3.95 | 0.91 | 1.9E-05 | 0 | 6.4E-01 | 24,207 | ||||
| FTO | 16 | Index | rs17817964 | 53,828,066 | t | c | 0.253 | 1.37 | 0.19 | 2.1E-12 | 47.2 | 7.8E-02 | 26,046 | 0.69–0.73 | 0.94–0.98 |
| Lead | rs7187250 | 53,810,546 | a | c | 0.300 | 1.34 | 0.18 | 2.6E-13 | 47.8 | 7.4E-02 | 26,044 | ||||
| MC4R | 18 | Index | rs6567160 | 57,829,135 | c | t | 0.146 | 1.12 | 0.24 | 3.3E-06 | 53 | 4.7E-02 | 26,047 | <0.01–0.79 | <0.01–0.75 |
| Lead | rs72982988 | 57,802,714 | a | g | 0.151 | 1.22 | 0.24 | 2.8E-07 | 16.8 | 3.0E-01 | 26,048 | ||||
Abbreviations: Bp37=base pair Build 37, Chr=chromosome, EA=European American women, Freq=Frequency of A1, HCHS/SOL=Hispanic Community Health Study/Study of Latinos, SNPs=single nucleotide polymorphisms, WHI=Women's Health Initiative.
Note: Starred genes represent fine-mapped loci, which were associated with BMI after the design of the Metabochip in 2009.
Genome-wide significant findings under review (Gong et al., under review at Nature Comm).
For GWAS SNPs a Bonferroni correction for multiple tests reflected the number of independent GWAS signals tested (=0.05/166; Supplemental Table 3). For all other SNPs in the fine-mapped BMI regions, we performed a Bonferroni correction for the number of independent SNPs per region (r2<0.2 in ARIC African-Americans; Supplemental Table 1).
The range of linkage disequilibrium captures any SNP within the fine-mapped loci (Supplemental Table 3) that represents the index BMI signal or secondary signal (described in European descent populations), or race/ethnic population specific marker. HCHS/SOL and WHI European American women were used to represent the linkage disequilibrium of the entire PAGE Hispanic/Latino and European descent samples.
In the entire Asian descent sample (n= 22,466), 29 of 34 available index SNPs were directionally consistent (Supplemental Table 7; pbin=4.76×10⁻⁶). At MAP2K5 we did observe evidence of heterogeneity across the Asian descent studies at one nominally significant SNP (rs182297248) (Supplemental Figure 3). Excluding the Hawaiian sample from the MEC (n=2,586) did diminish the effect heterogeneity and decreased the p-value, but not enough to become Bonferroni significant (Supplemental Table 7). When we included the Hawaiian samples from the MEC we were able to generalize to Asian descent adults at eight BMI loci, including loci that were previously generalized to African descent individuals (POC5, TFAP2B, BDNF-AS1/BDNF), Hispanic/Latinos (MTCH2), or both racial/ethnic groups (GNPDA2, TCF7L2, FTO, MC4R) (Table 3). The lead SNP at MC4R was the index SNP from GWAS of European/trans-ethnic populations (Pei et al. 2014; Speliotes et al. 2010). In addition, we replicated three loci (CDKAL1, KCNQ1, GIPR) that were previously described in only Asian populations using lead SNPs that were in strong LD (r2>0.8) with the previously reported index SNPs (Wen et al. 2012; Wen et al. 2014), or were the Asian index SNP itself (Okada et al. 2012; Wen et al. 2012; Wen et al. 2014). In summary, a total of 11 BMI loci replicated or generalized to our sample of Asian Americans. We noted that MTCH2 and MC4R were no longer Bonferroni significant when we excluded the Hawaiian samples from the MEC in our exploratory analyses (Supplemental Table 7). Thus we carried forward the full Asian American sample in our trans-ethnic meta-analyses, below.
Table 3.
Replication or generalization of 11 of the fine-mapped 36 BMI loci on the MetaboChip to 22,465 Asian Americans
| Index-Lead SNPS r2 range****
|
|||||||||||||||
|---|---|---|---|---|---|---|---|---|---|---|---|---|---|---|---|
| Gene | Chr | Marker Type | rsID | Bp37 | A1 | A2 | Freq | Effect (%) | StdErr (%) | P*** | ISq | HetP | N | In WHI AA | In WHI EA |
| GNPDA2 | 4 | Index | rs10938397 | 45,182,527 | g | a | 0.279 | 0.55 | 0.15 | 2.6E-04 | 24 | 2.3E-01 | 22,386 | 0.69–0.96 | 0.55–0.99 |
| Lead | rs10938398 | 45,186,139 | a | g | 0.281 | 0.57 | 0.15 | 1.6E-04 | 21 | 2.6E-01 | 22,464 | ||||
| Lead (No NA) | rs10938398 | 45,186,139 | a | g | 0.281 | 0.54 | 0.16 | 5.3E-04 | 0 | 4.4E-01 | 19,878 | ||||
| POC5 | 5 | Index | rs2112347 | 75,015,242 | t | g | 0.443 | 0.45 | 0.14 | 9.0E-04 | 10 | 3.5E-01 | 22,464 | 0.62, 0.16 (No NA) | 0.68, 0.64 (No NA) |
| Lead | rs56912706 | 75,037,086 | a | g | 0.517 | 0.57 | 0.13 | 2.2E-05 | 0.4 | 4.3E-01 | 22,464 | ||||
| Lead (No NA) | rs60423072 | 75,006,113 | t | a | 0.825 | 0.74 | 0.19 | 7.1E-05 | 0 | 6.9E-01 | 19,880 | ||||
| CDKAL1*,** | 6 | Index | rs9356744 | 20,685,486 | t | c | 0.595 | 0.86 | 0.14 | 5.3E-10 | 43 | 8.4E-02 | 22,461 | 0.94 | 0.80 |
| Lead | rs9368222 | 20,686,996 | c | a | 0.597 | 0.88 | 0.14 | 2.0E-10 | 39 | 1.1E-01 | 22,393 | ||||
| Lead (No NA) | rs9368222 | 20,686,996 | c | a | 0.603 | 0.90 | 0.14 | 3.7E-10 | 57 | 4.2E-02 | 19,814 | ||||
| TFAP2B | 6 | Index | rs2207139 | 50,845,490 | g | a | 0.210 | 0.29 | 0.17 | 8.5E-02 | 0 | 6.0E-01 | 22,464 | 0.45 | 0.88 |
| Lead | rs2076308 | 50,791,640 | c | g | 0.270 | 0.61 | 0.15 | 6.3E-05 | 0 | 8.0E-01 | 22,461 | ||||
| Lead (No NA) | rs2076308 | 50,791,640 | c | g | 0.276 | 0.63 | 0.16 | 5.6E-05 | 0 | 5.4E-01 | 19,875 | ||||
| TCF7L2* | 10 | Index | rs7903146 | 114,758,349 | c | t | 0.934 | 1.49 | 0.32 | 4.6E-06 | 51 | 4.0E-02 | 22,465 | 0.95 | 0.89 |
| Lead | rs4506565 | 114,756,041 | a | t | 0.931 | 1.50 | 0.32 | 3.7E-06 | 50 | 4.5E-02 | 22,465 | ||||
| Lead (No NA) | rs4506565 | 114,756,041 | a | t | 0.954 | 1.60 | 0.36 | 1.2E-05 | 45 | 1.0E-01 | 19,880 | ||||
| KCNQ1* | 11 | Index | rs2237897 | 2,858,546 | t | c | 0.353 | 0.73 | 0.18 | 3.5E-05 | 62 | 9.9E-03 | 14,181 | 0.83 | 0.83 |
| Lead | rs2299620 | 2,858,295 | t | c | 0.389 | 0.85 | 0.17 | 6.8E-07 | 43 | 9.3E-02 | 14,182 | ||||
| Lead (No NA) | rs2299620 | 2,858,295 | t | c | 0.403 | 0.83 | 0.18 | 3.7E-06 | 59 | 4.7E-02 | 11,604 | ||||
| BDNF-AS1/BDNF | 11 | Index | rs11030104 | 27,684,517 | a | g | 0.566 | 0.10 | 0.14 | 4.5E-01 | 62 | 7.2E-03 | 22,465 | 0.30–0.92 | 0.20–0.98 |
| Lead | rs11030100 | 27,677,586 | g | t | 0.570 | 0.53 | 0.14 | 1.1E-04 | 50 | 4.3E-02 | 22,465 | ||||
| Lead (No NA) | rs11030100 | 27,677,586 | g | t | 0.563 | 0.52 | 0.14 | 3.0E-04 | 68 | 8.1E-03 | 19,879 | ||||
| MTCH2 | 11 | Index | rs3817334 | 47,650,993 | t | c | 0.312 | 0.23 | 0.14 | 1.2E-01 | 0 | 8.7E-01 | 22,447 | 0.03, 0.03 (No NA) | <0.01, 0.01 (No NA) |
| Lead | rs76229852 | 47,258,369 | g | a | 0.958 | 1.48 | 0.34 | 2.0E-05 | 21 | 2.6E-01 | 22,465 | ||||
| Lead (No NA) | rs10838721 | 47,509,017 | a | g | 0.934 | 1.08 | 0.28 | 1.5E-04 | 0 | 6.0E-01 | 19,866 | ||||
| FTO | 16 | Index | rs17817964 | 53,828,066 | t | c | 0.223 | 1.28 | 0.17 | 2.2E-14 | 0 | 4.9E-01 | 22,465 | 0.81–0.98 | 0.95–0.99 |
| Lead | rs3751812 | 53,818,460 | t | g | 0.185 | 1.56 | 0.17 | 5.5E-19 | 0 | 5.4E-01 | 22,463 | ||||
| Lead (No NA) | rs3751812 | 53,818,460 | t | g | 0.180 | 1.52 | 0.18 | 1.4E-16 | 18 | 2.9E-01 | 19,877 | ||||
| MC4R | 18 | Index, Lead | rs6567160 | 57,829,135 | c | t | 0.197 | 0.67 | 0.17 | 9.0E-05 | 0 | 5.8E-01 | 22,461 | <0.01–1 (same) | 0.42 |
| Lead (No NA) | rs6567160 | 57,829,135 | c | t | 0.201 | 0.64 | 0.17 | 2.3E-04 | 0 | 4.4E-01 | 19,875 | ||||
| GIPR* | 19 | Index, Lead | rs11671664 | 46,172,278 | g | a | 0.531 | 0.57 | 0.14 | 4.2E-05 | 0 | 8.4E-01 | 22,460 | 0.02–1 (same) | 0.34–1 (same) |
| Lead (No NA) | rs11671664 | 46,172,278 | g | a | 0.517 | 0.59 | 0.14 | 3.6E-05 | 0 | 6.2E-01 | 19,874 | ||||
Abbreviations: AA=Asian American, Bp37=base pair Build 37, Chr=chromosome, EA=European American women, Freq=Frequency of A1, NA=Native Haiwaiians, SNPs=single nucleotide polymorphisms, WHI=Women's Health Initiative.
Note: Starred genes represent fine-mapped loci, which were associated with BMI after the design of the Metabochip in 2009.
Replication of Asian descent signal (Okada et al 2012, Wen et al. 2012).
For GWAS SNPs a Bonferroni correction for multiple tests reflected the number of independent GWAS signals tested (=0.05/166; Supplemental Table 3). For all other SNPs in the fine-mapped BMI regions, we performed a Bonferroni correction for the number of independent SNPs per region (r2<0.2 in ARIC African-Americans; Supplemental Table 1).
The range of linkage disequilibrium captures any SNP within the fine-mapped loci (Supplemental Table 3) that represents the index BMI signal or secondary signal (described in European descent populations), or race/ethnic population specific marker. WHI Asian and European American women were used to represent the linkage disequilibrium of the entire PAGE Asian and European descent samples.
In the European descent sample (n=17,859), 30 of 35 available index SNPs were directionally consistent (pbin=9.45×10⁻⁶). We observed no significant heterogeneity across studies at either the index or lead SNPs (Supplemental Table 8). Additionally, we replicated associations at nine BMI loci, including five loci that previously had not been associated with any other racial/ethnic group (NEGR1, LINGO2, PRKD1, KCNJ2, KCTD15).
Lastly, in the small sample of 535 American Indian/Alaskan Native women 22 of 35 available BMI index SNPs were directionally consistent (Supplemental Table 9; pbin=4.30×10⁻²). We were able to generalize the lead SNP (rs73012297) at SLC22A3 to American Indian/Alaskan Native women, at a different lead SNP than had generalized to African descent individuals (rs116859471, in ARIC r2<0.01 with top American Indian/Alaskan Native SNP).
Trans-Ethnic Meta-Analyses to Narrow the Putative Interval
Across the ancestries carried forward to trans-ethnic analyses (African, Hispanic/Latino, Asian and European descent), we saw greater variability in risk allele frequencies than effect sizes at index BMI SNPs of the densely-genotyped BMI regions on the MetaboChip (Figure 1). Trans-ethnic fixed-effect meta-analysis in up to 101,979 individuals generalized 29 of 36 BMI loci (Table 4). Most of these loci were already replicated/generalized to at least one racial/ethnic group (Figure 2).
Figure 1.

The comparison of the statistical significance (-log10 of the p-value), effect size (% change in BMI per risk allele) and coded allele frequencies (oriented to the risk allele in the trans-ethnic meta-analysis) across African, Hispanic/Latino, Asian and European ancestries for the lead SNPs (position noted for build 36) within the 36 densely-genotyped BMI regions on the MetaboChip with either locus-specific Bonferroni significant associations (rsid in black) or non-significant (rsid in gray).
Table 4.
Trans-ethnic fixed-effect meta-analysis of 36 BMI loci and Bayesian fine-mapping in up to 101,979 individuals
| FE SNP estimates |
MANTRA Lead SNP estimates
|
Index-Lead SNPS r2 range*****
|
|||||||||||||||
|---|---|---|---|---|---|---|---|---|---|---|---|---|---|---|---|---|---|
| Gene | Chr | FE Marker Type | rsID | Bp37 | Risk Allele | RAF | Effect (%) | StdErr (%) | P*** | Isq | HetP**** | N | log10BF | HetProb | N | In TE sample | In WHI EA |
| NEGR1 | 1 | Index | rs3101336 | 72,751,185 | C | 0.655 | 0.17 | 0.09 | 6.8E-02 | 69.4 | 2.0E-02 | 101,969 | 0.18 | 0.30 | |||
| Lead | rs1460939 | 72,861,567 | T | 0.868 | 0.47 | 0.13 | 4.3E-04 | 0.6 | 3.9E-01 | 101,976 | 2.3 | 0.022 | 101,976 | ||||
| TNNI3K | 1 | Index, Lead | rs12566985 | 75,002,193 | G | 0.719 | 0.42 | 0.11 | 2.8E-04 | 0 | 5.2E-01 | 75,627 | 1 (same), <0.01 (MANTRA) | 1 (same), <0.01 (MANTRA) | |||
| – | rs76514352 | 75,011,423 | 2.1 | 0.107 | 51,874 | ||||||||||||
| SEC16B | 1 | Index, Lead | rs543874 | 177,889,480 | G | 0.213 | 0.90 | 0.10 | 3.5E-21 | 72.9 | 1.1E-02 | 101,972 | 19.1 | 0.252 | 101,972 | 0.62–1 (same) | 0.96–1 (same) |
| LYPLAL1** | 1 | Index, Lead | rs2820436 | 219,640,680 | A | 0.388 | 0.50 | 0.09 | 3.2E-08 | 0 | 4.7E-01 | 93,721 | 6.0 | 0.006 | 93,721 | 1 (same) | 1 (same) |
| TMEM18 | 2 | Index | rs13021737 | 632,348 | G | 0.873 | 1.05 | 0.12 | 3.0E-18 | 42 | 1.6E-01 | 101,832 | 0.61–0.92 | 0.95 | |||
| Lead | rs6731872 | 624,205 | G | 0.877 | 1.09 | 0.12 | 8.3E-19 | 45.3 | 1.4E-01 | 101,832 | 16.6 | 0.037 | 101,832 | ||||
| BRE* | 2 | Index | rs116612809 | 28,301,171 | G | 0.088 | 1.05 | 0.23 | 8.8E-06 | 87.9 | 2.6E-04 | 68,016 | 5.1 | 0.937 | 68,016 | 0.07 | <0.01 |
| Lead | rs58154175 | 28,604,833 | T | 0.315 | 0.53 | 0.12 | 8.8E-06 | 12.6 | 3.3E-01 | 93,669 | |||||||
| COBLL1* | 2 | Index, Lead | rs10184004 | 165,508,389 | T | 0.452 | 0.52 | 0.10 | 1.3E-07 | 0 | 5.5E-01 | 93,726 | 5.6 | 0.011 | 93,726 | 1 (same) | 1 (same) |
| IRS1* | 2 | Index, Lead | rs2176040 | 227092802 | A | 0.275 | 0.50 | 0.10 | 4.0E-07 | 0 | 5.5E-01 | 93,732 | 5.1 | 0.006 | 93,732 | 1 (same) | 1 (same) |
| CADM2 | 3 | Index | rs13078960 | 85,807,590 | G | 0.857 | 0.00 | 0.15 | 9.8E-01 | 0 | 8.2E-01 | 101,976 | <0.01 | – | |||
| Lead | rs115299727 | 85,843,586 | G | 0.009 | 2.91 | 0.79 | 2.6E-04 | 0 | 1.0E+00 | 51,162 | 2.5 | 0.049 | 51,162 | ||||
| IGF2BP2** | 3 | Index, Lead | rs11927381 | 185,508,591 | T | 0.563 | 0.49 | 0.09 | 1.3E-07 | 0 | 8.4E-01 | 93,626 | 1 (same), 0.81 (MANTRA) | 1 (same), 0.99 (MANTRA) | |||
| – | rs4481184 | 185,505,787 | 5.6 | 0.005 | 93,647 | ||||||||||||
| ETV5 | 3 | Index | rs1516725 | 185,824,004 | C | 0.864 | 0.69 | 0.13 | 1.0E-07 | 0 | 8.7E-01 | 101,811 | 0.34 | 0.57 | |||
| Lead | rs7647305 | 185,834,290 | C | 0.720 | 0.59 | 0.10 | 3.7E-09 | 0 | 5.2E-01 | 101,974 | 7.0 | 0.017 | 101,974 | ||||
| GNPDA2 | 4 | Index | rs10938397 | 45,182,527 | G | 0.325 | 0.60 | 0.08 | 7.3E-13 | 1.7 | 3.8E-01 | 101,782 | 0.38–0.98 | 0.55–1.00 | |||
| Lead | rs12507026 | 45,181,334 | T | 0.325 | 0.61 | 0.08 | 5.3E-13 | 6.7 | 3.6E-01 | 101,974 | 10.8 | 0.011 | 101,974 | ||||
| SLC39A8* | 4 | Index, Lead | rs13107325 | 103,188,709 | T | 0.053 | 1.05 | 0.25 | 3.4E-05 | 0 | 8.7E-01 | 79,090 | 3.2 | 0.015 | 79,090 | 1 (same) | 1 (same) |
| POC5 | 5 | Index | rs2112347 | 75,015,242 | T | 0.531 | 0.28 | 0.08 | 4.3E-04 | 3.3 | 3.8E-01 | 101,972 | 0.17 | 0.57 | |||
| Lead | rs60493905 | 75,038,426 | C | 0.630 | 0.48 | 0.09 | 1.9E-08 | 0 | 7.8E-01 | 101,968 | 6.4 | 0.008 | 101,968 | ||||
| CDKAL1* | 6 | Index | rs9356744 | 20,685,486 | T | 0.562 | 0.42 | 0.08 | 2.6E-07 | 81.2 | 1.2E-03 | 101,966 | 0.24 | 0.48 | |||
| Lead | rs67131976 | 20,686,878 | C | 0.729 | 0.60 | 0.10 | 4.0E-10 | 61.6 | 5.0E-02 | 101,973 | 8.1 | 0.092 | 101,973 | ||||
| TFAP2B | 6 | Index | rs2207139 | 50,845,490 | G | 0.211 | 0.41 | 0.10 | 1.0E-04 | 2 | 3.8E-01 | 101,973 | 0.33 | 0.47 | |||
| Lead | rs2744475 | 50,784,880 | G | 0.352 | 0.56 | 0.08 | 9.9E-12 | 39.1 | 1.8E-01 | 101,763 | 9.7 | 0.015 | 101,763 | ||||
| SLC22A3* | 6 | Index | rs3127574 | 160,791,370 | C | 0.497 | 0.13 | 0.08 | 1.2E-01 | 51.7 | 1.0E-01 | 93,727 | 0.01, 0.03 (MANTRA) | <0.01, <0.01 (MANTRA) | |||
| Lead | rs78739765 | 160,868,121 | G | 0.979 | 1.34 | 0.43 | 1.9E-03 | 0 | 6.4E-01 | 72,083 | |||||||
| - | rs73589298 | 160,804,090 | 1.9 | 0.952 | 57,992 | ||||||||||||
| LINGO2 | 9 | Index | rs10968576 | 28,414,339 | G | 0.217 | 0.52 | 0.10 | 1.1E-07 | 0 | 5.9E-01 | 101,976 | 0.95 | 1.00 | |||
| Lead | rs17770336 | 28,414,625 | T | 0.223 | 0.52 | 0.10 | 9.6E-08 | 0 | 6.3E-01 | 101,930 | 5.8 | 0.013 | 101,930 | ||||
| NT5C2* | 10 | Index | rs11191560 | 104,869,038 | C | 0.204 | 0.54 | 0.11 | 1.8E-06 | 0 | 7.8E-01 | 101,966 | 0.86 | 0.95 | |||
| Lead | rs11191447 | 104,652,323 | T | 0.193 | 0.56 | 0.11 | 3.8E-07 | 0 | 8.4E-01 | 101,919 | 5.2 | 0.008 | 101,919 | ||||
| TCF7L2* | 10 | Index, Lead | rs7903146 | 114,758,349 | C | 0.739 | 0.75 | 0.10 | 2.2E-13 | 54 | 8.9E-02 | 101,975 | 11.2 | 0.063 | 101,975 | 1 (same) | 1 (same) |
| KCNQ1* | 11 | Index | rs2237897 | 2,858,546 | T | 0.237 | 0.66 | 0.12 | 3.3E-08 | 0 | 4.0E-01 | 93,516 | 0.76 | 0.97 | |||
| Lead | rs2237896 | 2,858,440 | A | 0.272 | 0.73 | 0.13 | 3.0E-08 | 0 | 4.6E-01 | 93,196 | 6.2 | 0.014 | 93,196 | ||||
| STK33/TRIM66 | 11 | Index | rs4256980 | 8,673,939 | G | 0.509 | 0.22 | 0.08 | 5.2E-03 | 0 | 5.4E-01 | 101,492 | 0.80 | – | |||
| Lead | rs76876925 | 8,650,183 | G | 0.512 | 0.36 | 0.10 | 1.4E-04 | 0 | 8.7E-01 | 72,292 | 2.7 | 0.008 | 72,292 | ||||
| KCNJ11* | 11 | Index | rs1557765 | 17,403,639 | T | 0.686 | 0.31 | 0.10 | 1.5E-03 | 0 | 5.0E-01 | 93,268 | 0.08–0.09, 0.20–0.21 (MANTRA) | 0.26–0.27, 0.39–0.41 (MANTRA) | |||
| Lead | rs7949405 | 17,085,192 | A | 0.568 | 0.32 | 0.09 | 4.8E-04 | 0 | 5.8E-01 | 86,446 | |||||||
| – | rs214933 | 17,194,584 | 2.2 | 0.005 | 93,270 | ||||||||||||
| BDNF-AS1/BDNF | 11 | Index | rs11030104 | 27,684,517 | A | 0.694 | 0.40 | 0.10 | 7.3E-05 | 79.5 | 2.2E-03 | 101,516 | 0.28–0.40 | 0.13–0.35 | |||
| Lead | rs1519480 | 27,675,712 | C | 0.444 | 0.59 | 0.09 | 1.2E-11 | 44.3 | 1.5E-01 | 101,510 | 9.5 | 0.006 | 101,510 | ||||
| MTCH2 | 11 | Index | rs3817334 | 47,650,993 | T | 0.338 | 0.28 | 0.08 | 6.3E-04 | 0 | 5.0E-01 | 101,940 | 0.03 | 0.09 | |||
| Lead | rs896817 | 47,394,305 | C | 0.713 | 0.46 | 0.09 | 4.3E-07 | 0 | 7.9E-01 | 101,965 | 5.1 | 0.006 | 101,965 | ||||
| FAIM2 | 12 | Index, Lead | rs7138803 | 50,247,468 | A | 0.285 | 0.35 | 0.09 | 9.0E-05 | 0 | 4.8E-01 | 101,969 | 2.9 | 0.003 | 101,969 | 1 (same) | 1 (same) |
| BRAP* | 12 | Index | rs11065987 | 112,072,424 | A | 0.716 | 0.21 | 0.12 | 8.8E-02 | 17.8 | 3.0E-01 | 93,730 | <0.01–0.06 | 0.17–0.18 | |||
| Lead | rs10774631 | 112,023,001 | A | 0.219 | 0.25 | 0.10 | 1.2E-02 | 46.6 | 1.3E-01 | 93,498 | 0.9 | 0.024 | 93,498 | ||||
| PRKD1 | 14 | Index | rs11847697 | 30,515,112 | T | 0.258 | 0.01 | 0.14 | 9.3E-01 | 0 | 9.5E-01 | 93,490 | 0.02 | 0.04 | |||
| Lead | rs1957347 | 30,483,129 | T | 0.303 | 0.27 | 0.09 | 3.4E-03 | 0 | 5.4E-01 | 101,505 | 1.4 | 0.016 | 101,505 | ||||
| MAP2K5 | 15 | Index | rs16951275 | 68,077,168 | T | 0.542 | 0.35 | 0.08 | 2.5E-05 | 27.3 | 2.5E-01 | 101,972 | 0.56–1 (same) | 0.54–1 (same) | |||
| Lead | rs4776970 | 68,080,886 | A | 0.422 | 0.38 | 0.08 | 6.1E-06 | 0 | 9.0E-01 | 101,972 | 4.1 | 0.004 | 101,972 | ||||
| GPRC5B | 16 | Index | rs12446632 | 19,935,389 | G | 0.02, 0.03 (MANTRA) | 0.03, 0.05 (MANTRA) | ||||||||||
| Lead | rs67501351 | 20,006,745 | G | 0.372 | 0.36 | 0.08 | 1.5E-05 | 28.8 | 2.4E-01 | 101,506 | |||||||
| - | rs28461566 | 19,998,311 | 3.5 | 0.021 | 101,498 | ||||||||||||
| ATP2A1 | 16 | Index | rs2650492 | 28,333,411 | A | 0.146 | 0.54 | 0.14 | 9.5E-05 | 26.1 | 2.5E-01 | 99,770 | 0.92 | 0.38–1.00 | |||
| Lead | rs8061590 | 28,895,130 | G | 0.307 | 0.52 | 0.10 | 2.9E-07 | 0 | 3.7E-01 | 84,081 | 5.2 | 0.011 | 84,081 | ||||
| FTO | 16 | Index | rs17817964 | 53,828,066 | T | 0.256 | 1.23 | 0.10 | 7.1E-36 | 0 | 7.1E-01 | 101,976 | 0.94–0.95 | 0.95–0.99 | |||
| Lead | rs3751812 | 53,818,460 | T | 0.242 | 1.34 | 0.10 | 2.3E-42 | 15.6 | 3.1E-01 | 101,974 | 39.9 | 0.010 | 101,974 | ||||
| KCNJ2* | 17 | Index | rs312750 | 68,343,539 | A | 0.638 | 0.09 | 0.09 | 3.4E-01 | 0 | 8.9E-01 | 93,734 | <0.01 | <0.01 | |||
| Lead | rs72868947 | 68,494,065 | T | 0.007 | 2.60 | 0.78 | 9.2E-04 | 52.5 | 1.2E-01 | 74,163 | 1.7 | 0.105 | 74,163 | ||||
| MC4R | 18 | Index, Lead | rs6567160 | 57,829,135 | C | 0.193 | 0.89 | 0.10 | 9.4E-19 | 13.8 | 3.2E-01 | 101,966 | 16.2 | 0.011 | 101,966 | 0.01–1 (same) | <0.01–1 (same) |
| KCTD15 | 19 | Index | rs29941 | 34,309,532 | G | 0.562 | 0.26 | 0.09 | 3.9E-03 | 0 | 6.2E-01 | 101,951 | 0.49 | 0.60 | |||
| Lead | rs368794 | 34,320,452 | A | 0.537 | 0.32 | 0.08 | 1.4E-04 | 0 | 4.0E-01 | 99,796 | 2.7 | 0.012 | 99,796 | ||||
| GIPR* | 19 | Index | rs11671664 | 46,172,278 | G | 0.688 | 0.40 | 0.11 | 1.5E-04 | 79.9 | 1.9E-03 | 101,500 | 0.09–0.88, 0.09–0.88 (MANTRA) | 0.42–0.90, 0.42–0.90 (MANTRA) | |||
| Lead | rs1800437 | 46,181,392 | G | 0.817 | 0.64 | 0.11 | 1.6E-09 | 0 | 8.2E-01 | 101,488 | |||||||
| - | rs11672660 | 46,180,184 | 7.0 | 0.007 | 101,501 | ||||||||||||
Abbreviations: Bp37=base pair Build 37, BF=Bayes Factor, Chr=chromosome, EA=European American women, FE=Fixed-Effect, HetProb=The posterior probability of heterogeneity, MANTRA=Meta-ANalysis of Trans-Ethnic Association studies, RAF=Risk Allele Frequency, RAF=risk allele frequency, SNPs=single nucleotide polymorphisms, TE=Transethnic.
Note: Starred genes represent fine-mapped loci, which were associated with BMI after the design of the Metabochip in 2009.
Genome-wide significant findings under review (Gong et al., under review at Nature Comm).
For GWAS SNPs a Bonferroni correction for multiple tests reflected the number of independent GWAS signals tested (=0.05/166; Supplemental Table 3). For all other SNPs in the fine-mapped BMI regions, we performed a Bonferroni correction for the number of independent SNPs per region (r2<0.2 in ARIC African-Americans; Supplemental Table 1).
Locus-specific Bonferroni significant heterogeneity p-values shown in italics.
The range of linkage disequilibrium captures any SNP within the fine-mapped loci (Supplemental Table 3) that represents the index BMI signal or secondary signal (described in European descent populations), or race/ethnic population specific marker. ARIC, HCHS/SOL, and WHI samples were used to represent the linkage disequilibrium for the PAGE trans-ethnic and European descent samples.
Figure 2.

Venn diagram of overlap in significant lead SNP findings at each of 36 densely-genotyped BMI loci across the racial/ethnic populations [African (AfA), Hispanic/Latino (HA), Asian (AsA), European (EA), American Indian/Alaskan Native descent (NA, in parentheses)] and in the trans-ethnic fixed-effect meta-analysis of African, Hispanic/Latino, Asian and European descent adults (noted with asterisk).
The Bayesian trans-ethnic meta-analysis did not reveal additional loci strongly associated with BMI, as defined as log10 Bayes Factor>5 (Table 4). However, after accounting for ancestral heterogeneity 22 loci had strong evidence in favor of association and only three of these were noted to have a different lead SNP than seen in the fixed-effect analysis. For example, at BRE the Bayesian approach resulted in a top/index SNP, which had significant heterogeneity across the African descent studies (Table 1) and across the racial/ethnic groups (Table 4). Whereas, the fixed-effect meta-analysis resulted in a lead SNP that was located ~300kb towards FOSL2 (Supplemental Figure 4). The other two loci (IGF2BP2, GIPR) with top significant SNPs that differed between the two trans-ethnic approaches appeared to be capturing the same signal across the range of LD (e.g. African to European descent) represented in our trans-ethnic meta-analysis.
Using the physical location of the top fixed-effect racial/ethnic specific results, we compared our results to the base pair range defined by the bounds of each MetaboChip densely-genotyped region (Supplemental Table 1) and calculated a percentage reduction of our putative interval of interest (Table 5). Across the 29 loci with significant trans-ethnic fixed-effect estimates the reduction in base pairs and percentage narrowed ranged from 14,099 (37% of region) to 930,200 (72%).
Table 5.
Trans-ethnic meta-analyses to narrow the putative interval of interest at 36 BMI loci
| Stratified Lead FE SNPS
|
Transethnic Lead SNPs
|
MANTRA 99% credible
interval |
|||||||||
|---|---|---|---|---|---|---|---|---|---|---|---|
| Gene | Range (Bp37) | Reduction (Bp37) % | Reduction | FE rsID | FE Bp37 | MANTRA rsID | MANTRABp37 | N SNPs | Range (Bp37) | Reduction (Bp37) | % Reduction |
| NEGR1 | 290,988 | 154,230 | 35 | rs1460939 | 72,861,567 | rs1460939 | 72,861,567 | 791 | 445,217 | 1 | 0 |
| TNNI3K | 101,051 | 16,107 | 14 | rs12566985 | 75,002,193 | rs76514352 | 75,011,423 | 224 | 117,158 | 0 | 0 |
| SEC16B | 16,575 | 166,174 | 91 | rs543874 | 177,889,480 | rs543874 | 177,889,480 | 1 | 0 | 182,749 | 100 |
| LYPLAL1** | 167,016 | 107,141 | 39 | rs2820436 | 219,640,680 | rs2820436 | 219,640,680 | 30 | 128,966 | 145,191 | 53 |
| TMEM18 | 43,013 | 205,740 | 83 | rs6731872 | 624,205 | rs6731872 | 624,205 | 21 | 16,729 | 232,024 | 93 |
| BRE* | 353,982 | 930,200 | 72 | rs58154175 | 28,604,833 | rs116612809 | 28,301,171 | 26 | 879,946 | 404,236 | 31 |
| COBLL1* | 126,262 | 106,608 | 46 | rs10184004 | 165,508,389 | rs10184004 | 165,508,389 | 15 | 56,403 | 176,467 | 76 |
| IRS1* | 54,967 | 128,106 | 70 | rs2176040 | 227,092,802 | rs2176040 | 227,092,802 | 32 | 87,419 | 95,654 | 52 |
| CADM2 | 179,274 | 219,755 | 55 | rs115299727 | 85,843,586 | rs115299727 | 85,843,586 | 445 | 398,619 | 410 | 0 |
| IGF2BP2** | 204,453 | 53,206 | 21 | rs11927381 | 185,508,591 | rs4481184 | 185,505,787 | 13 | 38,588 | 219,071 | 85 |
| ETV5 | 48,250 | 67,301 | 58 | rs7647305 | 185,834,290 | rs7647305 | 185,834,290 | 12 | 62,861 | 52,690 | 46 |
| GNPDA2 | 22,002 | 66,280 | 75 | rs12507026 | 45,181,334 | rs12507026 | 45,181,334 | 5 | 10,448 | 77,834 | 88 |
| SLC39A8* | 78,859 | 17,861 | 18 | rs13107325 | 103,188,709 | rs13107325 | 103,188,709 | 141 | 94,766 | 1,954 | 2 |
| POC5 | 260,885 | 299,794 | 53 | rs60493905 | 75,038,426 | rs60493905 | 75,038,426 | 29 | 372,409 | 188,270 | 34 |
| CDKAL1* | 221,440 | 576,581 | 72 | rs67131976 | 20,686,878 | rs67131976 | 20,686,878 | 6 | 33,042 | 764,979 | 96 |
| TFAP2B | 272,303 | 293,963 | 52 | rs2744475 | 50,784,880 | rs2744475 | 50,784,880 | 1 | 0 | 566,266 | 100 |
| SLC22A3* | 238,014 | 32,672 | 12 | rs78739765 | 160,868,121 | rs73589298 | 160,804,090 | 720 | 270,605 | 81 | 0 |
| LINGO2 | 28,519 | 67,137 | 70 | rs17770336 | 28,414,625 | rs17770336 | 28,414,625 | 4 | 3,722 | 91,934 | 96 |
| NT5C2* | 418,829 | 362,996 | 46 | rs11191447 | 104,652,323 | rs11191447 | 104,652,323 | 22 | 261,330 | 520,495 | 67 |
| TCF7L2* | 52,861 | 23,298 | 31 | rs7903146 | 114,758,349 | rs7903146 | 114,758,349 | 2 | 4,261 | 71,898 | 94 |
| KCNQ1* | 331,607 | 167,414 | 34 | rs2237896 | 2,858,440 | rs2237896 | 2,858,440 | 7 | 18,885 | 480,136 | 96 |
| STK33/TRIM66 | 190,703 | 122,255 | 39 | rs76876925 | 8,650,183 | rs76876925 | 8,650,183 | 368 | 312,450 | 508 | 0 |
| KCNJ11* | 235,612 | 149,042 | 39 | rs7949405 | 17,085,192 | rs214933 | 17,194,584 | 295 | 383,901 | 753 | 0 |
| BDNF-AS1/BDNF | 71,243 | 225,776 | 76 | rs1519480 | 27,675,712 | rs1519480 | 27,675,712 | 2 | 1,874 | 295,145 | 99 |
| MTCH2 | 753,051 | 420,187 | 36 | rs896817 | 47,394,305 | rs896817 | 47,394,305 | 88 | 543,139 | 630,099 | 54 |
| FAIM2 | 42,290 | 79,577 | 65 | rs7138803 | 50,247,468 | rs7138803 | 50,247,468 | 152 | 121,090 | 777 | 1 |
| BRAP* | 1,332,934 | 582,773 | 30 | rs10774631 | 112,023,001 | rs10774631 | 112,023,001 | 93 | 1,889,612 | 26,095 | 1 |
| PRKD1 | 30,716 | 76,520 | 71 | rs1957347 | 30,483,129 | rs1957347 | 30,483,129 | 168 | 106,079 | 1,157 | 1 |
| MAP2K5 | 408,882 | 156,440 | 28 | rs4776970 | 68,080,886 | rs4776970 | 68,080,886 | 122 | 493,712 | 71,610 | 13 |
| GPRC5B | 118,750 | 196,458 | 62 | rs67501351 | 20,006,745 | rs28461566 | 19,998,311 | 155 | 315,118 | 90 | 0 |
| ATP2A1 | 431,490 | 262,983 | 38 | rs8061590 | 28,895,130 | rs8061590 | 28,895,130 | 74 | 413,702 | 280,771 | 40 |
| FTO | 15,237 | 631,041 | 98 | rs3751812 | 53,818,460 | rs3751812 | 53,818,460 | 6 | 20,171 | 626,107 | 97 |
| KCNJ2* | 149,440 | 107,131 | 42 | rs72868947 | 68,494,065 | rs72868947 | 68,494,065 | 790 | 256,456 | 115 | 0 |
| MC4R | 73,513 | 293,976 | 80 | rs6567160 | 57,829,135 | rs6567160 | 57,829,135 | 1 | 0 | 367,489 | 100 |
| KCTD15 | 24,124 | 14,099 | 37 | rs368794 | 34,320,452 | rs368794 | 34,320,452 | 70 | 38,223 | 0 | 0 |
| GIPR* | 197,022 | 73,189 | 27 | rs1800437 | 46,181,392 | rs11672660 | 46,180,184 | 3 | 21,988 | 248,223 | 92 |
Abbreviations: Bp37=base pair Build 37, Chr=chromosome, FE=Fixed-Effect, MANTRA=Meta-ANalysis of Trans-Ethnic Association studies, SNPs=single nucleotide polymorphisms.
Note: Starred genes represent fine-mapped loci, which were associated with BMI after the design of the Metabochip in 2009.
Genome-wide significant findings under review (Gong et al., under review at Nature Comm).
Using a Bayesian approach to account for ancestral heterogeneity, we used the physical bounds of the 99% credible set to reduce the putative interval by 52,690 base pairs (bp) at ETV5 (46% of region) to 764,979 bp at CDKAL1 (96% of region; Table 5). Figures 3–4 illustrate the trans-ethnic fixed-effect estimates of 12 loci where the Bayesian approach narrowed the putative interval to ≤12 SNPs. The remaining 24 fine-mapped regions are plotted in the Supplement (Supplemental Figures 4–7). At three of these loci (SEC16B, TFAP2B, MC4R) the 99% credible set reduced the interval of interest by between from 182,749–566,266 bp to a single SNP (Figure 3).
Figure 3.
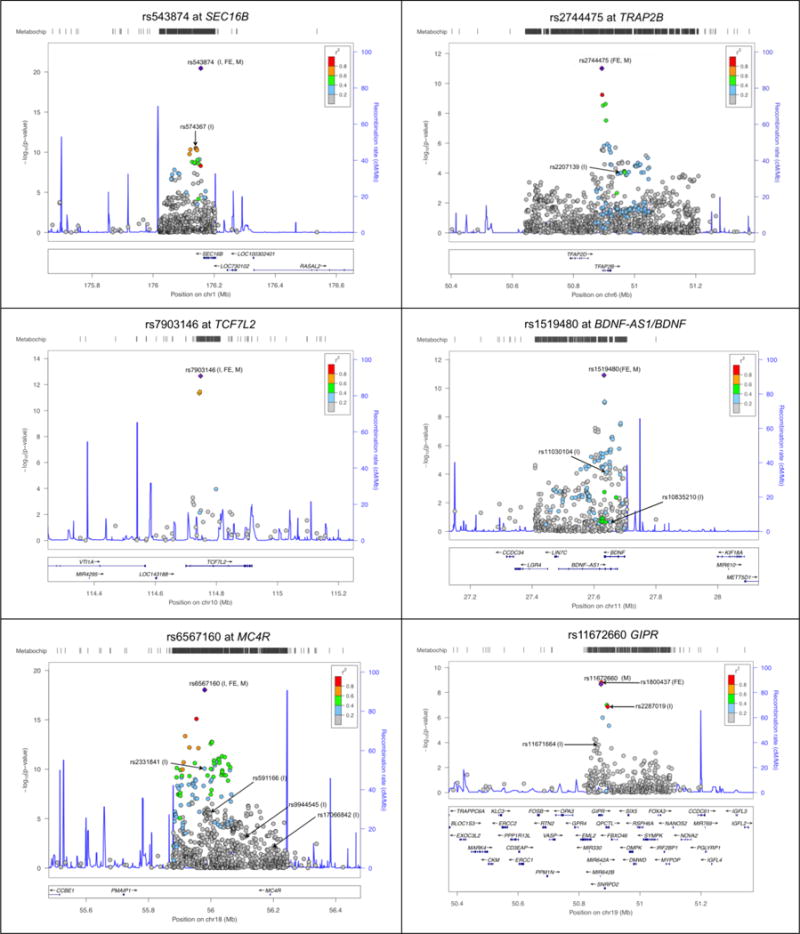
Regional plots of trans-ethnic fixed-effect estimates (I, index SNPs; FE, top finding) and Bayesian fine-mapping of 6 significant BMI loci to select the SNP with the highest posterior probability (M, shown in purple and reference for trans-ethnic linkage disequilibrium) and narrow the putative interval of interest to <4 SNPs (SNPs in 99% credible interval shown in diamonds) in a sample of up to 101,979 individuals
Figure 4.

Regional plots of trans-ethnic fixed-effect estimates (I, index SNPs in black; FE, top finding) and Bayesian fine-mapping of 6 significant BMI loci to select the SNP with the highest posterior probability (M, shown in purple and reference for trans-ethnic linkage disequilibrium) and narrow the putative interval of interest to 4–12 SNPs (SNPs in 99% credible interval shown in diamonds) in a sample of up to 101,979 individuals
Established and Novel Secondary Signals at Known Loci
We first performed conditional analyses of the trans-ethnic fixed-effect estimates in the 36 densely-genotyped BMI loci after adjusting for the top trans-ethnic fixed-effect SNP. Then we entered these potential independent signals and index SNPs outside of the densely-mapped BMI regions into an approximate joint analysis, keeping only the significant associations in the final joint model. As previously noted in European descent populations (Locke et al. 2015), we observed that the SBK1 association (index SNP rs2650492, pc =3.5×10⁻²) was dependent on our lead trans-ethnic SNP at ATP2A1 (rs8061590), and the presence of Bonferroni-significant secondary signals at BDNF-AS1 and MC4R (Table 6) in weak LD with our top trans-ethnic findings (r2<0.3). Interestingly, we noted that rs2331841 at MC4R, originally reported in Asian populations (Okada et al. 2012), was also nominally independent of our top finding in the region (pc =4.10×10⁻²). Additionally, we confirmed the observation that our association signal located between GPRC5B and GPR139 (lead SNP, rs67501351; joint p, pj =7.70×10⁻¹⁹) was independent of the signal at GP2 (index SNP, rs11074446; pj =1.69×10⁻⁷).
Table 6.
Single variant and joint trans-ethnic fixed-effect estimates for the Bonferroni significant joint signals at the 36 densely-genotyped BMI loci, after accounting for index SNPs (r2<0.9 with each other, included in the trans-ethnic analyses) outside of these regions
| Top SNPS (single variant model)
|
Top SNPS (joint model)
|
GWAS-top joint SNPS |
|||||||||||||||
|---|---|---|---|---|---|---|---|---|---|---|---|---|---|---|---|---|---|
| Gene | rsID | A1 | A2 | Freq | Effect (%) | StdErr (%) | P*** | Isq | HetP**** | Actual n | Aprrox Freq | Effect j (%) | StdErr j (%) | Pj*** | Effective n % | VarExp | r2 range**** in transethnic sample |
| TNNI3K | rs12566985 | g | a | 0.719 | 0.42 | 0.11 | 2.8E-04 | 0 | 5.2E-01 | 75,627 | 0.697 | 0.42 | 0.11 | 1.4E-04 | 85,877 | 0.0007 | 1 (same) |
| SEC16B | rs543874 | g | a | 0.213 | 0.90 | 0.10 | 3.5E-21 | 72.9 | 1.1E-02 | 101,972 | 0.217 | 0.90 | 0.10 | 2.3E-19 | 125,180 | 0.0028 | 0.62–1 (same) |
| LYPLAL1** | rs2820436 | a | c | 0.388 | 0.50 | 0.09 | 3.2E-08 | 0 | 4.7E-01 | 93,721 | 0.387 | 0.50 | 0.09 | 3.5E-08 | 109,170 | 0.0012 | 1 (same) |
| LYPLAL1** | rs4445477 | a | g | 0.621 | 0.38 | 0.10 | 2.5E-04 | 0 | 6.3E-01 | 89,078 | 0.639 | 0.37 | 0.10 | 1.8E-04 | 89,156 | 0.0006 | <0.01 |
| TMEM18 | rs6731872 | g | t | 0.877 | 1.09 | 0.12 | 8.3E-19 | 45.3 | 1.4E-01 | 101,832 | 0.877 | 1.09 | 0.12 | 2.3E-19 | 135,002 | 0.0025 | 0.61–0.92 |
| COBLL1* | rs10184004 | t | c | 0.452 | 0.52 | 0.10 | 1.3E-07 | 0 | 5.5E-01 | 93,726 | 0.444 | 0.53 | 0.11 | 4.0E-07 | 84,752 | 0.0014 | 1 (same) |
| COBLL1* | rs17244444 | g | a | 0.911 | 0.41 | 0.16 | 1.3E-02 | 58.6 | 6.4E-02 | 93,731 | 0.927 | 0.64 | 0.17 | 1.0E-04 | 101,259 | 0.0006 | 0.07 |
| IRS1* | rs2176040 | a | g | 0.275 | 0.50 | 0.10 | 4.0E-07 | 0 | 5.5E-01 | 93,732 | 0.259 | 0.75 | 0.11 | 5.2E-11 | 105,388 | 0.0021 | 1 (same) |
| IRS1* | rs2673147 | c | g | 0.466 | 0.15 | 0.09 | 9.9E-02 | 0 | 8.6E-01 | 93,727 | 0.418 | 0.47 | 0.10 | 4.9E-06 | 104,177 | 0.0011 | 0.23 |
| IGF2BP2** | rs11927381 | t | c | 0.563 | 0.49 | 0.09 | 1.3E-07 | 0 | 8.4E-01 | 93,626 | 0.523 | 0.38 | 0.09 | 4.6E-05 | 105,325 | 0.0007 | 1 (same) |
| ETV5 | rs7647305 | c | t | 0.720 | 0.59 | 0.10 | 3.7E-09 | 0 | 5.2E-01 | 101,974 | 0.744 | 0.48 | 0.10 | 3.1E-06 | 104,120 | 0.0009 | 0.34 |
| GNPDA2 | rs12507026 | t | a | 0.325 | 0.61 | 0.08 | 5.3E-13 | 6.7 | 3.6E-01 | 101,974 | 0.317 | 0.61 | 0.08 | 2.5E-14 | 149,522 | 0.0016 | 0.38–0.98 |
| SLC39A8* | rs28392891 | a | t | 0.891 | 0.52 | 0.15 | 4.8E-04 | 62.3 | 4.7E-02 | 95,585 | 0.913 | 0.51 | 0.15 | 6.9E-04 | 95,771 | 0.0004 | <0.01 |
| SLC39A8* | rs13107325 | t | c | 0.053 | 1.05 | 0.25 | 3.4E-05 | 0 | 8.7E-01 | 79,090 | 0.030 | 1.03 | 0.25 | 4.2E-05 | 67,039 | 0.0006 | 1 (same) |
| POC5 | rs60493905 | c | t | 0.630 | 0.48 | 0.09 | 1.9E-08 | 0 | 7.8E-01 | 101,968 | 0.606 | 0.48 | 0.09 | 9.7E-08 | 111,182 | 0.0011 | 0.17 |
| CDKAL1* | rs67131976 | c | t | 0.729 | 0.60 | 0.10 | 4.0E-10 | 61.6 | 5.0E-02 | 101,973 | 0.798 | 0.60 | 0.10 | 2.0E-09 | 106,176 | 0.0012 | 0.24 |
| TFAP2B | rs2744475 | g | c | 0.352 | 0.56 | 0.08 | 9.9E-12 | 39.1 | 1.8E-01 | 101,763 | 0.349 | 0.54 | 0.08 | 2.1E-11 | 143,714 | 0.0013 | 0.33 |
| TFAP2B | rs2397016 | a | g | 0.806 | 0.76 | 0.17 | 6.8E-06 | 39.6 | 1.9E-01 | 79,510 | 0.909 | 0.68 | 0.17 | 6.8E-05 | 46,410 | 0.0008 | 0.04 |
| LINGO2 | rs17770336 | t | c | 0.223 | 0.52 | 0.10 | 9.6E-08 | 0 | 6.3E-01 | 101,930 | 0.217 | 0.52 | 0.10 | 2.0E-07 | 121,118 | 0.0009 | 0.95 |
| NT5C2* | rs11191447 | t | c | 0.193 | 0.56 | 0.11 | 3.8E-07 | 0 | 8.4E-01 | 101,919 | 0.127 | 0.56 | 0.11 | 3.6E-07 | 111,260 | 0.0007 | 0.86 |
| TCF7L2* | rs7903146 | c | t | 0.739 | 0.75 | 0.10 | 2.2E-13 | 54 | 8.9E-02 | 101,975 | 0.765 | 0.75 | 0.10 | 6.5E-14 | 108,781 | 0.0020 | 1 (same) |
| KCNQ1* | rs2237896 | a | g | 0.272 | 0.73 | 0.13 | 3.0E-08 | 0 | 4.6E-01 | 93,196 | 0.133 | 0.82 | 0.13 | 5.5E-10 | 62,758 | 0.0015 | 0.76 |
| STK33 | rs76633799 | a | g | 0.037 | 1.38 | 0.37 | 2.6E-04 | 0 | 7.1E-01 | 57,988 | 0.017 | 1.45 | 0.37 | 1.1E-04 | 42,922 | 0.0007 | <0.01 |
| TRIM66 | rs76876925 | g | a | 0.512 | 0.36 | 0.10 | 1.4E-04 | 0 | 8.7E-01 | 72,292 | 0.556 | 0.41 | 0.10 | 5.7E-05 | 84,029 | 0.0008 | 0.80 |
| BDNF-AS1 | rs1519480 | c | t | 0.444 | 0.59 | 0.09 | 1.2E-11 | 44.3 | 1.5E-01 | 101,510 | 0.513 | 0.64 | 0.09 | 1.6E-12 | 104,967 | 0.0020 | 0.28–0.40 |
| BDNF | rs190666912 | g | c | 0.496 | 0.35 | 0.09 | 1.9E-04 | 16.9 | 3.0E-01 | 72,303 | 0.502 | 0.43 | 0.09 | 2.6E-06 | 103,685 | 0.0009 | 0.17–0.27 |
| MTCH2 | rs896817 | c | t | 0.713 | 0.46 | 0.09 | 4.3E-07 | 0 | 7.9E-01 | 101,965 | 0.735 | 0.46 | 0.09 | 3.2E-07 | 126,735 | 0.0008 | 0.03 |
| FAIM2 | rs7138803 | a | g | 0.285 | 0.35 | 0.09 | 9.0E-05 | 0 | 4.8E-01 | 101,969 | 0.254 | 0.35 | 0.09 | 1.0E-04 | 127,226 | 0.0005 | 1 (same) |
| MAP2K5 | rs4776970 | a | t | 0.422 | 0.38 | 0.08 | 6.1E-06 | 0 | 9.0E-01 | 101,972 | 0.440 | 0.38 | 0.08 | 2.0E-06 | 134,469 | 0.0007 | 0.56–1 (same) |
| GPRC5B | rs67501351 | g | c | 0.372 | 0.36 | 0.08 | 1.5E-05 | 28.8 | 2.4E-01 | 101,506 | 0.327 | 0.40 | 0.08 | 4.8E-07 | 140,434 | 0.0007 | 0.02 |
| ATP2A1 | rs8061590 | g | a | 0.307 | 0.52 | 0.10 | 2.9E-07 | 0 | 3.7E-01 | 84,081 | 0.318 | 0.56 | 0.10 | 3.2E-08 | 98,598 | 0.0013 | 0.92 |
| FTO | rs3751812 | t | g | 0.242 | 1.34 | 0.10 | 2.4E-42 | 15.6 | 3.1E-01 | 101,974 | 0.213 | 1.31 | 0.13 | 1.8E-24 | 114,260 | 0.0057 | 0.94–0.95 |
| FTO | rs9936385 | c | t | 0.289 | 1.34 | 0.11 | 7.5E-37 | 6.9 | 3.4E-01 | 66,366 | 0.366 | 1.51 | 0.16 | 1.2E-20 | 84,239 | 0.0104 | 0.38–0.39 |
| MC4R | rs6567160 | c | t | 0.193 | 0.89 | 0.10 | 9.4E-19 | 13.8 | 3.2E-01 | 101,966 | 0.184 | 0.89 | 0.10 | 7.7E-19 | 134,789 | 0.0024 | 0.01–1 (same) |
| MC4R | rs77901086 | a | c | 0.985 | 1.84 | 0.43 | 2.6E-05 | 0 | 4.5E-01 | 88,060 | 0.989 | 1.81 | 0.43 | 3.2E-05 | 77,866 | 0.0007 | 0.11 |
| KCTD15 | rs368794 | a | t | 0.537 | 0.32 | 0.08 | 1.4E-04 | 0 | 4.0E-01 | 99,796 | 0.581 | 0.32 | 0.08 | 6.3E-05 | 131,938 | 0.0005 | 0.49 |
| GIPR* | rs1800437 | g | c | 0.817 | 0.64 | 0.11 | 1.6E-09 | 0 | 8.2E-01 | 101,488 | 0.842 | 0.64 | 0.11 | 6.0E-09 | 116,182 | 0.0011 | 0.09–0.88 |
Abbreviations: Bp37=base pair Build 37, Chr=chromosome, FE=Fixed-Effect, MANTRA=Meta-ANalysis of Trans-Ethnic Association studies, SNPs=single nucleotide polymorphisms.
Note: Starred genes represent fine-mapped loci, which were associated with BMI after the design of the Metabochip in 2009.
Genome-wide significant findings under review (Gong et al., under reivew at Nature Comm).
For GWAS SNPs a Bonferroni correction for multiple tests reflected the number of independent GWAS signals tested (=0.05/166; Supplemental Table 3). For all other SNPs in the fine-mapped BMI regions, we performed a Bonferroni correction for the number of independent SNPs per region (r2<0.2 in ARIC African-Americans; Supplemental Table 1).
The range of linkage disequilibrium captures any SNP within the fine-mapped loci (Supplemental Table 3) that represents the index BMI signal or secondary signal (described in European descent populations), or race/ethnic population specific marker. ARIC, HCHS/SOL, and WHI samples were used to represent the linkage disequilibrium for the PAGE trans-ethnic and European descent samples.
We also noted a secondary signal at FTO in our trans-ethnic sample with BMI in joint analyses (Table 6), which was in moderate LD in our trans-ethnic sample with our lead SNP (r2=0.41). We also observed evidence for 6 additional novel secondary signals at LYPLAL1, COBLL1, IRS1, SLC39A8, TFAP2B, STK33/TRIM66 (Table 6). Incidentally most of the 99% credible intervals for the 9 loci with evidence of secondary signals not well refined and included ≥15 SNPs (Table 5); however, TFAP2B and FTO had 99% credible intervals that included 1–6 SNPs (Figures 1–2). Collectively 10 of 18 SNPs representing multiple signals (6 for primary and 4 for secondary signals) within 9 densely-genotyped regions varied in risk allele frequencies by more than 20% across the racial/ethnic groups (Supplemental Figure 8).
Interestingly the top/index SNP at BRE was significant in the single-variant model, but was not significant in the joint model of the most significant SNPs representing each signal, which included a variant >3 Mb upstream at ADCY3 (rs10182181, pj =2.42×10⁻¹⁰). Conditional analyses adjusting for rs10182181 at ADCY3 confirmed that the top fixed-effect and Bayesian SNPs in the region were no longer Bonferroni significant (pc =2.02×10⁻³ and 9.94×10⁻³, respectively), suggesting that this association may in part be related to long-range LD patterns.
We also conducted a trans-ethnic exact conditional sensitivity analysis of African, Hispanic, Asian and European descent populations in a subset of densely-genotyped BMI loci, which had evidence of two independent signals in the conditional and joint GCTA analyses. At three of the six loci included in the sensitivity analysis we noted Bonferroni significant evidence for secondary signals (COBLL1, BDNF-AS1/BDNF, MC4R; pc exact<9.5×10⁻⁵) and at three loci, nominally significant evidence for secondary signals (LYPLAL1, SLC39A8, TFAP2B; 4.5×10⁻⁵≤pc exact≤1.4×10⁻²; Supplemental Table 10). Additionally, we ran a race/ethnic group-stratified approximate conditional analysis. Although this approach had greater missingness in the meta-analyzed trans-ethnic results, it did confirm the Bonferroni significant exact conditional findings at COBLL1, BDNF-AS1/BDNF, MC4R, and also yielded significant evidence of a secondary signal at IRS1. Although all secondary signals were supported at nominally significance by all methods, Bonferroni significance was only seen at LYPLAL1, SLC39A8, TFAP2B, STK33/TRIM66, and FTO in the approximate conditional (Supplemental Table 10) and joint analyses (Table 6) using a mixed reference population.
DISCUSSION
Trans-ethnic fine-mapping has been called for as an important next step in describing the genetic architecture of BMI (Locke et al. 2015). This work expands on previous fine-mapping efforts conducted by the PAGE Study, which generalized 8 of 21 then known BMI loci to African American individuals (Gong et al. 2013), by including several under-studied populations in genetic epidemiology (Bustamante et al. 2011) with distinct burdens of obesity (Flegal et al. 2012; Oza-Frank et al. 2009). We also incorporate BMI index SNPs from African, Asian, and trans-ethnic GWAS (Monda et al. 2013; Okada et al. 2012; Pei et al. 2014; Wen et al. 2012; Wen et al. 2014), and harness the dense genotypes at 36 BMI loci in a trans-ethnic sample to generalize, or fine-map, more than a third of currently known BMI loci to diverse populations.
The trans-ethnic meta-analyses are better powered than racial/ethnic specific analyses (Supplemental Figure 1) for genetic loci that are shared across ancestral groups (Wang et al. 2013). We find that nearly a quarter of the previously described BMI index SNPs and even more (81%) of the densely-genotyped BMI loci available on the MetaboChip met our definition for generalization in a trans-ethnic sample of 101,979 adults. These results help demonstrate the transferability of common genetic loci to diverse populations and how effect dilution can be avoided using fine-mapping techniques (Carlson et al. 2013).
However, some of the BMI loci assessed in this study (7 of 36) were not significant in our trans-ethnic fixed-effect meta-analysis. Three of these loci replicated in European Americans only (NEGR1, PRKD1, KCNJ2). One locus (SLC22A3) generalized to individuals of African and American Indian/Alaskan Native descent. Two more loci were significant in at least one subgroup, but the risk alleles were directionally inconsistent at the index SNPs and the lead trans-ethnic SNPs in the regions were in weak LD in WHI European women (KCNJ11 and BRAP/TRAFD1, r2<0.01; Supplemental Tables 6–7), suggesting that there may be distinct ancestral haplotypes at these loci. Our results are consistent with the hypothesis that the majority of common genetic loci for complex traits like BMI will generalize to diverse populations given sufficient statistical power (a function of allele frequency, effect size and sample size, etc.) (Carlson et al. 2013), and the importance of considering directional consistency and LD when multiple underlying causal variants may be present across populations.
At 6 loci (e.g. SEC16B, IRS1, SLC39A8, FAIM2, TCF7L2, MC4R) we noted the same lead SNP using a Bayesian trans-ethnic fine-mapping approach (Morris 2011) as previously reported in European descent individuals using an approximate Bayesian fine-mapping approach (Locke et al. 2015; Wakefield 2007). Of note, the lead SNP at one of these loci, SLC39A8, was a non-synonymous SNP that was conserved across species (Supplemental Table 11). We were also able to narrow the putative regions of interest (in base pairs) at 9 of the 20 loci assessed either at least as well or better than in previous studies (SEC16B, TMEM18, IRS1, TFAP2B, NT5C2, TCF7L2, BDNF-AS1/BDNF, MC4R, GIPR).
The assumption of one underlying signal appeared to hold for five of these fine-mapped loci (e.g. SEC16B, TMEM18, NT5C2, TCF7L2, GIPR), which gives us further confidence to interpret the credible intervals of these five loci as representing the interval where there is a 99% probability of capturing the underlying functional variant. Among these loci, there were several interesting functional consequences (Supplemental Table 11) of our lead SNPs. For example, the lead/index SNP 8.8kb 3′ of SEC16B and 3.6kb 3′ of RP4-798P15.2 was the only SNP in our Bayesian 99% credible set and was conserved across species and from histone modification assessment was predicted to be an enhancer in muscle tissue (rs543874). The lead SNP (rs6731872), 43kb 3′ of TMEM18, was predicted to change BCL and TR4 motifs, and was identified as an eQTL for C10orf32-AS3MT. The lead/index SNP within TCF7L2 (rs7903146) was found to be a promoter in pancreas; an enhancer in fat, muscle, and five other tissues; and changed several binding motifs. Interestingly a non-synonymous lead SNP at GIPR (rs1800437) lies within a CMYC binding motif, and was predicted to be an enhancer, promoter, and an eQTL with FBXO46/VASP in whole blood; a DNAse sensitive region in several tissues including fat, muscle, and pancreas; and found to change a CTCF binding motif.
Due to allelic diversity of our sample, we were able to describe secondary signals for BMI at 9 loci, 7 of which for the first time with BMI (LYPLAL1, COBLL1, IRS1, SLC39A8, TRAP2B, STK33/TRIM66, and FTO). SNPs representing four of these 7 new BMI secondary signals had larger risk-allele frequencies (>20%) across the African, Hispanic/Latino, Asian and European ancestries of our trans-ethnic sample (Supplemental Figure 8), further indicating the potential for remarkable variability in the frequency of underlying causal variants at established BMI loci across diverse populations. A sensitivity analysis comparing exact and approximate conditional p-values supported our approximate conditional findings at nominal significane, or in the case of COBLL1, IRS1, BDNF-AS1/BDNF, MC4R, at Bonferroni significance.
Using our approximate conditional approach we replicated previously-reported independent BMI signals at BDNF-AS1/BDNF, MC4R and GPRC5B/GP2 (Locke et al. 2015). Both the independent lead SNPs for the BDNF-AS1 (rs1519480) and BDNF (rs190666912) signals were conserved across species, predicted to be enhancer in brain and other tissues, and lied in DNAse sensitive regions (Supplemental Table 11). The primary signal (rs1519480) was intronic to BDNF-AS1 and an eQTL for BDNF antisense RNA, which binds to GATA2 and YY1. The SNP for the primary signal (rs6567160, located 209kb 3′ of MC4R and 1.7kb 5′ of U4, a small nucleor RNA) was both conserved across species and in a DNAse sensitive region in muscle. In contrast the SNP representing the secondary signal (rs77901086) was 44kb 5′ of MC4R and was in high LD (r2>0.8 in 1000 Genomes AFR) with a highly conserved non-synonymous SNP (rs2229616) 44kb upstream within MC4R, which alters a GATA binding motif and has histone marks consistent with being a promoter and enhancer in brain. However, only rs6567160 remained in our 99% credible set.
Moreover, our observation of novel secondary signals is supported in the literature at three loci. First, with waist-hip ratio COBLL1 has been described to have as many as five independent signals (Shungin et al. 2015). Interestingly, we observe stronger LD patterns between our primary BMI signal (rs10184004) and their primary-quaternary waist-hip ratio signals (r2=0.30–0.97 in 1000 Genomes pilot CEU), and stronger LD between our secondary signal (rs17244444) and their quinary signal (r2=0.44). Whereas the SNP representing the primary signal at 1.7kb 3′ of COBLL1 (rs10184004) alters several binding sites including Nrf-2 and Maf for MAFK, is DNAase sensitive in skin and is an eQTL with SLC38A11 in muscle, the SNP for the secondary signal (rs17244444) was intronic to COBLL1 and also alters a Nrf-2 binding site (Supplemental Table 11). Second, we have previously noted a possible secondary signal at TRAP2B in the Hispanic/Latino women from WHI (Graff et al. 2013). The SNPs representing two signals at the TFAP2B region were located on either side of this gene and predicted to modify several binding motifs including TATA and GAGA (rs2744475, rs2397016), but only rs2744475 was retained in our 99% credible set.
Third, even though previous studies of BMI have not previously observed strong evidence for a FTO secondary signals (Akiyama et al. 2014; Gong et al. 2013; Locke et al. 2015; Peters et al. 2013; Yang et al. 2012), one study of Type 2 Diabetes has noted a secondary signal at FTO in European descent individuals (Maller et al. 2012). The independent signals seen in our study (rs3751812; rs9936385, which is r2=1.0 with rs9939609 in 1000 Genomes YRI pilot) lie in two distinct clusters of SNPs that define two African ancestral haplotypes (Akiyama et al. 2014). Both of our FTO signals (rs3751812, rs9936385) lie within the physical bounds of the putative interval of interest from our earlier PAGE fine-mapping work with African Americans only (Peters et al. 2013). Lastly both signals at FTO were intronic and predicted to be enhancers in muscle as well as either fat or brain and DNAse sensitive in brain and several other tissues (rs3751812, rs9936385; Supplemental Table 11). The SNP representing the primary signal at FTO (rs3751812) was conserved across species, but interestingly the SNP for the secondary signal (rs9936385) was associated with Type 2 Diabetes in a trans-ethnic sample (Mahajan et al. 2014).
At four loci with novel multiple signals for BMI and no president in the literature, we noted interesting functional consequences of the implicated SNPs (Supplemental Table 11). For example, both independent SNPs (rs2820436, 254kb 3′ of LYPLAL1; and rs4445477, 287kb 5′ of RNU5F) were predicted to be enhancers in fat and a number of other tissues, as well as modify motifs of a number of binding factors. At the IRS1 locus, both SNPs (rs2176040, rs2673147) were both located between AC068138.1 (>40kb 5′) and IRS1 (>400kb 3′), predicted to alter binding motifs and be eQTLs with IRS1 and RP11-395N3.2 in adipose tissue, but only the SNP for the secondary signal (rs2673147) was predicted to be an enhancer in brain tissue. In contrast to the non-synonymous SNP for the primary signal at SLC39A8 (rs13107325), the secondary signal (rs28392891) was located 38kb 3′ of SLC39A8 and predicted to alter a number of binding motifs. The SNPs representing the region’s secondary signal (rs76633799) at STK33 and the primary signals (rs76876925) at TRIM66 were predicted to change several binding motifs including HDAC2 sites. The variant at STK33 (rs76633799) was also conserved across species and an enhancer in fat and skin. Yet a key limitation of this work is that independent effect estimation and replication using exact conditional methods are needed to accurately pinpoint the exact underlying genetic variants and describe the variance explained by them in similarly diverse populations.
Although our study does allow for interesting insights on the genetic architecture of BMI across diverse samples, several additional limitations should be noted. First, fine-mapping resolutions depend on many factors, such as the extent of LD within the locus, allele frequencies and sample sizes of populations. Therefore, not surprisingly in this study the narrowing of the interval in trans-ethnic meta-analyses varied from one locus to another (Table 5). Second, in order to relax the strong assumption of fixed genetic effects in all of the racial/ethnic groups, we have also performed a trans-ethnic Bayesian analysis to apply empirical estimates of the mean allele frequency differences, appropriately cluster the racial/ethnic groups and construct credible intervals of confidence that the causal SNP lies within its bounds. Yet the relative improvement in fine-mapping resolution offered by this Bayesian trans-ethnic meta-analysis related to the ancestral heterogeneity at a given locus, the extent to which the estimated allele frequency differences across populations captured this heterogeneity, the number of independent signals, and their allele frequencies, and it comes at the cost of assuming one underlying signals. Even though approximate conditional and joint analyses helped us rule out the presence of statistically significant secondary signals at 27 densely-genotyped loci, future methodologic work should describe the impact of multiple signals on trans-ethnic fine-mapping techniques.
This study represents another step towards prioritizing candidates for future etiologic study and targeted functional follow-up. The genetic architecture of a complex trait like BMI and disparities in obesity emphasize the need for future obesity interventions to consider both determinants of individual and population-level variation. This study expands our understanding of allele frequency heterogeneity in the genetic architecture of BMI, while emphasizing the importance of diverse ancestral populations and high-dimensional genetic data in the fine-mapping of complex traits.
Supplementary Material
Acknowledgments
LFR was supported by the Cardiovascular Disease Epidemiology Training Grant from the National Heart, Lung, and Blood Institute (T32HL007055) and the American Heart Association (AHA) predoctoral grant (13PRE16100015). KKN was supported by a National Cancer Institute training grant: Cancer Prevention Training in Nutrition, Exercise and Genetics (R25CA094880). RHM was supported by the Women’s Health Initiative Regional Field Center Program (HHSN268201100002C). KEN was supported by R01-DK089256; 2R01HD057194; U01HG007416; R01DK101855, and AHA grant 13GRNT16490017.
The Population Architecture Using Genomics and Epidemiology (PAGE) program was funded by the National Human Genome Research Institute (NHGRI), supported by U01HG004803 (CALiCo), U01HG004798 (EAGLE), U01HG004802 (MEC), U01HG004790 (WHI), and U01HG004801 (Coordinating Center), and their respective NHGRI ARRA supplements. The contents of this paper are solely the responsibility of the authors and do not necessarily represent the official views of the NIH. The complete list of PAGE members can be found at PAGE website (http://www.pagestudy.org). The data and materials included in this report result from a collaboration between the following studies:
The “Epidemiologic Architecture for Genes Linked to Environment (EAGLE)” was funded through the NHGRI PAGE program (U01HG004798 and its NHGRI ARRA supplement). The dataset(s) used for the analyses described were obtained from Vanderbilt University Medical Center’s BioVU which was supported by institutional funding and by the Vanderbilt CTSA grant UL1 TR000445 from NCATS/NIH. The Vanderbilt University Center for Human Genetics Research, Computational Genomics Core provided computational and/or analytical support for this work.
The Multiethnic Cohort study (MEC) characterization of epidemiological architecture was funded through NHGRI (HG004802, and HG007397) and the NHGRI PAGE program (U01HG004802 and its NHGRI ARRA supplement). The MEC study was funded through the National Cancer Institute (CA164973, R37CA54281, R01 CA 063464, P01CA33619, U01CA136792, and U01CA98758).
Funding support for the “Epidemiology of putative genetic variants: The Women’s Health Initiative” study was provided through the NHGRI PAGE program (U01HG004790 and its NHGRI ARRA supplement). The WHI program was funded by the National Heart, Lung, and Blood Institute; NIH; and U.S. Department of Health and Human Services through contracts N01WH22110, 24152, 32100-2, 32105-6, 32108-9, 32111-13, 32115, 32118-32119, 32122, 42107-26, 42129-32, and 44221. The authors thank the WHI investigators and staff for their dedication, and the study participants for making the program possible. A full listing of WHI investigators can be found at: http://www.whiscience.org/publications/WHI_investigators_shortlist.pdf.(/p)(p)Funding support for the Genetic Epidemiology of Causal Variants Across the Life Course (CALiCo) program was provided through the NHGRI PAGE program (U01HG004803 and its NHGRI ARRA supplement). The following studies contributed to this manuscript and were funded by the following agencies:
The Atherosclerosis Risk in Communities Study (ARIC) was carried out as a collaborative study supported by National Heart, Lung, and Blood Institute contracts (HHSN268201100005C, HHSN268201100006C, HHSN268201100007C, HHSN268201100008C, HHSN268201100009C, HHSN268201100010C, HHSN268201100011C, and HHSN268201100012C), R01HL087641, R01HL59367 and R01HL086694; National Human Genome Research Institute contract U01HG004402; and National Institutes of Health contract HHSN268200625226C. The authors thank the staff and participants of the ARIC study for their important contributions. Infrastructure was partly supported by Grant Number UL1RR025005, a component of the National Institutes of Health and NIH Roadmap for Medical Research.
The Coronary Artery Risk Development in Young Adults (CARDIA) study was supported by the following National Institutes of Health, National Heart, Lung and Blood Institute contracts: N01-HC-95095; N01-HC-48047; N01-HC-48048; N01-HC-48049; N01-HC-48050; N01-HC-45134; N01-HC-05187; and N01-HC-45205.
The Cardiovascular Health Study (CHS) was supported by contracts HHSN268201200036C, N01-HC-85239, N01-HC-85079 through N01-HC-85086, N01-HC-35129, N01 HC-15103, N01 HC-55222, N01-HC-75150, N01-HC-45133, and grant HL080295 from the National Heart, Lung, and Blood Institute (NHLBI), with additional contribution from the National Institute of Neurological Disorders and Stroke (NINDS). Additional support was provided through AG-023629, AG-15928, AG-20098, and AG-027058 from the National Institute on Aging (NIA).
The Hispanic Community Health Study/Study of Latinos (SOL) was carried out as a collaborative study supported by contracts from the National Heart, Lung, and Blood Institute (NHLBI) to the University of North Carolina (N01-HC65233), University of Miami (N01-HC65234), Albert Einstein College of Medicine (N01-HC65235), Northwestern University (N01-HC65236), and San Diego State University (N01-HC65237). Additional support was provided by 1R01DK101855-01 and 13GRNT16490017. The following Institutes/Centers/Offices contributed to the HCHS/SOL through a transfer of funds to the NHLBI: National Center on Minority Health and Health Disparities, the National Institute of Deafness and Other Communications Disorders, the National Institute of Dental and Craniofacial Research, the National Institute of Diabetes and Digestive and Kidney Diseases, the National Institute of Neurological Disorders and Stroke, and the Office of Dietary Supplements.
GenNet was one of four networks in the Family Blood Pressure Program, established in 1995 and supported by a series of agreements with the NIH National Heart, Lung and Blood Institute.
The Mount Sinai BioMe Biobank was supported by The Andrea and Charles Bronfman Philanthropies.
The studies of the TaiChi Consortium were supported by the National Health Research Institutes, Taiwan (PH-100-SP-01, BS-094-PP-01, PH-100-PP-03), the National Science Council, Taiwan (Grant Nos NSC 98-2314-B-075A-002-MY3, NSC 96-2314-B-002-151, NSC 96-2314-B-002-152, NSC 98-2314-B-002-122-MY2, NSC 100-2314-B-002-115, NSC 101-2325-002-078, 101-2314-B-075A-006-MY3), the National Taiwan University Hospital, Taiwan (NTUH 98-N1266, NTUH 100-N1775, NTUH 101-N2010, NTUH 101-N, VN101-04, NTUH 101-S1784).
The Hypertension Genetic Epidemiology Network (HyperGEN) study was supported by National Heart, Lung, and Blood Institute contracts HL086694 and HL055673.
Assistance with phenotype harmonization, SNP selection and annotation, data cleaning, data management, integration and dissemination, and general study coordination was provided by the PAGE Coordinating Center (U01HG004801-01 and its NHGRI ARRA supplement). The National Institutes of Mental Health also contributed support for the Coordinating Center.
The authors gratefully acknowledge Dr. Ben Voight for sharing the Metabochip SNP linkage disequilibrium and minor allele frequency statistics estimated in the Malmö Diet and Cancer Study. The PAGE Study thanks the staff and participants of all PAGE studies for their important contributions.
Footnotes
ETHICAL APPROVAL
All procedures performed in studies involving human participants were in accordance with the ethical standards of the institutional and/or national research committee and with the 1964 Helsinki declaration and its later amendments or comparable ethical standards.
CONFLICTS OF INTEREST
On behalf of all authors, the corresponding author states that there is no conflict of interest.
References
- Akiyama K, Takeuchi F, Isono M, Chakrawarthy S, Nguyen QN, Wen W, Yamamoto K, Katsuya T, Kasturiratne A, Pham ST, Zheng W, Matsushita Y, Kishimoto M, Do LD, Shu XO, Wickremasinghe AR, Kajio H, Kato N. Systematic fine-mapping of association with BMI and type 2 diabetes at the FTO locus by integrating results from multiple ethnic groups. PLoS One. 2014;9:e101329. doi: 10.1371/journal.pone.0101329. [DOI] [PMC free article] [PubMed] [Google Scholar]
- Assimes TL, Lee IT, Juang JM, Guo X, Wang TD, Kim ET, Lee WJ, Absher D, Chiu YF, Hsu CC, Chuang LM, Quertermous T, Hsiung CA, Rotter JI, Sheu WH, Chen YD, Taylor KD. Genetics of Coronary Artery Disease in Taiwan: A Cardiometabochip Study by the Taichi Consortium. PLoS One. 2016;11:e0138014. doi: 10.1371/journal.pone.0138014. [DOI] [PMC free article] [PubMed] [Google Scholar]
- Berndt SI, Gustafsson S, Magi R, Ganna A, Wheeler E, Feitosa MF, Justice AE, Monda KL, Croteau-Chonka DC, Day FR, Esko T, Fall T, Ferreira T, Gentilini D, Jackson AU, Luan J, Randall JC, Vedantam S, Willer CJ, Winkler TW, Wood AR, Workalemahu T, Hu YJ, Lee SH, Liang L, Lin DY, Min JL, Neale BM, Thorleifsson G, Yang J, Albrecht E, Amin N, Bragg-Gresham JL, Cadby G, den Heijer M, Eklund N, Fischer K, Goel A, Hottenga JJ, Huffman JE, Jarick I, Johansson A, Johnson T, Kanoni S, Kleber ME, Konig IR, Kristiansson K, Kutalik Z, Lamina C, Lecoeur C, Li G, Mangino M, McArdle WL, Medina-Gomez C, Muller-Nurasyid M, Ngwa JS, Nolte IM, Paternoster L, Pechlivanis S, Perola M, Peters MJ, Preuss M, Rose LM, Shi J, Shungin D, Smith AV, Strawbridge RJ, Surakka I, Teumer A, Trip MD, Tyrer J, Van Vliet-Ostaptchouk JV, Vandenput L, Waite LL, Zhao JH, Absher D, Asselbergs FW, Atalay M, Attwood AP, Balmforth AJ, Basart H, Beilby J, Bonnycastle LL, Brambilla P, Bruinenberg M, Campbell H, Chasman DI, Chines PS, Collins FS, Connell JM, Cookson WO, de Faire U, de Vegt F, Dei M, Dimitriou M, Edkins S, Estrada K, Evans DM, Farrall M, Ferrario MM, et al. Genome-wide meta-analysis identifies 11 new loci for anthropometric traits and provides insights into genetic architecture. Nat Genet. 2013;45:501–12. doi: 10.1038/ng.2606. [DOI] [PMC free article] [PubMed] [Google Scholar]
- Bustamante CD, Burchard EG, De la Vega FM. Genomics for the world. Nature. 2011;475:163–5. doi: 10.1038/475163a. [DOI] [PMC free article] [PubMed] [Google Scholar]
- Buyske S, Wu Y, Carty CL, Cheng I, Assimes TL, Dumitrescu L, Hindorff LA, Mitchell S, Ambite JL, Boerwinkle E, Buzkova P, Carlson CS, Cochran B, Duggan D, Eaton CB, Fesinmeyer MD, Franceschini N, Haessler J, Jenny N, Kang HM, Kooperberg C, Lin Y, Le Marchand L, Matise TC, Robinson JG, Rodriguez C, Schumacher FR, Voight BF, Young A, Manolio TA, Mohlke KL, Haiman CA, Peters U, Crawford DC, North KE. Evaluation of the metabochip genotyping array in African Americans and implications for fine mapping of GWAS-identified loci: the PAGE study. PLoS One. 2012;7:e35651. doi: 10.1371/journal.pone.0035651. [DOI] [PMC free article] [PubMed] [Google Scholar]
- Carlson CS, Matise TC, North KE, Haiman CA, Fesinmeyer MD, Buyske S, Schumacher FR, Peters U, Franceschini N, Ritchie MD, Duggan DJ, Spencer KL, Dumitrescu L, Eaton CB, Thomas F, Young A, Carty C, Heiss G, Le Marchand L, Crawford DC, Hindorff LA, Kooperberg CL. Generalization and dilution of association results from European GWAS in populations of non-European ancestry: the PAGE study. PLoS Biol. 2013;11:e1001661. doi: 10.1371/journal.pbio.1001661. [DOI] [PMC free article] [PubMed] [Google Scholar]
- Carty CL, Spencer KL, Setiawan VW, Fernandez-Rhodes L, Malinowski J, Buyske S, Young A, Jorgensen NW, Cheng I, Carlson CS, Brown-Gentry K, Goodloe R, Park A, Parikh NI, Henderson B, Le Marchand L, Wactawski-Wende J, Fornage M, Matise TC, Hindorff LA, Arnold AM, Haiman CA, Franceschini N, Peters U, Crawford DC. Replication of genetic loci for ages at menarche and menopause in the multi-ethnic Population Architecture using Genomics and Epidemiology (PAGE) study. Human Reproduction. 2013;28:1695–1706. doi: 10.1093/humrep/det071. [DOI] [PMC free article] [PubMed] [Google Scholar]
- Chen MH, Yang Q. GWAF: an R package for genome-wide association analyses with family data. Bioinformatics. 2010;26:580–1. doi: 10.1093/bioinformatics/btp710. [DOI] [PMC free article] [PubMed] [Google Scholar]
- Consortium STD. Williams AL, Jacobs SB, Moreno-Macias H, Huerta-Chagoya A, Churchhouse C, Marquez-Luna C, Garcia-Ortiz H, Gomez-Vazquez MJ, Burtt NP, Aguilar-Salinas CA, Gonzalez-Villalpando C, Florez JC, Orozco L, Haiman CA, Tusie-Luna T, Altshuler D. Sequence variants in SLC16A11 are a common risk factor for type 2 diabetes in Mexico. Nature. 2014;506:97–101. doi: 10.1038/nature12828. [DOI] [PMC free article] [PubMed] [Google Scholar]
- Crawford DC, Goodloe R, Farber-Eger E, Boston J, Pendergrass SA, Haines JL, Ritchie MD, Bush WS. Leveraging Epidemiologic and Clinical Collections for Genomic Studies of Complex Traits. Hum Hered. 2015;79:137–46. doi: 10.1159/000381805. [DOI] [PMC free article] [PubMed] [Google Scholar]
- Daviglus ML, Talavera GA, Aviles-Santa ML, Allison M, Cai J, Criqui MH, Gellman M, Giachello AL, Gouskova N, Kaplan RC, LaVange L, Penedo F, Perreira K, Pirzada A, Schneiderman N, Wassertheil-Smoller S, Sorlie PD, Stamler J. Prevalence of major cardiovascular risk factors and cardiovascular diseases among Hispanic/Latino individuals of diverse backgrounds in the United States. JAMA. 2012;308:1775–84. doi: 10.1001/jama.2012.14517. [DOI] [PMC free article] [PubMed] [Google Scholar]
- Dumitrescu L, Ritchie MD, Brown-Gentry K, Pulley JM, Basford M, Denny JC, Oksenberg JR, Roden DM, Haines JL, Crawford DC. Assessing the accuracy of observer-reported ancestry in a biorepository linked to electronic medical records. Genet Med. 2010;12:648–50. doi: 10.1097/GIM.0b013e3181efe2df. [DOI] [PMC free article] [PubMed] [Google Scholar]
- Fesinmeyer MD, North KE, Ritchie MD, Lim U, Franceschini N, Wilkens LR, Gross MD, Buzkova P, Glenn K, Quibrera PM, Fernandez-Rhodes L, Li Q, Fowke JH, Li R, Carlson CS, Prentice RL, Kuller LH, Manson JE, Matise TC, Cole SA, Chen CT, Howard BV, Kolonel LN, Henderson BE, Monroe KR, Crawford DC, Hindorff LA, Buyske S, Haiman CA, Le Marchand L, Peters U. Genetic Risk Factors for BMI and Obesity in an Ethnically Diverse Population: Results From the Population Architecture Using Genomics and Epidemiology (PAGE) Study. Obesity (Silver Spring) 2012 doi: 10.1038/oby.2012.158. [DOI] [PMC free article] [PubMed] [Google Scholar]
- Flegal KM, Carroll MD, Kit BK, Ogden CL. Prevalence of Obesity and Trends in the Distribution of Body Mass Index Among US Adults, 1999–2010. JAMA. 2012 doi: 10.1001/jama.2012.39. [DOI] [PubMed] [Google Scholar]
- Flegal KM, Troiano RP. Changes in the distribution of body mass index of adults and children in the US population. Int J Obes Relat Metab Disord. 2000;24:807–18. doi: 10.1038/sj.ijo.0801232. [DOI] [PubMed] [Google Scholar]
- Gauderman WJ, Morrison JM. QUANTO 1.1: A computer program for power and sample size calculations for genetic-epidemiology studies 2006 [Google Scholar]
- Gong J, Schumacher F, Lim U, Hindorff LA, Haessler J, Buyske S, Carlson CS, Rosse S, Buzkova P, Fornage M, Gross M, Pankratz N, Pankow JS, Schreiner PJ, Cooper R, Ehret G, Gu CC, Houston D, Irvin MR, Jackson R, Kuller L, Henderson B, Cheng I, Wilkens L, Leppert M, Lewis CE, Li R, Nguyen KD, Goodloe R, Farber-Eger E, Boston J, Dilks HH, Ritchie MD, Fowke J, Pooler L, Graff M, Fernandez-Rhodes L, Cochrane B, Boerwinkle E, Kooperberg C, Matise TC, Le Marchand L, Crawford DC, Haiman CA, North KE, Peters U. Fine Mapping and Identification of BMI Loci in African Americans. Am J Hum Genet. 2013;93:661–71. doi: 10.1016/j.ajhg.2013.08.012. [DOI] [PMC free article] [PubMed] [Google Scholar]
- Goodloe R, Farber-Eger E, Boston J, Crawford DC, Bush WS. Reducing clinical noise for body mass index measures due to unit and transcription errors in the electronic health record. AMIA Jt Summits Transl Sci Proc. in press. [PMC free article] [PubMed] [Google Scholar]
- Graff M, Fernandez-Rhodes L, Liu S, Carlson C, Wassertheil-Smoller S, Neuhouser M, Reiner A, Kooperberg C, Rampersaud E, Manson JE, Kuller LH, Howard BV, Ochs-Balcom HM, Johnson KC, Vitolins MZ, Sucheston L, Monda K, North KE. Generalization of adiposity genetic loci to US Hispanic women. Nutr Diabetes. 2013;3:e85. doi: 10.1038/nutd.2013.26. [DOI] [PMC free article] [PubMed] [Google Scholar]
- Hall JB, Dumitrescu L, Dilks HH, Crawford DC, Bush WS. Accuracy of administratively-assigned ancestry for diverse populations in an electronic medical record-linked biobank. PLoS One. 2014;9:e99161. doi: 10.1371/journal.pone.0099161. [DOI] [PMC free article] [PubMed] [Google Scholar]
- Hjelmborg J, Fagnani C, Silventoinen K, McGue M, Korkeila M, Christensen K, Rissanen A, Kaprio J. Genetic influences on growth traits of BMI: a longitudinal study of adult twins. Obesity (Silver Spring) 2008;16:847–52. doi: 10.1038/oby.2007.135. [DOI] [PubMed] [Google Scholar]
- Humes KR, Jones NA, Ramirez RR. Overview of Race and Hispanic Origin: 2010. 2010 Census Briefs. U.S. CENSUS BUREAU; 2011. [Google Scholar]
- Justice AE, Winkler TW, Graff M, Young KL, Xue L, Mahajan A, Hadley D, Ahluwalia TS, Renström F, Workalemahu T, den Hoed M, Chu A, Heard-Costa N, Czajkowski J, Ngwa J, Qi Q, Monda K, Loos RJF, Kilpeläinen TO, Borecki IB, North KE, Cupples LA. Genome-Wide Meta-Analysis of 241,258 Adults Accounting for Smoking Behavior Identifies Novel Loci for Obesity Traits. Nature Communications. doi: 10.1038/ncomms14977. in press. [DOI] [PMC free article] [PubMed] [Google Scholar]
- Lim U, Ernst T, Buchthal S, Latch M, Albright CL, Wilkens LR, Kolonel L, Murphy S, Chang LD, Novotny R, Le Marchand L. Asian Women Have Greater Abdominal and Visceral Adiposity Than Caucasian Women With Similar Body Mass Index. Obesity. 2011;19:S224–S224. doi: 10.1038/nutd.2011.2. [DOI] [PMC free article] [PubMed] [Google Scholar]
- Lim U, Ernst T, Wilkens LR, Albright CL, Lum-Jones A, Seifried A, Buchthal SD, Novotny R, Kolonel LN, Chang L, Cheng I, Le Marchand L. Susceptibility Variants for Waist Size in Relation to Abdominal, Visceral, and Hepatic Adiposity in Postmenopausal Women. J Acad Nutr Diet. 2012;112:1048–1055. doi: 10.1016/j.jand.2012.03.034. [DOI] [PMC free article] [PubMed] [Google Scholar]
- Lin DY, Tao R, Kalsbeek WD, Zeng DL, Gonzalez F, Fernandez-Rhodes L, Graff M, Koch GG, North KE, Heiss G. Genetic Association Analysis under Complex Survey Sampling: The Hispanic Community Health Study/Study of Latinos. Am J Hum Genet. 2014;95:675–688. doi: 10.1016/j.ajhg.2014.11.005. [DOI] [PMC free article] [PubMed] [Google Scholar]
- Liu EY, Buyske S, Aragaki AK, Peters U, Boerwinkle E, Carlson C, Carty C, Crawford DC, Haessler J, Hindorff LA, Marchand LL, Manolio TA, Matise T, Wang W, Kooperberg C, North KE, Li Y. Genotype imputation of Metabochip SNPs using a study-specific reference panel of ~4,000 haplotypes in African Americans from the Women’s Health Initiative. Genet Epidemiol. 2012;36:107–17. doi: 10.1002/gepi.21603. [DOI] [PMC free article] [PubMed] [Google Scholar]
- Locke AE, Kahali B, Berndt SI, Justice AE, Pers TH, Day FR, Powell C, Vedantam S, Buchkovich M, Consortium G Genetic studies of body mass index yield new insights for obesity biology. Nature. 2015;518:197–206. doi: 10.1038/nature14177. [DOI] [PMC free article] [PubMed] [Google Scholar]
- Maes HH, Neale MC, Eaves LJ. Genetic and environmental factors in relative body weight and human adiposity. Behav Genet. 1997;27:325–51. doi: 10.1023/a:1025635913927. [DOI] [PubMed] [Google Scholar]
- Mahajan A, Go MJ, Zhang W, Below JE, Gaulton KJ, Ferreira T, Horikoshi M, Johnson AD, Ng MC, Prokopenko I, Saleheen D, Wang X, Zeggini E, Abecasis GR, Adair LS, Almgren P, Atalay M, Aung T, Baldassarre D, Balkau B, Bao Y, Barnett AH, Barroso I, Basit A, Been LF, Beilby J, Bell GI, Benediktsson R, Bergman RN, Boehm BO, Boerwinkle E, Bonnycastle LL, Burtt N, Cai Q, Campbell H, Carey J, Cauchi S, Caulfield M, Chan JC, Chang LC, Chang TJ, Chang YC, Charpentier G, Chen CH, Chen H, Chen YT, Chia KS, Chidambaram M, Chines PS, Cho NH, Cho YM, Chuang LM, Collins FS, Cornelis MC, Couper DJ, Crenshaw AT, van Dam RM, Danesh J, Das D, de Faire U, Dedoussis G, Deloukas P, Dimas AS, Dina C, Doney AS, Donnelly PJ, Dorkhan M, van Duijn C, Dupuis J, Edkins S, Elliott P, Emilsson V, Erbel R, Eriksson JG, Escobedo J, Esko T, Eury E, Florez JC, Fontanillas P, Forouhi NG, Forsen T, Fox C, Fraser RM, Frayling TM, Froguel P, Frossard P, Gao Y, Gertow K, Gieger C, Gigante B, Grallert H, Grant GB, Grrop LC, Groves CJ, Grundberg E, Guiducci C, Hamsten A, Han BG, Hara K, Hassanali N, et al. Genome-wide trans-ancestry meta-analysis provides insight into the genetic architecture of type 2 diabetes susceptibility. Nat Genet. 2014;46:234–44. doi: 10.1038/ng.2897. [DOI] [PMC free article] [PubMed] [Google Scholar]
- Maller JB, McVean G, Byrnes J, Vukcevic D, Palin K, Su Z, Howson JM, Auton A, Myers S, Morris A, Pirinen M, Brown MA, Burton PR, Caulfield MJ, Compston A, Farrall M, Hall AS, Hattersley AT, Hill AV, Mathew CG, Pembrey M, Satsangi J, Stratton MR, Worthington J, Craddock N, Hurles M, Ouwehand W, Parkes M, Rahman N, Duncanson A, Todd JA, Kwiatkowski DP, Samani NJ, Gough SC, McCarthy MI, Deloukas P, Donnelly P. Bayesian refinement of association signals for 14 loci in 3 common diseases. Nat Genet. 2012;44:1294–301. doi: 10.1038/ng.2435. [DOI] [PMC free article] [PubMed] [Google Scholar]
- Matise TC, Ambite JL, Buyske S, Carlson CS, Cole SA, Crawford DC, Haiman CA, Heiss G, Kooperberg C, Marchand LL, Manolio TA, North KE, Peters U, Ritchie MD, Hindorff LA, Haines JL. The Next PAGE in understanding complex traits: design for the analysis of Population Architecture Using Genetics and Epidemiology (PAGE) Study. Am J Epidemiol. 2011;174:849–59. doi: 10.1093/aje/kwr160. [DOI] [PMC free article] [PubMed] [Google Scholar]
- Monda KL, Chen GK, Taylor KC, Palmer C, Edwards TL, Lange LA, Ng MC, Adeyemo AA, Allison MA, Bielak LF, Chen G, Graff M, Irvin MR, Rhie SK, Li G, Liu Y, Lu Y, Nalls MA, Sun YV, Wojczynski MK, Yanek LR, Aldrich MC, Ademola A, Amos CI, Bandera EV, Bock CH, Britton A, Broeckel U, Cai Q, Caporaso NE, Carlson CS, Carpten J, Casey G, Chen WM, Chen F, Chen YD, Chiang CW, Coetzee GA, Demerath E, Deming-Halverson SL, Driver RW, Dubbert P, Feitosa MF, Feng Y, Freedman BI, Gillanders EM, Gottesman O, Guo X, Haritunians T, Harris T, Harris CC, Hennis AJ, Hernandez DG, McNeill LH, Howard TD, Howard BV, Howard VJ, Johnson KC, Kang SJ, Keating BJ, Kolb S, Kuller LH, Kutlar A, Langefeld CD, Lettre G, Lohman K, Lotay V, Lyon H, Manson JE, Maixner W, Meng YA, Monroe KR, Morhason-Bello I, Murphy AB, Mychaleckyj JC, Nadukuru R, Nathanson KL, Nayak U, N’Diaye A, Nemesure B, Wu SY, Leske MC, Neslund-Dudas C, Neuhouser M, Nyante S, Ochs-Balcom H, Ogunniyi A, Ogundiran TO, Ojengbede O, Olopade OI, Palmer JR, Ruiz-Narvaez EA, Palmer ND, Press MF, Rampersaud E, Rasmussen-Torvik LJ, Rodriguez-Gil JL, Salako B, Schadt EE, Schwartz AG, et al. A meta-analysis identifies new loci associated with body mass index in individuals of African ancestry. Nat Genet. 2013;45:690–6. doi: 10.1038/ng.2608. [DOI] [PMC free article] [PubMed] [Google Scholar]
- Morris AP. Transethnic meta-analysis of genomewide association studies. Genet Epidemiol. 2011;35:809–22. doi: 10.1002/gepi.20630. [DOI] [PMC free article] [PubMed] [Google Scholar]
- Okada Y, Kubo M, Ohmiya H, Takahashi A, Kumasaka N, Hosono N, Maeda S, Wen W, Dorajoo R, Go MJ, Zheng W, Kato N, Wu JY, Lu Q, Tsunoda T, Yamamoto K, Nakamura Y, Kamatani N, Tanaka T. Common variants at CDKAL1 and KLF9 are associated with body mass index in east Asian populations. Nat Genet. 2012;44:302–6. doi: 10.1038/ng.1086. [DOI] [PMC free article] [PubMed] [Google Scholar]
- Oza-Frank R, Ali MK, Vaccarino V, Narayan KM. Asian Americans: diabetes prevalence across U.S. and World Health Organization weight classifications. Diabetes Care. 2009;32:1644–6. doi: 10.2337/dc09-0573. [DOI] [PMC free article] [PubMed] [Google Scholar]
- Patterson N, Price AL, Reich D. Population structure and eigenanalysis. PLoS genetics. 2006;2:e190. doi: 10.1371/journal.pgen.0020190. [DOI] [PMC free article] [PubMed] [Google Scholar]
- Pei YF, Zhang L, Liu YJ, Li J, Shen H, Liu YZ, Tian Q, He H, Wu SY, Ran S, Han YY, Hai R, Lin Y, Zhu JY, Zhu XZ, Papasian CJ, Deng HW. Meta-analysis of genome-wide association data identifies novel susceptibility loci for obesity. Hum Mol Genet. 2014;23:820–830. doi: 10.1093/Hmg/Ddt464. [DOI] [PMC free article] [PubMed] [Google Scholar]
- Peters U, North KE, Sethupathy P, Buyske S, Haessler J, Jiao S, Fesinmeyer MD, Jackson RD, Kuller LH, Rajkovic A, Lim U, Cheng I, Schumacher F, Wilkens L, Li RL, Monda K, Ehret G, Nguyen KDH, Cooper R, Lewis CE, Leppert M, Irvin MR, Gu CC, Houston D, Buzkova P, Ritchie M, Matise TC, Le Marchand L, Hindorff LA, Crawford DC, Haiman CA, Kooperberg C. A Systematic Mapping Approach of 16q12.2/FTO and BMI in More Than 20,000 African Americans Narrows in on the Underlying Functional Variation: Results from the Population Architecture using Genomics and Epidemiology (PAGE) Study. PLoS Genet. 2013;9 doi: 10.1371/journal.pgen.1003171. doi: ARTN e1003171 10.1371/journal.pgen.1003171. [DOI] [PMC free article] [PubMed] [Google Scholar]
- Popkin BM. Recent dynamics suggest selected countries catching up to US obesity. Am J Clin Nutr. 2009;91:284S–288S. doi: 10.3945/ajcn.2009.28473C. ajcn.2009.28473C [pii] 10.3945/ajcn.2009.28473C. [DOI] [PMC free article] [PubMed] [Google Scholar]
- Price AL, Patterson NJ, Plenge RM, Weinblatt ME, Shadick NA, Reich D. Principal components analysis corrects for stratification in genome-wide association studies. Nature genetics. 2006;38:904–9. doi: 10.1038/ng1847. [DOI] [PubMed] [Google Scholar]
- Pruim RJ, Welch RP, Sanna S, Teslovich TM, Chines PS, Gliedt TP, Boehnke M, Abecasis GR, Willer CJ. LocusZoom: regional visualization of genome-wide association scan results. Bioinformatics. 2010;26:2336–7. doi: 10.1093/bioinformatics/btq419. [DOI] [PMC free article] [PubMed] [Google Scholar]
- Pulley J, Clayton E, Bernard GR, Roden DM, Masys DR. Principles of human subjects protections applied in an opt-out, de-identified biobank. Clin Transl Sci. 2010;3:42–8. doi: 10.1111/j.1752-8062.2010.00175.x. [DOI] [PMC free article] [PubMed] [Google Scholar]
- Purcell S, Neale B, Todd-Brown K, Thomas L, Ferreira MA, Bender D, Maller J, Sklar P, de Bakker PI, Daly MJ, Sham PC. PLINK: a tool set for whole-genome association and population-based linkage analyses. American journal of human genetics. 2007;81:559–75. doi: 10.1086/519795. [DOI] [PMC free article] [PubMed] [Google Scholar]
- Roden DM, Pulley JM, Basford MA, Bernard GR, Clayton EW, Balser JR, Masys DR. Development of a large-scale de-identified DNA biobank to enable personalized medicine. Clin Pharmacol Ther. 2008;84:362–9. doi: 10.1038/clpt.2008.89. [DOI] [PMC free article] [PubMed] [Google Scholar]
- Shungin D, Winkler TW, Croteau-Chonka DC, Ferreira T, Locke AE, Magi R, Strawbridge RJ, Pers TH, Fischer K, Justice AE, Workalemahu T, Wu JM, Buchkovich ML, Heard-Costa NL, Roman TS, Drong AW, Song C, Gustafsson S, Day FR, Esko T, Fall T, Kutalik Z, Luan J, Randall JC, Scherag A, Vedantam S, Wood AR, Chen J, Fehrmann R, Karjalainen J, Kahali B, Liu CT, Schmidt EM, Absher D, Amin N, Anderson D, Beekman M, Bragg-Gresham JL, Buyske S, Demirkan A, Ehret GB, Feitosa MF, Goel A, Jackson AU, Johnson T, Kleber ME, Kristiansson K, Mangino M, Mateo Leach I, Medina-Gomez C, Palmer CD, Pasko D, Pechlivanis S, Peters MJ, Prokopenko I, Stancakova A, Ju Sung Y, Tanaka T, Teumer A, Van Vliet-Ostaptchouk JV, Yengo L, Zhang W, Albrecht E, Arnlov J, Arscott GM, Bandinelli S, Barrett A, Bellis C, Bennett AJ, Berne C, Bluher M, Bohringer S, Bonnet F, Bottcher Y, Bruinenberg M, Carba DB, Caspersen IH, Clarke R, Daw EW, Deelen J, Deelman E, Delgado G, Doney AS, Eklund N, Erdos MR, Estrada K, Eury E, Friedrich N, Garcia ME, Giedraitis V, Gigante B, Go AS, Golay A, Grallert H, Grammer TB, Grassler J, Grewal J, Groves CJ, Haller T, Hallmans G, et al. New genetic loci link adipose and insulin biology to body fat distribution. Nature. 2015;518:187–96. doi: 10.1038/nature14132. [DOI] [PMC free article] [PubMed] [Google Scholar]
- Speliotes EK, Willer CJ, Berndt SI, Monda KL, Thorleifsson G, Jackson AU, Allen HL, Lindgren CM, Luan J, Magi R, Randall JC, Vedantam S, Winkler TW, Qi L, Workalemahu T, Heid IM, Steinthorsdottir V, Stringham HM, Weedon MN, Wheeler E, Wood AR, Ferreira T, Weyant RJ, Segre AV, Estrada K, Liang L, Nemesh J, Park JH, Gustafsson S, Kilpelainen TO, Yang J, Bouatia-Naji N, Esko T, Feitosa MF, Kutalik Z, Mangino M, Raychaudhuri S, Scherag A, Smith AV, Welch R, Zhao JH, Aben KK, Absher DM, Amin N, Dixon AL, Fisher E, Glazer NL, Goddard ME, Heard-Costa NL, Hoesel V, Hottenga JJ, Johansson A, Johnson T, Ketkar S, Lamina C, Li S, Moffatt MF, Myers RH, Narisu N, Perry JR, Peters MJ, Preuss M, Ripatti S, Rivadeneira F, Sandholt C, Scott LJ, Timpson NJ, Tyrer JP, van Wingerden S, Watanabe RM, White CC, Wiklund F, Barlassina C, Chasman DI, Cooper MN, Jansson JO, Lawrence RW, Pellikka N, Prokopenko I, Shi J, Thiering E, Alavere H, Alibrandi MT, Almgren P, Arnold AM, Aspelund T, Atwood LD, Balkau B, Balmforth AJ, Bennett AJ, Ben-Shlomo Y, Bergman RN, Bergmann S, Biebermann H, Blakemore AI, Boes T, Bonnycastle LL, Bornstein SR, Brown MJ, Buchanan TA, et al. Association analyses of 249,796 individuals reveal 18 new loci associated with body mass index. Nat Genet. 2010;42:937–48. doi: 10.1038/ng.686. [DOI] [PMC free article] [PubMed] [Google Scholar]
- Tayo BO, Teil M, Tong L, Qin H, Khitrov G, Zhang W, Song Q, Gottesman O, Zhu X, Pereira AC, Cooper RS, Bottinger EP. Genetic background of patients from a university medical center in Manhattan: implications for personalized medicine. PLoS One. 2011;6:e19166. doi: 10.1371/journal.pone.0019166. [DOI] [PMC free article] [PubMed] [Google Scholar]
- Voight BF, Kang HM, Ding J, Palmer CD, Sidore C, Chines PS, Burtt NP, Fuchsberger C, Li Y, Erdmann J, Frayling TM, Heid IM, Jackson AU, Johnson T, Kilpelainen TO, Lindgren CM, Morris AP, Prokopenko I, Randall JC, Saxena R, Soranzo N, Speliotes EK, Teslovich TM, Wheeler E, Maguire J, Parkin M, Potter S, Rayner NW, Robertson N, Stirrups K, Winckler W, Sanna S, Mulas A, Nagaraja R, Cucca F, Barroso I, Deloukas P, Loos RJ, Kathiresan S, Munroe PB, Newton-Cheh C, Pfeufer A, Samani NJ, Schunkert H, Hirschhorn JN, Altshuler D, McCarthy MI, Abecasis GR, Boehnke M. The metabochip, a custom genotyping array for genetic studies of metabolic, cardiovascular, and anthropometric traits. PLoS Genet. 2012;8:e1002793. doi: 10.1371/journal.pgen.1002793. [DOI] [PMC free article] [PubMed] [Google Scholar]
- Wakefield J. A Bayesian measure of the probability of false discovery in genetic epidemiology studies. Am J Hum Genet. 2007;81:208–27. doi: 10.1086/519024. [DOI] [PMC free article] [PubMed] [Google Scholar]
- Wang X, Chua HX, Chen P, Ong RT, Sim X, Zhang W, Takeuchi F, Liu X, Khor CC, Tay WT, Cheng CY, Suo C, Liu J, Aung T, Chia KS, Kooner JS, Chambers JC, Wong TY, Tai ES, Kato N, Teo YY. Comparing methods for performing trans-ethnic meta-analysis of genome-wide association studies. Hum Mol Genet. 2013;22:2303–11. doi: 10.1093/hmg/ddt064. [DOI] [PubMed] [Google Scholar]
- Ward LD, Kellis M. HaploReg: a resource for exploring chromatin states, conservation, and regulatory motif alterations within sets of genetically linked variants. Nucleic Acids Res. 2012;40:D930–4. doi: 10.1093/nar/gkr917. [DOI] [PMC free article] [PubMed] [Google Scholar]
- Weale ME. Quality control for genome-wide association studies. Methods Mol Biol. 2010;628:341–72. doi: 10.1007/978-1-60327-367-1_19. [DOI] [PubMed] [Google Scholar]
- Wen W, Cho YS, Zheng W, Dorajoo R, Kato N, Qi L, Chen CH, Delahanty RJ, Okada Y, Tabara Y, Gu D, Zhu D, Haiman CA, Mo Z, Gao YT, Saw SM, Go MJ, Takeuchi F, Chang LC, Kokubo Y, Liang J, Hao M, Le Marchand L, Zhang Y, Hu Y, Wong TY, Long J, Han BG, Kubo M, Yamamoto K, Su MH, Miki T, Henderson BE, Song H, Tan A, He J, Ng DP, Cai Q, Tsunoda T, Tsai FJ, Iwai N, Chen GK, Shi J, Xu J, Sim X, Xiang YB, Maeda S, Ong RT, Li C, Nakamura Y, Aung T, Kamatani N, Liu JJ, Lu W, Yokota M, Seielstad M, Fann CS, Wu JY, Lee JY, Hu FB, Tanaka T, Tai ES, Shu XO. Meta-analysis identifies common variants associated with body mass index in east Asians. Nat Genet. 2012;44:307–11. doi: 10.1038/ng.1087. [DOI] [PMC free article] [PubMed] [Google Scholar]
- Wen W, Zheng W, Okada Y, Takeuchi F, Tabara Y, Hwang JY, Dorajoo R, Li H, Tsai FJ, Yang X, He J, Wu Y, He M, Zhang Y, Liang J, Guo X, Sheu WH, Delahanty R, Kubo M, Yamamoto K, Ohkubo T, Go MJ, Liu JJ, Gan W, Chen CC, Gao Y, Li S, Lee NR, Wu C, Zhou X, Song H, Yao J, Lee IT, Long J, Tsunoda T, Akiyama K, Takashima N, Cho YS, Ong RT, Lu L, Chen CH, Tan A, Rice TK, Adair LS, Gui L, Allison M, Lee WJ, Cai Q, Isomura M, Umemura S, Kim YJ, Seielstad M, Hixson J, Xiang YB, Isono M, Kim BJ, Sim X, Lu W, Nabika T, Lee J, Lim WY, Gao YT, Takayanagi R, Kang DH, Wong TY, Hsiung CA, Wu IC, Juang JM, Shi J, Choi BY, Aung T, Hu F, Kim MK, Wang TD, Shin MH, Ji BT, Lee YH, Young TL, Shin DH, Chun BY, Cho MC, Han BG, Hwu CM, Assimes TL, Absher D, Yan X, Kim E, Kuo JZ, Kwon S, Taylor KD, Chen YD, Rotter JI, Qi L, Zhu D, Wu T, Mohlke KL, Gu D, Mo Z, Wu JY, Lin X, et al. Meta-analysis of genome-wide association studies in East Asian-ancestry populations identifies four new loci for body mass index. Hum Mol Genet. 2014;23:5492–504. doi: 10.1093/hmg/ddu248. [DOI] [PMC free article] [PubMed] [Google Scholar]
- Willer CJ, Li Y, Abecasis GR. METAL: fast and efficient meta-analysis of genomewide association scans. Bioinformatics. 2010;26:2190–1. doi: 10.1093/bioinformatics/btq340. [DOI] [PMC free article] [PubMed] [Google Scholar]
- Willer CJ, Speliotes EK, Loos RJ, Li S, Lindgren CM, Heid IM, Berndt SI, Elliott AL, Jackson AU, Lamina C, Lettre G, Lim N, Lyon HN, McCarroll SA, Papadakis K, Qi L, Randall JC, Roccasecca RM, Sanna S, Scheet P, Weedon MN, Wheeler E, Zhao JH, Jacobs LC, Prokopenko I, Soranzo N, Tanaka T, Timpson NJ, Almgren P, Bennett A, Bergman RN, Bingham SA, Bonnycastle LL, Brown M, Burtt NP, Chines P, Coin L, Collins FS, Connell JM, Cooper C, Smith GD, Dennison EM, Deodhar P, Elliott P, Erdos MR, Estrada K, Evans DM, Gianniny L, Gieger C, Gillson CJ, Guiducci C, Hackett R, Hadley D, Hall AS, Havulinna AS, Hebebrand J, Hofman A, Isomaa B, Jacobs KB, Johnson T, Jousilahti P, Jovanovic Z, Khaw KT, Kraft P, Kuokkanen M, Kuusisto J, Laitinen J, Lakatta EG, Luan J, Luben RN, Mangino M, McArdle WL, Meitinger T, Mulas A, Munroe PB, Narisu N, Ness AR, Northstone K, O’Rahilly S, Purmann C, Rees MG, Ridderstrale M, Ring SM, Rivadeneira F, Ruokonen A, Sandhu MS, Saramies J, Scott LJ, Scuteri A, Silander K, Sims MA, Song K, Stephens J, Stevens S, Stringham HM, Tung YC, Valle TT, Van Duijn CM, Vimaleswaran KS, Vollenweider P, et al. Six new loci associated with body mass index highlight a neuronal influence on body weight regulation. Nat Genet. 2009;41:25–34. doi: 10.1038/ng.287. [DOI] [PMC free article] [PubMed] [Google Scholar]
- Winkler TW, Justice AE, Graff M, Barata L, Feitosa MF, Chu S, Czajkowski J, Esko T, Fall T, Kilpelainen TO, Lu Y, Magi R, Mihailov E, Pers TH, Rueger S, Teumer A, Ehret GB, Ferreira T, Heard-Costa NL, Karjalainen J, Lagou V, Mahajan A, Neinast MD, Prokopenko I, Simino J, Teslovich TM, Jansen R, Westra HJ, White CC, Absher D, Ahluwalia TS, Ahmad S, Albrecht E, Alves AC, Bragg-Gresham JL, de Craen AJ, Bis JC, Bonnefond A, Boucher G, Cadby G, Cheng YC, Chiang CW, Delgado G, Demirkan A, Dueker N, Eklund N, Eiriksdottir G, Eriksson J, Feenstra B, Fischer K, Frau F, Galesloot TE, Geller F, Goel A, Gorski M, Grammer TB, Gustafsson S, Haitjema S, Hottenga JJ, Huffman JE, Jackson AU, Jacobs KB, Johansson A, Kaakinen M, Kleber ME, Lahti J, Mateo Leach I, Lehne B, Liu Y, Lo KS, Lorentzon M, Luan J, Madden PA, Mangino M, McKnight B, Medina-Gomez C, Monda KL, Montasser ME, Muller G, Muller-Nurasyid M, Nolte IM, Panoutsopoulou K, Pascoe L, Paternoster L, Rayner NW, Renstrom F, Rizzi F, Rose LM, Ryan KA, Salo P, Sanna S, Scharnagl H, Shi J, Smith AV, Southam L, Stancakova A, Steinthorsdottir V, Strawbridge RJ, Sung YJ, Tachmazidou I, et al. The Influence of Age and Sex on Genetic Associations with Adult Body Size and Shape: A Large-Scale Genome-Wide Interaction Study. PLoS Genet. 2015;11:e1005378. doi: 10.1371/journal.pgen.1005378. [DOI] [PMC free article] [PubMed] [Google Scholar]
- Yang J, Ferreira T, Morris AP, Medland SE, Madden PA, Heath AC, Martin NG, Montgomery GW, Weedon MN, Loos RJ, Frayling TM, McCarthy MI, Hirschhorn JN, Goddard ME, Visscher PM. Conditional and joint multiple-SNP analysis of GWAS summary statistics identifies additional variants influencing complex traits. Nat Genet. 2012;44:369–75. S1–3. doi: 10.1038/ng.2213. [DOI] [PMC free article] [PubMed] [Google Scholar]
- Yang J, Lee SH, Goddard ME, Visscher PM. GCTA: a tool for genome-wide complex trait analysis. Am J Hum Genet. 2011;88:76–82. doi: 10.1016/j.ajhg.2010.11.011. [DOI] [PMC free article] [PubMed] [Google Scholar]
Associated Data
This section collects any data citations, data availability statements, or supplementary materials included in this article.