Abstract
Ultrasound image quality is often inherently limited by the physical dimensions of the imaging transducer. We hypothesize that, by collecting synthetic aperture data sets over a range of aperture positions while precisely tracking the position and orientation of the transducer, we can synthesize large effective apertures to produce images with improved resolution and target detectability. We analyze the two largest limiting factors for coherent signal summation: aberration and mechanical uncertainty. Using an excised canine abdominal wall as a model phase screen, we experimentally observed an effective arrival time error ranging from 18.3 ns to 58 ns (root-mean-square error) across the swept positions. Through this clutter-generating tissue, we observed a 72.9% improvement in resolution with only a 3.75 dB increase in side lobe amplitude compared to the control case. We present a simulation model to study the effect of calibration and mechanical jitter errors on the synthesized point spread function. The relative effects of these errors in each imaging dimension are explored, showing the importance of orientation relative to the point spread function. We present a prototype device for performing swept synthetic aperture imaging using a conventional 1-D array transducer and ultrasound research scanner. Point target reconstruction error for a 44.2 degree sweep shows a reconstruction precision of 82.8 μm and 17.8 μm in the lateral and axial dimensions respectively, within the acceptable performance bounds of the simulation model. Improvements in resolution, contrast and contrast-to-noise ratio are demonstrated in vivo and in a fetal phantom.
I. Background
A fundamentally limiting factor in the quality and field of view (FOV) of an ultrasound image is the extent of the transmitting and receiving apertures. Aperture size is commonly limited by the cost and complication of constructing large channel count arrays. Synthesizing a large aperture by moving a smaller active aperture, either electronically or mechanically, can overcome this limitation given precise knowledge of the relative aperture positions.
The first B-mode ultrasound images were formed using a single focused element connected to a moving stage or an articulating arm that swept the probe over the scanning area to form an image, enlarging the FOV from a single scan line to a scan plane [1]. For a phased array scanner that electronically steers the transmit beam, the FOV is determined by the angular sensitivity of the transducer elements, each of which is roughly modeled as a point source radiating a beam within a given opening angle in front of the transducer. The FOV for phased arrays can be extended by registering and stitching together multiple images to form a panoramic view of a target area even without the use of an external positioning device [2]. Linear arrays electronically sweep an active aperture across the available elements to form an image, providing precise knowledge of the active aperture position relative to the rest of the array. By performing a phased array or parallel receive scan at each aperture position, images with overlapping FOVs are created and incoherently summed together to reduce speckle variance, a technique known as spatial compounding [3].
Motion has been used to extend the ultrasound image into the elevation dimension as well by translating or rocking the array, each 2-D axial-lateral image plane forming one slice of the final image. Sparse aperture techniques increase the frame-rate of such a scan so that full 3-D images can be acquired in real-time [4]. In addition to pulse-echo imaging schemes, motion has been used to compute tomographic images using an array of transducers swept around a target, producing transmission projections at each aperture position that can be reconstructed into a volume image [5].
In contrast to stacking image planes to extend FOVs or incoherently compounding overlapping regions to reduce speckle, synthetic aperture techniques employ the coherent summation of recorded backscattered RF signals in post-processing to improve image quality [6], [7]. Receive channel data are collected for multiple transmit events with a known transmit and receive geometry. The time-of-flight of the propagating wave is calculated for every imaging point and receiving channel in order to create a focused image for each transmit event. These low-resolution RF subimages are combined to form a high-resolution image that is focused in both transmit and receive at all points throughout the image. Different transmit beam profiles – focused, plane or diverging waves – trade off between signal-to-noise ratio, effective aperture size, and lateral field of view [8]–[10].
While the axial resolution of the image is determined by the transmitted pulse length, the transverse resolution is determined by the extent of the transmit and receive apertures. The imaging system is described as a spatial bandpass filter and the filter response viewed in the frequency domain, or “k-space” [11]. This framework can be used to predict the response of the imaging system to operations such as translation and rotation for arbitrary array configurations. K-space theory is therefore useful in designing synthetic aperture configurations and will be used in this paper to describe the proposed synthesized aperture.
The “co-array”, the 1-D equivalent to the k-space description, has been used to implement a synthetic aperture scan with the same resolution as a full-aperture phased array scan using a reduced channel count. By strategically choosing transmit and receive sub-apertures electronically translated across the array and re-weighting the final contributions from each, the same k-space coverage and therefore resolution and speckle texture can be attained [12]. Translating and rotating the array allows new regions of k-space to be sampled, increasing the resolution of the system. High-resolution 3-D images have been formed by mechanically sweeping [13] or rocking [14] a linear array through the elevation dimension and combining a volume formed by each using a virtual source in elevation. Volumetric images can also be formed by rotating a linear array using diverging transmit beams [15] or using a helical scan geometry with a single focused element and virtual sources in both the lateral and elevation dimensions [16].
Previous work has studied image quality metrics as a function of aperture size and concluded that using large apertures in vivo can result in improved contrast and resolution even in the presence of clutter [17]. At the large depths often required for abdominal and fetal imaging, an extended aperture has the potential to greatly improve imaging performance in challenging cases. We propose further improving image quality using synthetic aperture methods and a mechanically-swept transducer tracked by an external device, allowing for interrogation of an extended region in k-space to form large, coherent apertures. In contrast to previous work on volumetric imaging, the focus of this method is to extend the effective aperture size and improve image quality in the plane of the physical array. This method of performing synthetic aperture imaging is similar to the methods employed in sonar and radar [18]. Unlike techniques that perform post-processing to achieve super-resolution through deconvolution [19] or sub-pixel motion [20], the improved resolution from the swept aperture approach remains diffraction-limited by the synthesized aperture size.
We have previously presented studies of expected aberration effects [21] and robotic positioning [22] in the context of swept synthetic aperture imaging. Initial phantom and in vivo experiments have been recently presented [23]. This paper demonstrates a full implementation of the technique, describing the theory behind the swept synthetic aperture approach in Section II and the corresponding experimental methods used in Section III. Two practical concerns in implementation of the technique, aberration and mechanical stability, are explored in Sections IV-A and IV-B. Feasibility of the technique is demonstrated experimentally on phantom and in vivo targets in Section IV-C. Section V concludes with a discussion of extensions and limitations of the proposed technique.
II. Theoretical Approach
The proposed swept synthetic aperture imaging system is detailed in Fig. 1. A phased array transducer is mechanically swept over the target in an arc of a fixed radius, and the angular position is tracked by a high-precision rotary encoder. This motion is described as having one degree of freedom around a remote center of motion. The transformation matrix between the axis of rotation and the imaging coordinate system is known and is used to calculate a relative position in space of the transducer throughout the sweep. A diverging wave is produced from the center of the array at each position, and backscattered echoes are recorded on all receive channels. The echo data and position information are provided to the receive beamforming system to produce a low-resolution subimage from each position. Given precise knowledge of the position of the transmit and receive elements, each RF subimage created covers the same FOV while the transducer is mechanically scanned to produce different angular interrogations of the target. The RF subimage can be coherently summed with the accumulated RF image from previous transducer positions to produce a high-resolution output image.
Fig. 1.
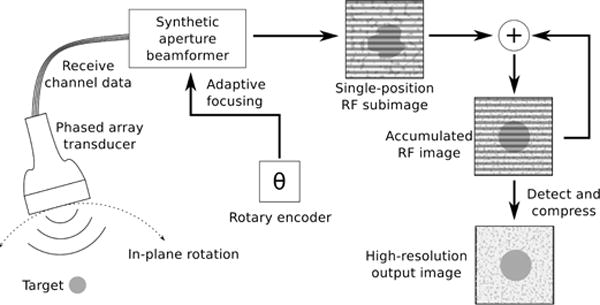
Diagram of proposed swept synthetic aperture imaging system. A phased array transducer collects 2-D image data sets at every position using diverging waves (virtual source at or behind the array). Angular position tracking and a known transformation matrix between the axis of rotation and aperture allow for beamforming on a common coordinate system from all positions, accumulating a high-resolution image from a large synthetic aperture.
While more overlap between reconstructed subimages from the different aperture positions is desirable, the spatial overlap does not adequately describe the image quality improvement. It is necessary to examine the k-space description of the proposed synthetic aperture to predict the improvement in resolution. Fig. 2(a,b) shows a Field II simulation [24] [25] of a point target located at 10 cm depth imaged using a phased array (0.32 mm pitch, 64 elements) and a focused emission with a center frequency of 3.0 MHz. The top image shows the −20 dB contour of k-space calculated using the two-dimensional Fourier transform of the point spread function (PSF), while the bottom image shows the envelope-detected point target image. The PSF is approximately separable in the axial and lateral dimensions, with the shape of the Gaussian-weighted sinusoid transmit pulse in the axial dimension and a sinc2 shape in the lateral dimension corresponding to the product of the Fourier transforms of the rectangular transmit and receive apertures. Looking only in the positive temporal frequency half-plane, k-space is therefore Gaussian in the axial frequency dimension and approximately triangular in the lateral frequency dimension, shown by the profiles in gray in Fig. 2(a,c). The product of these two shapes gives a “teardrop” shape that describes the axial and lateral spatial frequencies imaged by the system.
Fig. 2.
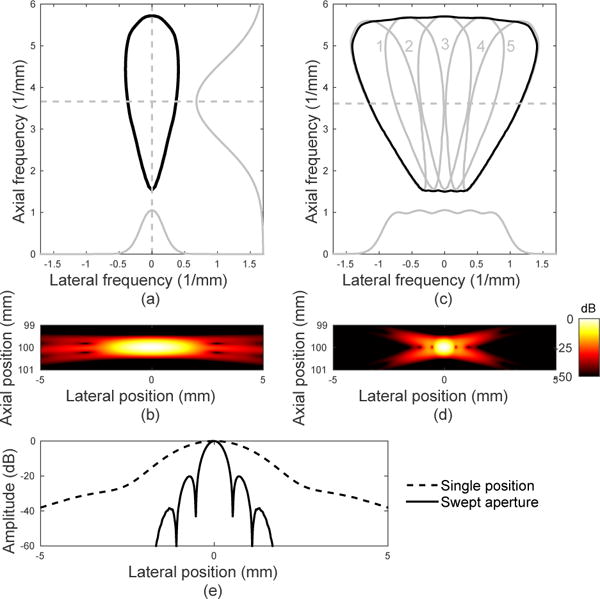
(a) K-space description (−20 dB contour) and (b) simulated PSF for a single aperture position. Slices from axial and lateral k-space are shown in gray. (c) K-space description (individual in gray and summed in black) and (d) PSF for five aperture positions, rotating the transducer about the target point with overlap. The larger lateral k-space extent provides improved lateral resolution of the point target, while overlapping regions provide an improved signal-to-noise ratio. (e) Lateral slice through PSF at the focus (100 mm).
As the transducer rotates about a target, the k-space region covered by the imaging system rotates about the origin accordingly. Fig. 2(c) shows k-space for five aperture positions as the transducer is rotated about the point target with angles of [−12, −6, 0, 6, 12] degrees at a fixed radius of 10 cm. Each shift roughly corresponds to half the aperture length, creating significant overlap between consecutive imaging positions. Due to the Fourier transform relationship, a rotation of the imaging frame corresponds to a rotation of k-space, represented by the five numbered teardrop shapes outlined in gray. The linearity of the imaging system means that the sum of these individual shapes gives the total k-space representation, shown in black, covering a larger lateral spatial frequency extent than a single position. This total extent determines the highest spatial frequencies present in the image and therefore dictates resolution, as shown by the simulated point target in Fig. 2(d).
The relative amplitudes of the spatial frequencies present, the topography of k-space, determines the texture of imaged targets. For example, a system with only high lateral frequency components would represent a point target as a sinusoidal oscillation rather than a sharp point. It is also possible to weight the data from individual aperture or element positions to reshape k-space, for example weighting the apertures numbered 1 through 5 with the vector [1, 2, 3, 2, 1] to emphasize low lateral spatial frequencies and create a more conventional lateral transfer function with a triangular shape rather than the trapezoid shown in gray in Fig. 2(c). While it is theoretically possible to completely sample a region of k-space with non-overlapping apertures, redundant interrogations from overlapping interrogations increase the signal-to-noise ratio at each spatial frequency.
III. Methods
A. Experimental system
The device used to prescribe the 1-degree-of-freedom rotational motion of the transducer is shown in Fig. 3. The rotating axle is constructed from a solid 1.25”-diameter aluminum rod inserted into a pair of mounted bearings, which are rigidly mounted onto an acrylic block. One end of the rod is coupled to a HB6M hollow bore optical encoder (US Digital, Vancouver, WA) that is connected to a Beaglebone Black (BeagleBoard.org, Richardson, TX) with a custom interface board to measure motion at a resolution of 10000 counts per revolution in response to 1 μs trigger pulses at a rate of 1 kHz. The other end is connected to a three-piece frame made of 1.5″×3″ 80/20 aluminum parts and a block of acrylic milled to firmly hold the ATL P4-2 transducer.
Fig. 3.
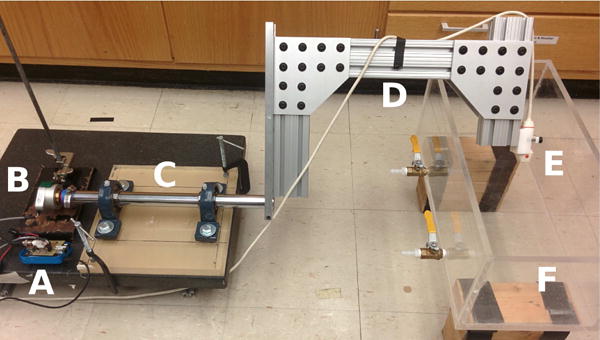
Experimental setup with rotating arm. The Beaglebone Black (A) synchronizes the acquisition with the scanner and connects to a rotary encoder (B) attached at the base of the rotating axle (C). The aluminum frame (D) holds the phased array transducer (E) at a fixed radius of rotation and allows for manual rotation about the axis defined by the axle. The imaging target is placed in a tank of fluid (F) to couple the transducer and the object without contact.
The mechanical transfer function to describe the rotation of the transducer in space given an encoder measurement was found using the Faro Edge measuring arm (FARO Technologies UK Ltd, United Kingdom). A least squares fit of a plane to points on the transducer face provided an origin and orientation with the axial dimension normal to the face. A circular fit of points around the end of the axle provided a center and normal direction for the axis of rotation. The calibration was refined empirically using wire-target data for use in subsequent experiments. The center of rotation was measured to be 10.2 cm from the face of the transducer at a horizontal distance of 53.0 cm from the base of the device.
RF channel data were acquired using a Verasonics Vantage ultrasound system (Verasonics Inc., Kirkland, WA) and the ATL P4-2 transducer. Each swept aperture acquisition was prefaced by a fully-sampled single-position synthetic aperture acquisition, transmitting diverging waves from each element of the transducer and recording channel data on all elements. The angular position of the single-position acquisition was used to define the orientation of the swept aperture image. The swept aperture acquisition was started by manual motion of the rotating arm. Image frames were acquired by firing 12 elements using a virtual source behind the array at a pulse repetition frequency of 1 kHz for a duration of one second. The arm was swept over a region between 30 and 45 degrees without a predefined motion profile during the one second acquisition period. Receive channel data and the recorded motion profile were stored for offline processing.
The targets imaged were submerged in an aqueous solution with a sound speed of 1540 m/s to avoid deflection of the transducer due to contact. Plastic monofilament targets with a diameter of 0.2 mm were imaged in a solution of 1-propanol [26]. A CIRS Model 068 fetal phantom (CIRS Inc., Norfolk, VA) was used to image structures in the fetal brain in the same 1-propanol solution. In vivo human liver was imaged by submerging the volunteer in a salt water solution [27] positioned for a typical transverse imaging slice.
Position-dependent beamforming was performed using the calibrated geometric description of the system. The transducer, a plane of elements centered at the origin with normal vector in the axial direction, was rotated about an arbitrary axis pointed along the mechanical axle. The transducer element locations P = (x, y, z, 1)T were rotated about the axis using standard transformation matrices
| (1) |
where T is the calibrated translation from the transducer origin to the axle origin, Rx and Ry are the calibrated rotations about their respective axes to align the coordinate system of the array with the axis of rotation of the device, and Rz is the measured rotation from the rotary encoder.
Using the transformed transducer element locations Prot = (x′, y′, z′, 1)T, the channel data were focused to produce a 2-D image slice in the plane of rotation for a subset of transmit events using standard diverging wave synthetic aperture focusing. The time-of-flight between the transmitting element or virtual source located at , the in-plane imaging point located at , and the receiving element located at , at a speed of sound c is given by
| (2) |
If the sweep were performed at a constant velocity, the trapezoidal profile shown in Fig. 2(c) would be produced. The experimental data instead contain regions of acceleration and deceleration, causing unequal weighting in k-space that tends to emphasize high spatial frequencies. A subset of 100 frames representing data collected at equally-spaced angular positions was selected from each scan in order to remove this effect before summation to produce a high-resolution final image. For phantom and in vivo images, a triangular weighting was applied to produce a synthetic transmit apodization in order to create a more conventional PSF shape, as described in [23]. In the resulting images, contrast and contrast-to-noise ratio (CNR) [28] were measured as
| (3) |
| (4) |
where μo and μi are the mean values and σo and σi are the standard deviations inside and outside the region of interest.
B. Aberration characterization
A second setup was used to collect ex vivo data for the purpose of evaluating the effectiveness of synthesizing large apertures in the presence of clutter from aberration and reverberation. The Siemens ACUSON SC2000 ultrasound system (Siemens Medical Solutions USA, Inc., Mountain View, CA) and 4Z1c volumetric transducer (0.4 mm pitch, 1.92 cm × 1.44 cm aperture) were used with a custom imaging sequence to collect sub-aperture receive channel I/Q data for 3×3 element groups across the lateral and elevation extents of the array [29]. Acquired data were stored with corresponding transducer positions for offline processing. A preliminary analysis of this data set has been previously presented [21] and is extended here.
Imaging was performed in a tank filled with the 1-propanol solution described above. The imaging target was a custom agar phantom with a 0.25-mm-diameter sapphire embedded inside, located 7.1 cm from the transducer face. The transducer was mounted on a Newport URS50 rotation stage coupled to a three-axis Newport UTM100/ILS100 translation stage (Newport Corporation, Irvine, CA), allowing precise position and orientation control of the transducer (5 μm on-axis accuracy, 1.5 μm unidirectional repeatability on each linear axis and 0.03 degree accuracy, 0.002 degree unidirectional repeatability in rotation). The translation/rotation stage was used in place of the rotating arm in this experiment to isolate the effects of aberration from any mechanical uncertainty introduced by the arm. The transducer was stepped over 101 positions spanning 30.8 degrees, 0.305 degrees per step, translating and rotating the array to follow an arc with a radius of 7.1 cm and place the target at the center of the sweep. The importance of sufficient angular sampling has been explored in [21]. At each transducer position, each laterally-centered 3×3 sub-aperture through elevation was used to transmit a diverging wave without apodization. This acquisition sequence was chosen to resemble the continuous sweep performed with the experimental rotating arm, using the elevation dimension in transmit only to increase the electronic signal-to-noise ratio.
Immediately after the point target control acquisition and without moving the target fixture, the same sequence was repeated with the addition of ex vivo tissue directly in front of the transducer. Approximately 10 cm × 20 cm (2 cm thick) of canine anterior abdominal wall was harvested, consisting of skin (hair removed), subcutaneous fat, fascia, abdominal muscle (including rectus abdominus and transverse abdominus) and peritoneum. Adipose tissue underlying the peritoneum was removed. The overall thickness and elasticity were conserved by mounting the tissue immediately following excision onto a plastic frame and submerging the structure in the tank. The frame was designed with a curve to match the arc swept by the transducer to maintain contact between the array and the tissue, but a separation on the order of 1 mm may have been present at certain scan locations due to variations in the tissue height. The depth of the point target relative to the transducer remained the same as in the fluid path experiment. Data through the aberrating layer from positions 31–38 (out of 101) were lost due to technical malfunction and are omitted from the control case to provide fair comparison.
An axial-lateral plane for 2-D PSF analysis was chosen by finding the location of the peak value in the elevation dimension from the envelope-detected data. Axial-lateral RF PSFs were extracted from the beamformed data sets in this plane using a 5 mm axial × 11 mm lateral window. K-space content was calculated using a two-dimensional Fourier transform of the extracted RF PSF. Lateral PSF profiles were taken from the center of the point target and were normalized to the peak brightness value. The full-width at half-maximum (FWHM) was measured as the distance between the −6 dB points of the lateral profile. Cystic resolution, a contrast-based measure of off-axis scattering at the center of a hypothetical lesion, was calculated as the ratio of energy in the 2-D PSF outside a circular region of radius r compared to the total energy of the PSF [30]:
| (5) |
where P (x, z) is the envelope signal and M(x, z) is a mask function with value 0 inside the lesion and 1 outside.
To help explain the observed PSF, the effective phase screen between each transducer element and the target was estimated using the arrival time of the recorded wave [31], [32]. The use of a matrix transducer allows for spatial resolution of the aberrating layer in both the lateral and elevation dimensions. Regularized, weighted linear least squares estimation was used to identify the wave arrival time robustly in the presence of noise and clutter. The observation vector Y is described as a linear sum of individual element delays τ selected by the model matrix H and weighted by W. The model matrix consists of differences between pairs of delays, measured by cross-correlation between elements, and an estimate of absolute arrival time for each element, measured by cross-correlation with a model waveform. A two-dimensional regularization term Γ is included to enforce spatial smoothness of estimates across the aperture using a second-order central finite difference. The estimates for each aperture position are given by
| (6) |
This process was repeated for each transducer position for both the control and aberrating layer imaging setups.
C. Mechanical simulation
Simulations were performed to analyze the effect of mechanical precision on the reconstructed image and to compare to the observed image quality metrics for the experimental system. Mechanical errors fall into two main categories: jitter error and calibration error. Jitter error is a unique random error present in each frame due to random uncertainty in the measurement device or unaccounted motion in the rigid arm. Calibration error is a single error present in the transformation matrix used to relate the coordinate system of the imaging plane to the rotary encoder measurement. Both errors are expected to be present in a mechanical system to varying degrees, so we examine the effects of both types of error on the reconstructed image quality.
The position of the simulated point target in the global coordinate frame Pglobal = (x, y, z, 1)T is described by two standard spatial transformations applied to the observed position of the point target in the initial imaging frame P0:
| (7) |
B0 represents the initial position of the arm as reported by the tracking device, and X represents the calibration from the end of the arm to the origin of the imaging plane.
Subsequent positions of the arm, Bi, are described as a rotation Mi within the imaging plane in relation to the initial position:
| (8) |
where errors are present in both the tracking device, ΔB0, and the calibration matrix, ΔX.
The observed point target for each frame then suffers additional tracking (jitter) error ΔBi:
| (9) |
Each type of error was allowed to vary in all 6 degrees of freedom, simulating arbitrary unknown translation and rotation of the aperture as it was swept over 45 degrees in 2.5-degree increments at a radius of 10 cm. Errors were tested up to 0.2 mm translation and 0.2 degrees rotation for ΔB, and 3 mm translation and 3 degrees rotation for ΔX. These represent plausible bounds for the experimental device we seek to construct. For each combination of error magnitudes, the results from 20 error realizations were averaged. The spread of the point cloud formed by imaging over the sweep of the transducer is described by the reconstruction precision in each dimension (axial, lateral, elevation) [33]:
| (10) |
where is the average point location of the reconstructions. An ideal reconstruction precision would be zero in all dimensions, where there is no uncertainty in positioning and therefore no observed motion of the imaged point between frames.
The same transducer positions and error realizations were used with Field II to analyze the impact on image quality observed from a point target. The FWHM and the cystic resolution at a radius of 0.65 mm, between the main lobe and first side lobes for the ideal PSF, were measured for each case and averaged over the 20 error realizations. For comparison, reconstruction precision, FWHM and cystic resolution were measured from a set of images of a wire target acquired using the experimental system. In this case, the transducer was swept over 44.2 degrees and 100 subimages were produced.
IV. Results
A. Aberration analysis
The proposed swept aperture method requires coherent alignment of the backscattered echoes from multiple transmit and receive positions to successfully improve the PSF. Aberration acts as a partially-correlated random phase shift that may cause destructive interference and limit the gains that can be made using a swept synthetic aperture. To evaluate the impact of an ex vivo aberrating layer, PSFs for a single aperture position and swept aperture are shown with and without the layer in the imaging path in Fig. 4.
Fig. 4.
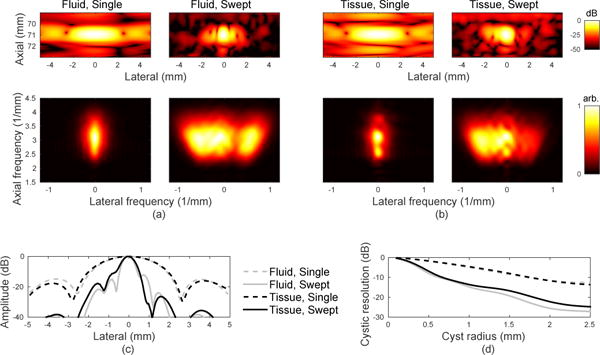
Improvements in PSF with swept synthetic aperture are demonstrated even in the presence of aberration. (a) Enevelope-detected PSF and k-space representation for the control (fluid path) experiment for a single aperture position and the swept aperture. The k-space representation shows an extended lateral region of support in the swept aperture case. (b) Envelope-detected PSF and k-space representation for the tissue/fluid path experiment for a single aperture position and the swept aperture. Due to technical malfunction the data set is missing transmit events 31–38 (out of 101), so the corresponding events were removed from (a) as well. Higher side lobes corresponding to the region of destructive interference in k-space are visible compared to the control case. (c) Lateral slice from PSF for each case taken at a depth of 71 mm. (d) Cystic resolution for a range of radii for all four PSFs.
The single-position images demonstrate worse resolution than a conventional image would because of the single-element transmit aperture used to produce each subimage. To fairly compare the effect of aberration between the control and the tissue cases, the data corresponding to the missing transmit events in the tissue case have also been removed from the control case, creating an asymmetry in the PSF and a region of lower amplitude in k-space. There is sufficient spatial redundancy in the data to complete the aberration analysis even without these transmit events. It should also be noted that the top agar interface produces reverberation clutter on the order of −40 dB with respect to the point target and for the following analysis is considered the noise floor for the extracted PSF.
Image metrics that describe the changes in the PSF between each case are given in Table I. As expected, resolution measured by FWHM greatly improves between the single and swept apertures in each case due to the larger effective aperture. In the presence of aberration, the resolution improvement is only 72.9% compared to 77.0% in the control case. Larger differences are seen in the behavior of the side lobes, measured from the left half of the PSF where the worst distortion is observed. The first side lobe of the swept aperture PSF is raised by 3.75 dB in the tissue compared to the control case. The second side lobe is also raised by 3.84 dB. Cystic resolution over the displayed range of radii demonstrates the importance of resolution to target resolvability. Each small plateau in the curve represents a radius between lobes of the PSF, while dips occur when a sidelobe moves into the cyst region. Comparing the tissue case to the control case for the swept synthetic aperture, the cystic resolution only begins to vary on the order of 1–2 dB around the location of the second sidelobes. This suggests that while significant image improvements can be achieved, the image may suffer from a raised noise floor due to additional off-axis scattering.
Table I.
Image metrics for PSFs with and without aberration
| Fluid | Tissue | |||
|---|---|---|---|---|
| Single | Swept | Single | Swept | |
|
| ||||
| FWHM (mm) | 3.01 | 0.69 | 3.15 | 0.85 |
| First sidelobe (dB) | −14.87 | −15.01 | −17.73 | −11.26 |
| Second sidelobe (dB) | – | −21.62 | – | −17.78 |
The difference between the k-space representations for the control and tissue cases in Fig. 4(b) and (d) is explained by the effective phase screen created by the aberrating layer, shown in Fig. 5. The right side of k-space, corresponding to the left side (beginning) of the sweep, shows significantly lower amplitude when the aberrating layer is present, indicating destructive interference or reduced signal amplitude. The phase profile of the aberrating layer shows a matching asymmetry, creating large distortions in the beginning of the sweep compared to the later positions. The RMS error on the left side of the sweep was 58.0 ns, compared to 18.3 ns in the center region and 30.2 ns for the smaller peak on the right side. This result motivates finding a good acoustic window in vivo and suggests that while it may be beneficial to identify and correct or discard subsets of data that have been more severely distorted, it may not always be necessary in order to produce an improved image.
Fig. 5.
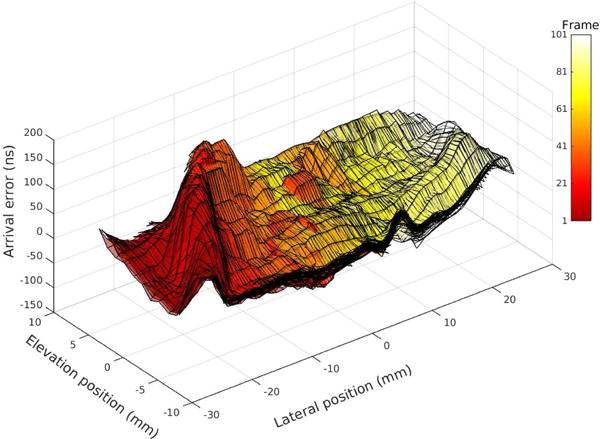
Aberration is observed as a spatially varying but stationary phase screen. Arrival time error was estimated across all lateral and elevation receiving elements at each swept aperture position, providing independent aberration maps (represented by the color scale in the figure). All maps are overlaid, demonstrating consistent estimates across all measurement locations. Error is defined as the difference from the median arrival time.
B. Mechanical analysis
One important difference between the two types of mechanical errors is the shape of the reconstructed point cloud made up of the observed point target locations from each position. The ΔB jitter error is expected to produce a normal cloud of points in all dimensions, each point location independent of the others. The ΔX calibration error results in correlated errors in each frame, producing an arc of points with a particular orientation and extent. The results for the two types of errors are presented separately due to these fundamental differences. Even broken into translation and rotation error, different realizations of error with the same total magnitude may preferentially affect different aspects of the resulting image quality, leading to variability in the simulation plots. Each pixel represents the average behavior, while individual error realizations may produce a higher or lower value of the image metric based on its six components. Despite this averaging, the FWHM plots do not show the smooth behavior observed in the other plots. The FWHM is limited in its ability to describe performance when the PSF is distorted, varying erratically as side lobes rise and fall past the −6 dB level.
The results for the ΔB error are shown in Fig. 6 and the results for the ΔX error are shown in Fig. 7. For ΔB, the dominant effect of jitter error on reconstruction precision appears in the lateral and elevation dimensions, approximately double the effect on the axial dimension. All three dimensions show low sensitivity to translation error within these bounds compared to rotation error. Cystic resolution follows the same trend as lateral FWHM. Both metrics are degraded by a factor of 2 (or 6 dB) by a combined error of 0.06 degrees and 60 μm.
Fig. 6.
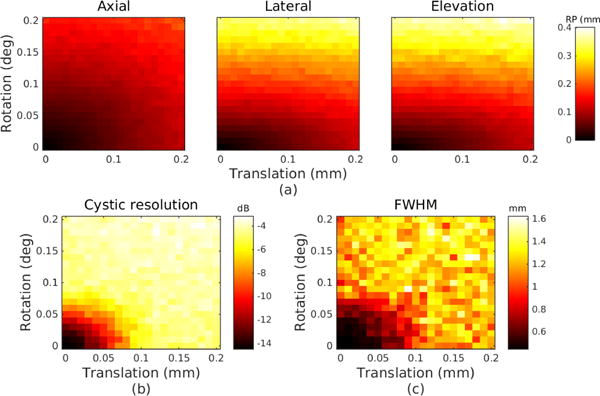
Simulated error due to jitter error ΔB. Note the upper bound on applied error magnitude is 0.2 mm and 0.2 degrees, compared to 3 mm and 3 degrees in Fig. 7. (a) Reconstruction precision in millimeters for each dimension. (b) Cystic resolution in dB with r=0.65 mm. (c) Lateral FWHM in millimeters.
Fig. 7.
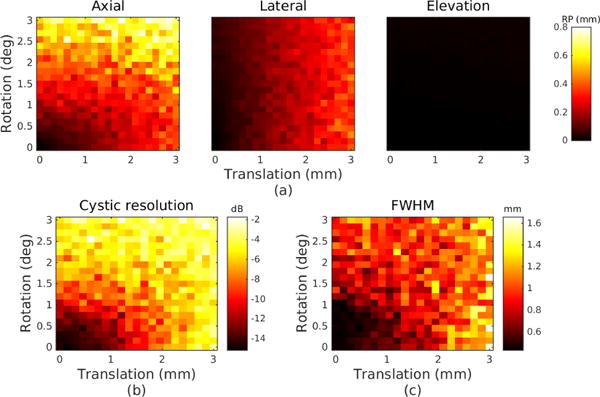
Simulated error due to calibration error ΔX. Note the upper bound on applied error magnitude is 3 mm and 3 degrees, compared to 0.2 mm and 0.2 degrees in Fig. 6. (a) Reconstruction precision in millimeters for each dimension. (b) Cystic resolution in dB with r=0.65 mm. (c) Lateral FWHM in millimeters.
For ΔX, the dominant effect of calibration error on reconstruction precision appears in the axial dimension and is a result of both rotation and translation errors. Lateral reconstruction precision worsens primarily with increasing translation error. The elevation reconstruction precision, due to the axial-lateral nature of the proposed sweep, shows little error in all cases. The FWHM in this case does not show the same sensitivity as the cystic resolution because the PSF is skewed with calibration error, affecting the extent of side lobes but not necessarily raising the magnitude above the −6 dB level. The cystic resolution shows a degradation of 6 dB at 1.05 mm and 1.05 degrees of error. As expected, the swept aperture imaging system is more tolerant to calibration error than jitter error. Calibration error, since it is constant throughout the sweep, can steer the reconstructed image without significant distortion, unlike jitter error.
Results from the experimental wire target are shown in Fig. 8. Using a 44.2 degree sweep, the −6 dB resolution of the swept aperture point target was 0.45 mm. In 2-D imaging, the elevation dimension (within the slice thickness) is projected into the in-plane image, so only axial and lateral reconstruction precision can be measured experimentally. The reconstruction precision was 82.8 μm in the lateral dimension and 17.8 μm in the axial dimension, or 18.3% of the lateral PSF and 3.5% of the axial wavelength. At a radius of 0.65 mm, the cystic resolution was −12.04 dB. These results show favorable performance compared to the cystic resolution and FWHM simulation plots, matching 0.02 mm and 0.02 degrees of jitter error or 0.6 mm and 0.6 degrees of calibration error. In reality, the magnitude of each type of error is likely lower because the observed imaging performance is a combination of the two effects.
Fig. 8.
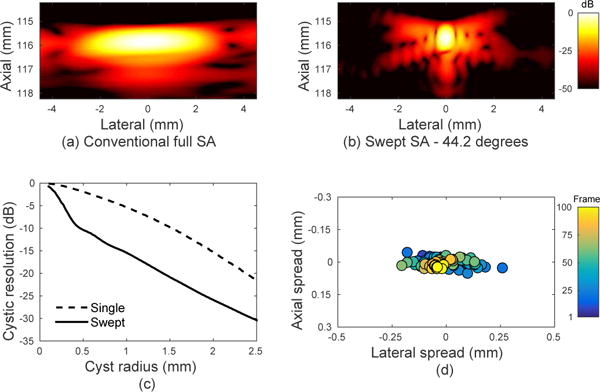
Experimental PSFs from the rotating arm device demonstrate sufficient calibration and mechanical precision to form high-resolution swept synthetic aperture images. (a) Single position fully-sampled synthetic aperture. (b) Swept synthetic aperture image from a 44.2 degree sweep. (c) Cystic resolution as a function of cyst radius based on the two PSFs. (d) Enlarged view of the location of the peak in each PSF subimage. The colored points represent the transducer position along the sweep path.
C. Phantom and in vivo demonstration
In order to demonstrate experimental feasibility, we present two swept synthetic aperture data sets using the rotating arm of Fig. 3. Image quality metrics are compared for the conventional full synthetic aperture and swept synthetic aperture methods in Table II. Paired images for the fetal phantom are shown in Fig. 9 for a swept aperture scan of 41.6 degrees. The branches of the ventricles are obscured by off-axis scattering and poor resolution in the original image. These structures are clearly visible in the swept aperture image due to the improved resolution. The skull, the bright outer layer of the phantom, is much better defined in the swept aperture image. The finer speckle texture throughout the image indicates the inclusion of a wider range of spatial frequency information, while the improved edge resolution and new details visible indicate proper reconstruction of the image based on the angular position information. Contrast and CNR are improved for the central anechoic region in the swept synthetic aperture case.
Table II.
Experimental image quality improvements between conventional full synthetic aperture (FSA) and swept synthetic aperture (SSA)
| Target | Contrast (dB) | CNR | ||
|---|---|---|---|---|
| FSA | SSA | FSA | SSA | |
| Fetal phantom | −13.02 | −16.49 | 1.03 | 1.28 |
|
| ||||
| Large vessel | −5.52 | −12.32 | 0.68 | 1.33 |
| Medium vessel | −1.44 | −4.05 | 0.16 | 0.55 |
| Small vessel | −1.07 | −8.54 | 0.12 | 1.04 |
Fig. 9.
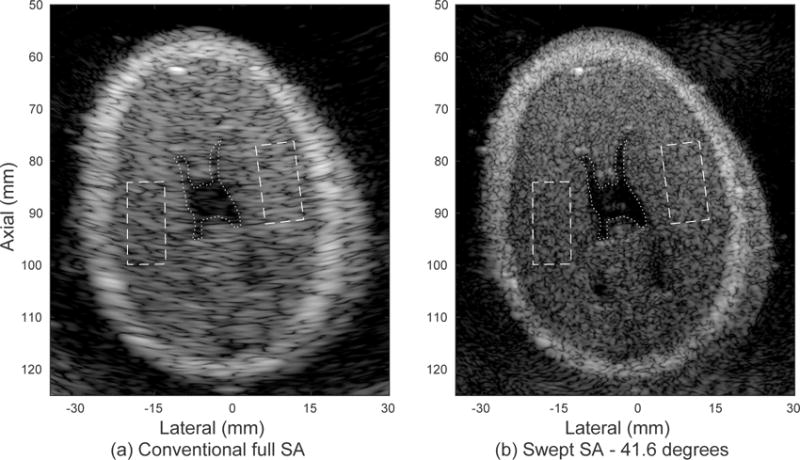
Experimental images of the brain in a fetal phantom produced with the rotating arm system demonstrate improved resolution and detectability metrics, given in Table II. (a) Single position fully-sampled synthetic aperture image. The dotted line indicates a region of interest inside the anechoic region and the dashed lines indicate regions in the surrounding tissue. (b) Swept synthetic aperture image over a span of 41.6 degrees. The displayed dynamic range is 60 dB.
Fig. 10 shows results of in vivo liver imaging for a swept aperture scan of 35.0 degrees. The abdominal layer, the liver and the vasculature throughout the image all show the expected improvement in resolution. The extent of the sweep was limited by the available acoustic window defined by the ribs, which will vary among patients and imaging targets. As in the phantom image in Fig. 9, the speckle texture is finer and vessel boundaries demonstrate improved lateral resolution for the swept synthetic aperture image. Both contrast and CNR, shown in Table II, drastically increase for the three anechoic targets outlined, reflecting improved visibility. The “large”, “medium” and “small” targets are shown in the inset from top right, counterclockwise. The smallest target is on the order of the original lateral speckle size and is only clearly identified in the swept synthetic aperture image.
Fig. 10.
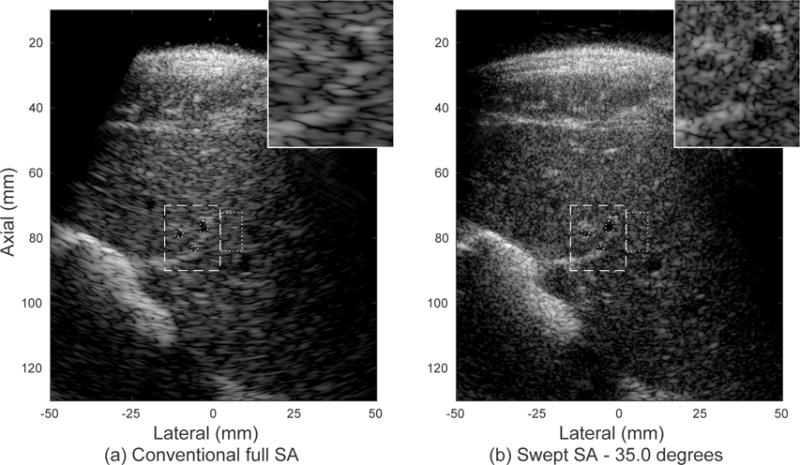
Experimental images of in vivo human liver and vasculature produced with the rotating arm system demonstrate improved resolution and detectability metrics, given in Table II. The inset image (dashed region) shows improved visualization of small vasculature. (a) Single position fully-sampled synthetic aperture image. The dotted circles within the inset region indicate three anechoic targets and the dotted rectangle outside the inset region represents the surrounding tissue. (b) Swept synthetic aperture image over a span of 35.0 degrees. The displayed dynamic range is 60 dB.
It is worth noting that in both cases improvements are seen throughout the image, not just at the center of rotation. The synthetic aperture is created wherever there exists overlap between multiple transmit events. The use of a diverging wave enables the formation of a large effective aperture beginning within the first few centimeters from the transducer face at the expense of signal-to-noise ratio at depth.
V. Discussion and Conclusions
We have experimentally explored the feasibility of swept synthetic aperture imaging using a simplified mechanical system and performed tests of effects that would degrade the PSF. The observed improvements in image quality with increasing aperture size would also be applicable to a large conventional array if one were constructed. At the price of significantly increased channel count and cost, a large array would improve the scan time from one second for the device presented here to tens of milliseconds and remove the complication of mechanical errors.
The swept aperture system is also a powerful tool for investigational work requiring unconventional array sizes or shapes. As in [17], data could be processed with varying apodizations to study the effect of aperture size and weighting with matched in vivo data sets. The large spatial extent of the data sets, including interrogations from numerous angles, could provide insight into clutter and serve as a platform to test new adaptive algorithms to remove it. The technology gives new capabilities to track motion from multiple angles and to compensate the resulting images for both target and transducer motion. The ability to create arbitrary array patterns and to collect full synthetic aperture data sets allows great flexibility in asking fundamental questions about acoustics and image quality that could otherwise only be studied by constructing these arrays at great expense or in simulation.
Aberration is one complication that warrants more study in vivo in the context of the large coherent aperture formed. Aberration correction can be performed by treating the tissue layer as a phase screen in front of each element of the array, adjusting the focal delays for each aperture position on transmit and receive using cross-correlation across the array [34] or optimizing a quality factor such as point target size or speckle brightness [35]. As the effective aperture size grows, the magnitude of and the degradation caused by the aberration are expected to increase [31], [36]. However, a larger aperture can capture a wider extent of the returning wavefront and enable more accurate aberration correction [32], [37]. Where aberration correction is not possible, perhaps due to computational complexity or inadequate channel signal-to-noise ratio, using a large aperture allows the omission of apertures that are not coherent with the accumulated image or the use of a combination of coherent and incoherent compounding to take advantage of all acquired data [38], [39].
Tissue motion limits the total scan time available to form a coherent aperture. During a breath hold, cardiac-induced axial motion in the abdomen can peak around 1 mm/s [40]. The effect of lateral and elevational motion on coherent summation depends on the PSF width and therefore worsens with increased effective aperture size [41]. Work to develop motion compensation algorithms and faster acquisition sequences will be important to robust implementation of swept synthetic aperture imaging. Due to the cyclical nature of cardiac-induced motion, it may also be possible to use frames from multiple cycles in a longer acquisition if the correlation can be detected across varying spatial locations.
Future studies will require a more mechanically advanced system in order to reliably produce images using large coherent apertures. The current system is limited in that it assumes a known relationship between the rotary encoder and the face of the transducer. Any deflection of the transducer relative to the rotating shaft due to applied force, contact with the patient or vibration due to the natural frequencies of the rigid arm are not tracked and cause a failure of the synthetic aperture beamforming. A system that precisely tracks the transducer with six degrees of freedom would allow for correction of these issues and allow for easier scanning of a patient outside of a water tank. Additionally, such a system would allow for more favorable viewing angles and acoustic windows, providing the ability to steer around the rib cage. With the use of a matrix array, arbitrary interrogation of the region of interest in three dimensions could be used to build up higher-resolution volumes than current aperture sizes allow.
Acknowledgments
The authors would like to thank Lily Kuo and Shalki Kumar for their contributions in organizing and conducting aberration experiments, Trisha Lian for assisting in preliminary experiments, and Roger Nightingale, Peter Hollender and Matthew Lu for their contributions in developing the prototype mechanical device. The authors wish to thank the ultrasound division at Siemens Medical Solutions USA, Inc. for their in-kind and technical support.
This work is supported by NIH grants R01-EB017711 and T32-EB001040 from the National Institute of Biomedical Imaging and Bioengineering and NSF Grant RI-Medium: 1162095
Contributor Information
Nick Bottenus, Department of Biomedical Engineering, Duke University, Durham, NC.
Will Long, Department of Biomedical Engineering, Duke University, Durham, NC.
Haichong K. Zhang, Department of Computer Science, Johns Hopkins University, Baltimore, MD
Marko Jakovljevic, Department of Biomedical Engineering, Duke University, Durham, NC.
David P. Bradway, Department of Biomedical Engineering, Duke University, Durham, NC
Emad M. Boctor, Department of Radiology, Johns Hopkins University, Baltimore, MD
Gregg E. Trahey, Department of Biomedical Engineering, Duke University, Durham, NCDepartment of Radiology, Duke University Medical Center, Durham, NC
References
- 1.Holmes J, Howry D, Posakony GJ, Cushman C. The ultrasonic visualization of soft tissue structures in the human body. Transactions of the American Clinical and Climatological Association. 1955;66:208–225. [PMC free article] [PubMed] [Google Scholar]
- 2.Weng L, Tirumalai A, Lowery C. US extended-field-of-view imaging technology. Radiology. 1997;203(3):877–880. doi: 10.1148/radiology.203.3.9169720. [DOI] [PubMed] [Google Scholar]
- 3.Shattuck D, von Ramm O. Compound scanning with a phased array. Ultrasonic Imaging. 1982;4:93–107. doi: 10.1177/016173468200400201. [DOI] [PubMed] [Google Scholar]
- 4.Lockwood GR, Talman JR, Brunke SS. Real-time 3-D ultrasound imaging using sparse synthetic aperture beamforming. IEEE Transactions on Ultrasonics Ferroelectrics and Frequency Control. 1998 Jan.45(4):980–988. doi: 10.1109/58.710573. [DOI] [PubMed] [Google Scholar]
- 5.Greenleaf J, Johnson S, Lee S, Woo E. Algebraic reconstruction of spatial distributions of acoustic absorption within tissue from their two-dimensional acoustic projections. Acoustical Holography. 1974;5:591–603. [Google Scholar]
- 6.Pedersen MH, Gammelmark KL, Jensen JA. In-vivo evaluation of convex array synthetic aperture imaging. Ultrasound in medicine & biology. 2007;33(1):37–47. doi: 10.1016/j.ultrasmedbio.2006.07.041. [DOI] [PubMed] [Google Scholar]
- 7.Gammelmark K, Jensen J. Multielement synthetic transmit aperture imaging using temporal encoding. Medical Imaging, IEEE Transactions on. 2003 Apr;22(4):552–563. doi: 10.1109/TMI.2003.809088. [DOI] [PubMed] [Google Scholar]
- 8.Corl P, Grant P, Kino G. A Digital Synthetic Focus Acoustic Imaging System for NDE. 1978 Ultrasonics Symposium. 1978:263–268. [Google Scholar]
- 9.Karaman M, Li P-C, O’Donnell M. Synthetic Aperture Imaging for Small Scale Systems. IEEE Transactions on Ultrasonics, Ferroelectrics and Frequency Control. 1995;42(3):429–442. doi: 10.1109/58.710591. [DOI] [PubMed] [Google Scholar]
- 10.Frazier CH, O’Brien WD., Jr Synthetic Aperture Techniques with a Virtual Source Element. IEEE Transactions on Ultrasonics, Ferroelectrics and Frequency Control. 1998;45(1):196–207. doi: 10.1109/58.646925. [DOI] [PubMed] [Google Scholar]
- 11.Walker WF, Trahey GE. The application of k-space in pulse echo ultrasound. IEEE Transactions on Ultrasonics, Ferroelectrics and Frequency Control. 1998 Jan.45(3):541–558. doi: 10.1109/58.677599. [DOI] [PubMed] [Google Scholar]
- 12.Johnson JA, Karaman M, Khuri-Yakub BT. Coherent-array imaging using phased subarrays. Part I: basic principles. IEEE Transactions on Ultrasonics, Ferroelectrics and Frequency Control. 2005 Jan.52(1):37–50. doi: 10.1109/tuffc.2005.1397349. [DOI] [PubMed] [Google Scholar]
- 13.Nikolov S, Jensen J. Virtual ultrasound sources in high-resolution ultrasound imaging. Proceedings of SPIE. 2002;4687:395–405. [Google Scholar]
- 14.Andresen H, Nikolov S, Pedersen MM, Buckton D, Jensen JA. Three-dimensional synthetic aperture focusing using a rocking convex array transducer. IEEE Transactions on Ultrasonics Ferroelectrics and Frequency Control. 2010 May;57(5):1051–1063. doi: 10.1109/TUFFC.2010.1517. [DOI] [PubMed] [Google Scholar]
- 15.Nikolov S, Jensen J. Three-dimensional real-time synthetic aperture imaging using a rotating phased array transducer. 2002 IEEE Ultrasonics Symposium, pp. 2002:1585–1588. [Google Scholar]
- 16.Andresen H, Nikolov SI, Jensen JA. Synthetic aperture focusing for a single-element transducer undergoing helical motion. IEEE Transactions on Ultrasonics Ferroelectrics and Frequency Control. 2011;58(5):935–943. doi: 10.1109/TUFFC.2011.1894. [DOI] [PubMed] [Google Scholar]
- 17.Bottenus N, Byram BC, Trahey GE. A synthetic aperture study of aperture size in the presence of noise and in vivo clutter. Proceedings of SPIE. 2013 Mar.8675:1–10. [Google Scholar]
- 18.Hansen RE. Introduction to Synthetic Aperture Sonar. In: Kolev PN, editor. Sonar Systems. InTech; 2011. pp. 3–29. ch. 1. [Google Scholar]
- 19.Morin R, Bidon S, Basarab A, Kouame D. Semi-blind deconvolution for resolution enhancement in ultrasound imaging. 2013 20th IEEE International Conference on Image Processing. 2013:1413–1417. [Google Scholar]
- 20.Morin R, Basarab A, Bidon S, Kouamé D. Motion estimation-based image enhancement in ultrasound imaging. Ultrasonics. 2015 Jul.60:19–26. doi: 10.1016/j.ultras.2015.02.003. [DOI] [PubMed] [Google Scholar]
- 21.Bottenus N, Jakovljevic M, Boctor E, Trahey GE. Implementation of swept synthetic aperture imaging. Proc. SPIE 9419, Medical Imaging 2015: Ultrasonic Imaging and Tomography. 2015 Mar. [Google Scholar]
- 22.Zhang HK, Ergun E, Trahey GE, Boctor EM. SPIE Medical Imaging. International Society for Optics and Photonics; 2015. Synthetic aperture ultrasound imaging with robotic aperture extension; pp. 94 190L–94 190L. [Google Scholar]
- 23.Bottenus N, Long W, Bradway D, Trahey G. Phantom and in vivo demonstration of swept synthetic aperture imaging. Ultrasonics Symposium (IUS), 2015 IEEE International. 2015 Oct.:1–4. [Google Scholar]
- 24.Jensen JA, Svendsen NB. Calculation of pressure fields from arbitrarily shaped, apodized, and excited ultrasound transducers. IEEE Transactions on Ultrasonics, Ferroelectrics, and Frequency Control. 1992;39(2):262–267. doi: 10.1109/58.139123. [DOI] [PubMed] [Google Scholar]
- 25.Jensen JA. Field: A Program for Simulating Ultrasound Systems. Medical & Biological Engineering & Computing. 1996;34(Supplement 1):351–353. Part 1. [Google Scholar]
- 26.Madsen EL, Zagzebski JA, Banjavic RA, Burlew MM. Phantom material and method. 1981 [Google Scholar]
- 27.Lovett JR. Merged seawater sound-speed equations. The Journal of the Acoustical Society of America. 1978;63(6):1713–1718. [Google Scholar]
- 28.Smith SW, Wagner RF, Sandrik JMF, Lopez H. Low contrast detectability and contrast/detail analysis in medical ultrasound. IEEE Transactions on Sonics and Ultrasonics. 1983;3(3):164–173. [Google Scholar]
- 29.Jakovljevic M, Kumar S, Kuo L, Trahey GE. Transcostal Imaging with Large Coherent Apertures: Ex Vivo Studies. 2014 IEEE International Ultrasonics Symposium. 2014 Sep.:1698–1701. [Google Scholar]
- 30.Ranganathan K, Walker WF. Cystic resolution: a performance metric for ultrasound imaging systems. IEEE Transactions on Ultrasonics, Ferroelectrics and Frequency Control. 2007 Apr.54(4):782–92. doi: 10.1109/tuffc.2007.311. [DOI] [PubMed] [Google Scholar]
- 31.Moshfeghi M, Waag R. In vivo and in vitro ultrasound beam distortion measurements of a large aperture and a conventional aperture focussed transducer. Ultrasound in Medicine & Biology. 1988;14(5):415–428. doi: 10.1016/0301-5629(88)90077-4. [DOI] [PubMed] [Google Scholar]
- 32.Liu D-LD, Waag R. Estimation and correction of ultrasonic wavefront distortion using pulse-echo data received in a two-dimensional aperture. IEEE Transactions on Ultrasonics, Ferroelectrics and Frequency Control. 1998 Jan.45(2):473–90. doi: 10.1109/58.660157. [DOI] [PubMed] [Google Scholar]
- 33.Blackall J, Rueckert D, Maurer J, R C, Penney G, Hill D, Hawkes D. An image registration approach to automated calibration for freehand 3d ultrasound,” vol. 2000;1935:462–471. [Google Scholar]
- 34.Flax SW, O’Donnell M. Phase-aberration correction using signals from point reflectors and diffuse scatterers: basic principles. IEEE Transactions on Ultrasonics, Ferroelectrics and Frequency Control. 1988 Jan.35(6):758–67. doi: 10.1109/58.9333. [DOI] [PubMed] [Google Scholar]
- 35.Nock L, Trahey GE, Smith SW. Phase aberration correction in medical ultrasound using speckle brightness as a quality factor. The Journal of the Acoustical Society of America. 1989 May;85(5):1819–1833. doi: 10.1121/1.397889. [DOI] [PubMed] [Google Scholar]
- 36.Durgin H, Freiburger P, Sullivan D, Trahey G. Large aperture phase error measurement and effects. 1992 Ultrasonics Symposium. 1992:623–628. [Google Scholar]
- 37.Huang D, Tsao J. Aperture size effect on ultrasonic wavefront distortion correction. IEEE Transactions on Ultrasonics, Ferroelectrics and Frequency Control. 2004;51(5) [PubMed] [Google Scholar]
- 38.Ustuner K, Bolorforosh M, Gee A. US Patent 6,432,054. Medical ultrasonic imaging with adaptive synthesis and compounding. 2002
- 39.Hansen J, Jensen J. Compounding in Synthetic Aperture Imaging. IEEE Transactions on Ultrasonics, Ferroelectrics, and Frequency Control. 2012;59(9):2054–2065. doi: 10.1109/TUFFC.2012.2427. [DOI] [PubMed] [Google Scholar]
- 40.Harris EJ, Miller NR, Bamber JC, Symonds-Tayler JRN, Evans PM. Speckle tracking in a phantom and feature-based tracking in liver in the presence of respiratory motion using 4D ultrasound. Physics in medicine and biology. 2010 Jun.55(12):3363–3380. doi: 10.1088/0031-9155/55/12/007. [DOI] [PubMed] [Google Scholar]
- 41.Gammelmark K, Jensen J. 2-D tissue motion compensation of synthetic transmit aperture images. IEEE Transactions on Ultrasonics, Ferroelectrics and Frequency Control. 2014;61(4):594–610. [Google Scholar]


